. 2025 May 9;23(1):219.
doi: 10.1186/s12964-025-02211-1.

HIF-1α regulated GLUT1-mediated glycolysis enhances Treponema pallidum-induced cytokine responses

Affiliations

HIF-1α regulated GLUT1-mediated glycolysis enhances Treponema pallidum-induced cytokine responses

Shun Xiong et al. Cell Commun Signal. .

Abstract

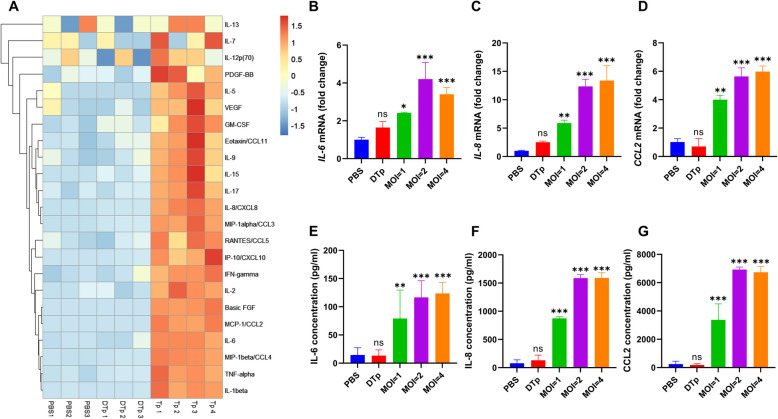
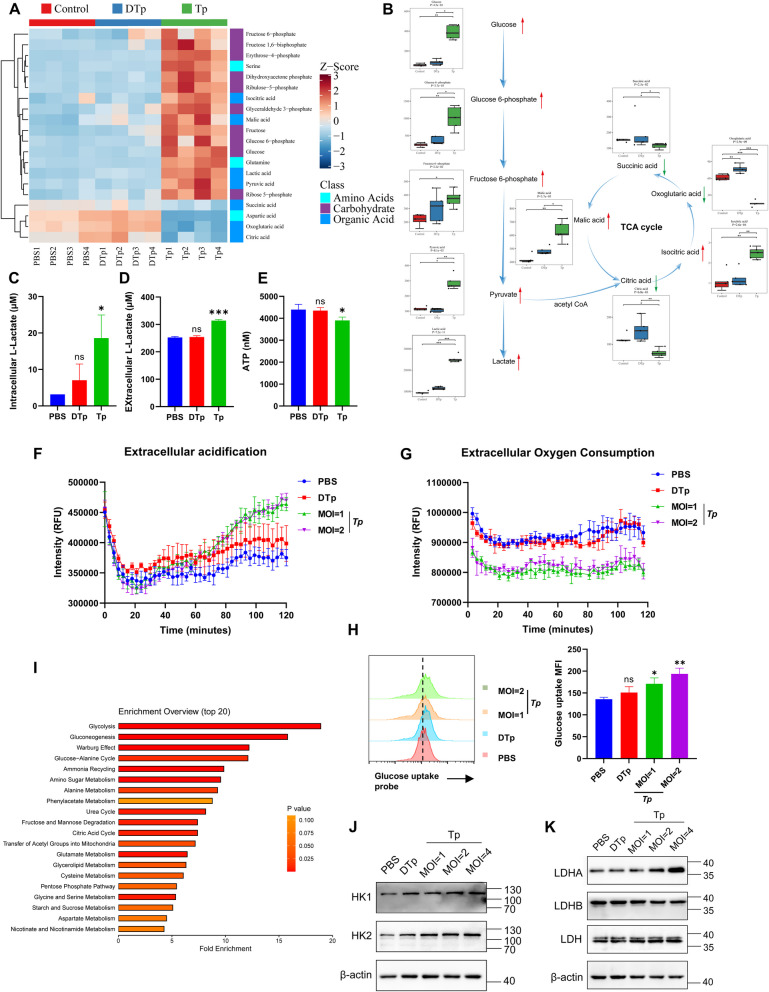
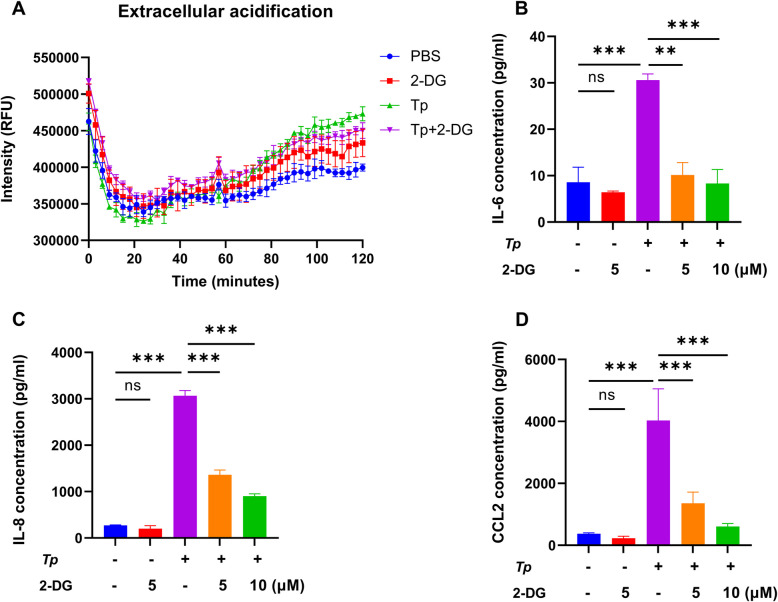
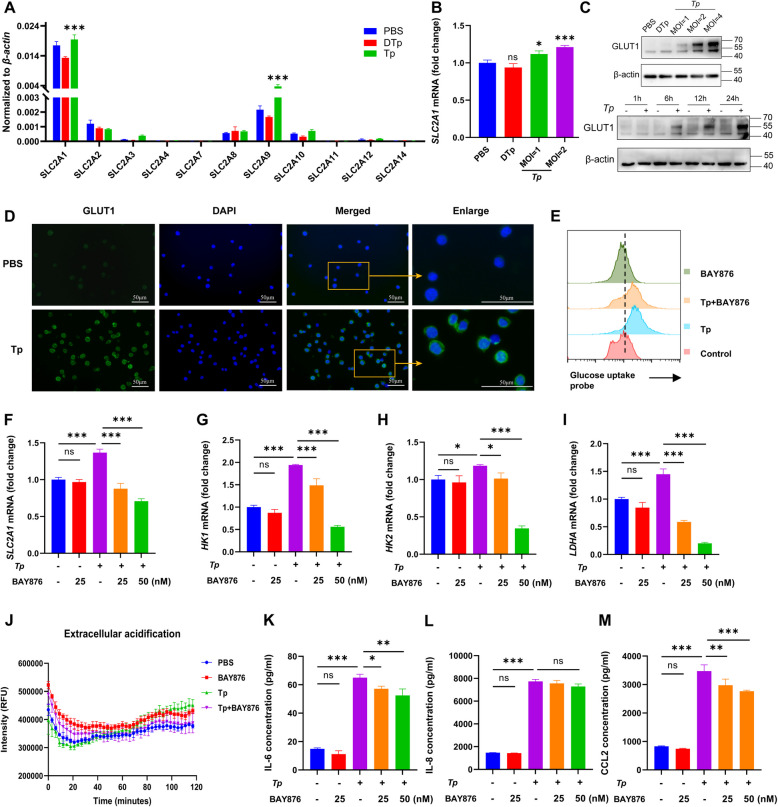
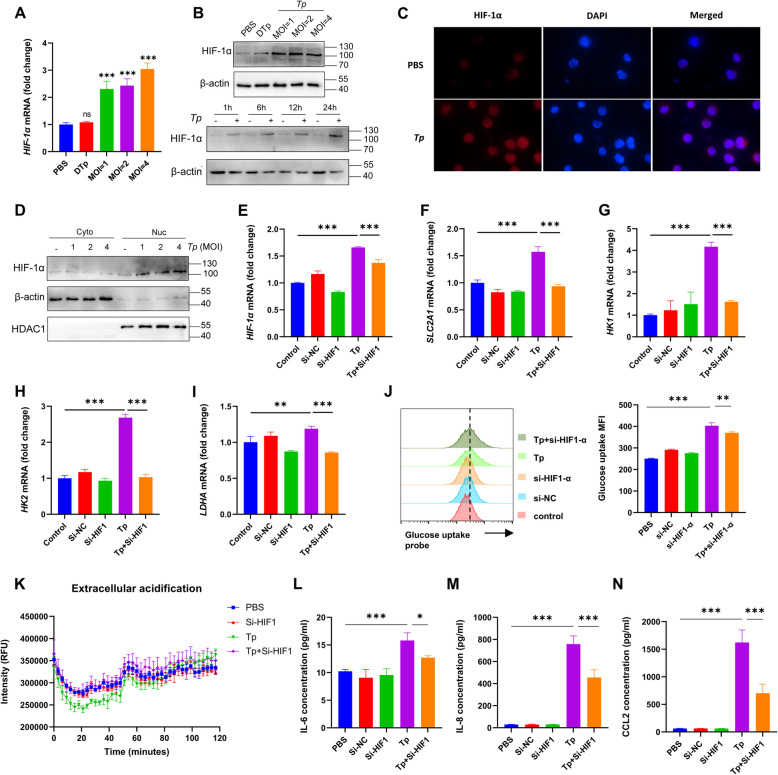
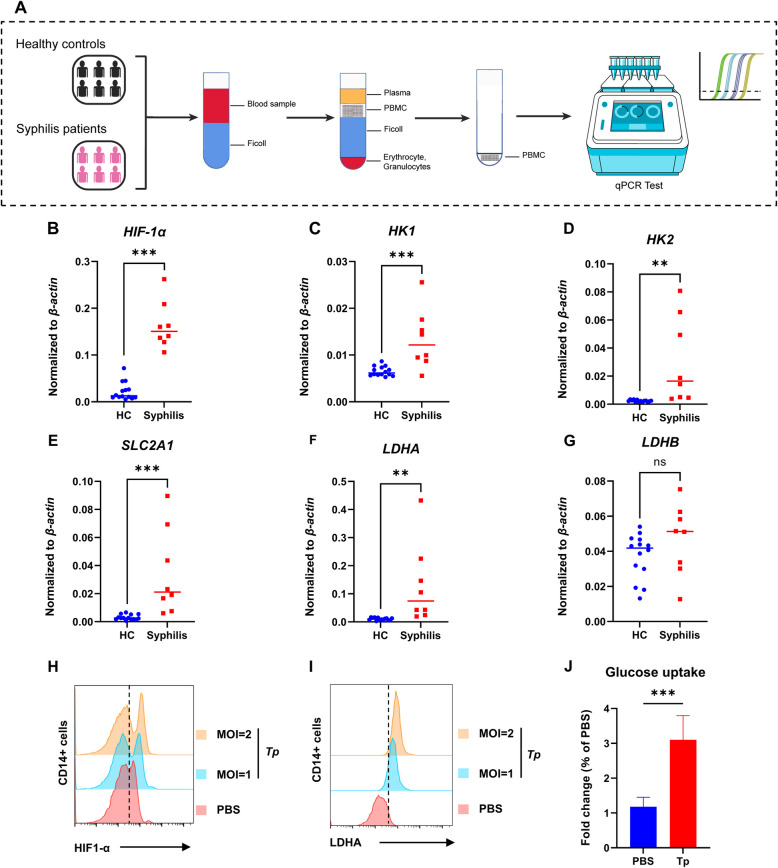
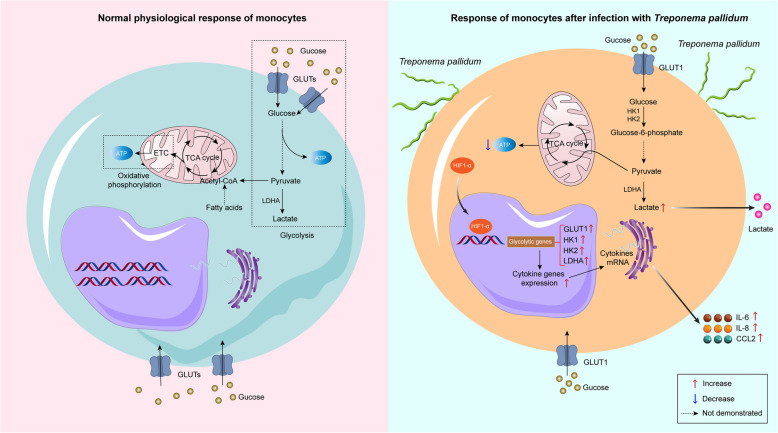
Syphilis, caused by Treponema pallidum (Tp), represents a significant public health challenge. The clinical manifestations of syphilis are attributed to local inflammatory responses induced by Tp, notably monocyte infiltration into local lesions and the secretion of inflammatory cytokines. However, the mechanisms driving cytokine production in response to Tp infection remain largely unknown. Given that increased glycolysis is associated with inflammatory responses, we aimed to investigate the role of glycolysis in Tp-induced secretion of inflammatory cytokines. In this study, we found that Tp promotes the secretion of inflammatory cytokines IL-6, IL-8, and CCL2 from monocytes while enhancing glycolysis through increased GLUT1 plasma membrane expression and glucose uptake. Importantly, inhibiting glycolysis and GLUT1 reduced the Tp-induced secretion of monocyte inflammatory cytokines. Additionally, Tp significantly increased HIF-1α expression and induced its nuclear translocation, thereby promoting glycolysis by upregulating the expression of GLUT1 and LDHA glycolytic enzymes. Knockdown of HIF-1α inhibits Tp-induced monocyte cytokine secretion, highlighting the crucial role of HIF-1α-mediated glycolysis in the cytokine response to Tp. Also, expression of HIF-1α and an increase in glycolysis were confirmed in patients with syphilis. In conclusion, we demonstrated that HIF-1α-regulated GLUT1-mediated glycolysis enhances inflammatory cytokine secretion following Tp infection. Our findings not only elucidate the mechanism of glycolysis in Tp-induced inflammatory responses in monocytes but also contribute to the development of a potential biomarker in syphilis diagnosis and treatment.

Keywords: Treponema pallidum; HIF-1α; Glycolysis; Inflammatory; Monocyte.


Conflict of interest statement

Declarations. Competing interests: The authors declare no competing interests.

Figures

Fig. 1
Fig. 1
Tp induces cytokine production from monocytes. A THP-1 cells were treated with PBS, DTp, or Tp (MOI of 2:1) for 24 h. The quantitative detection of 27 cytokines in the cell culture supernatant was conducted using luminex technology. Heat map depicting hierarchical clustering of cytokine concentrations, where red denotes higher concentrations and blue denotes lower concentrations. Three cytokines were randomly selected. B-D qRT-PCR-based analysis of cytokines mRNA expression in THP-1 cells treated with PBS, DTp, and Tp (MOI of 1:1, 2:1, 4:1). EG The concentrations of cytokines in the cell culture supernatants of THP-1 cells, treated with PBS, DTp, and Tp (MOI of 1:1, 2:1, and 4:1), were confirmed using ELISA. The data are shown as the mean ± SD. Statistical significance tested by one-way ANOVA test. *P < 0.05, **P < 0.01, ***P < 0.001, ns: no significant, n = 3
Fig. 2
Fig. 2
Monocytes become overtly glycolytic following Tp treatment. AB Metabolomics analysis was conducted to detect alterations in metabolite levels following treatment of THP-1 cells for 24 h with PBS or Tp (MOI of 2:1). A Hierarchical clustered heatmap of differential metabolites identified as potential biomarkers. The metabolites are categorized into three major classes: amino acids, carbohydrates, and organic acids. Each row represents an individual metabolite, and each column corresponds to a sample. B Schematic representation illustrating changes in metabolites associated with the glycolysis pathway and the tricarboxylic acid (TCA) cycle. Arrows indicate relative changes in the Tp group compared to the PBS control. Red arrows represent metabolites that are upregulated following Tp treatment, while green arrows indicate downregulated metabolites. C Intracellular and (D) extracellular lactate concentrations, along with (E) intracellular ATP levels, were quantified after 24 h of treatment with PBS, DTp, or Tp (MOI of 2:1). Data are presented as mean ± SD. Statistical significance tested by unpaired, two-tailed Student’s test. F-G THP-1 cells were treated with PBS, DTp, or Tp (MOI of 1:1, 2:1) for 24 h. F The glycolysis assay detects the time course of real-time changes in extracellular acidification. G Time course of real-time changes in the OCR after the extracellular oxygen consumption assay. H Glucose uptake by THP-1 cells was measured by flow cytometry after 24 h of treatment by Tp (MOI of 1:1, 2:1). Statistical significance tested by one-way ANOVA test. I TOP 50 pathway enrichment analysis of differential metabolite sets. Western-blot-based analysis of (J) HK1, HK2, and (K) LDHA, LDHB, and LDH protein expression in THP-1 cells treated with PBS, DTp, or Tp (MOI of 1:1, 2:1, 4:1) for 24 h. The data are presented as the mean ± SD of three independent experiments. *P < 0.05, **P < 0.01, *** P < 0.001, ns: no significant
Fig. 3
Fig. 3
Tp-induced cytokine production is associated with an increase in glycolysis. A The glycolysis inhibitor 2-DG (5μM) was pretreated for 2 h and treated with Tp (MOI of 2:1) for 24 h. The time course of real-time changes in extracellular acidification after the glycolysis assay. B-D The glycolysis inhibitor 2-DG (5μM or 10μM) was pretreated for 2 h and treated with Tp (MOI of 2:1) for 24 h. B IL-6, (C) IL-8, and (D) CCL2 concentrations in the cell culture supernatants of THP-1 cells were quantified by ELISA. The data are presented as the mean ± SD of three independent experiments. Statistical significance tested by one-way ANOVA test. *P < 0.05, **P < 0.01, ***P < 0.001, ns: no significant
Fig. 4
Fig. 4
GLUT1 drives Tp-induced cytokine production and increased glycolysis. A THP-1 cells were treated with PBS, DTp, and Tp (MOI of 2:1) for 24 h. Gene expression of different glucose transporters was measured by qRT-PCR, normalized to β-actin. B The mRNA levels of SLC2 A1 after THP-1 cells were treated with PBS, DTp, and Tp (MOI of 1:1, 2:1) for 24 h. C The expression of GLUT1 protein after THP-1 cells were treated with different concentrations of Tp (MOI of 1:1, 2:1, 4:1) for 24 h was measured by Western blot. Expression of GLUT1 protein after THP-1 cells were treated with Tp (MOI of 2:1) for different times was measured by Western blot. D GLUT1 membrane localization in THP-1 cells treated with PBS or Tp was assessed by immunofluorescence microscopy. Yellow arrows indicate the enlargement of some cells. The imaging is representative of three experiments. F-I THP-1 cells were pretreated with the GLUT1-specific inhibitor BAY876 (25, 50 nM) for 2 h and then cocultured with Tp (MOI of 2:1) for 24 h. The mRNA levels of (F) SLC2 A1, (G) HK1, (H) HK2, and (I) LDHA were detected by qRT-PCR. E Glucose uptake by THP-1 cells was measured by flow cytometry. J The time course of real-time changes in extracellular acidification after the glycolysis assay. K IL-6, (L) IL-8, and (M) CCL2 concentrations in the cell culture supernatants of THP-1 cells were quantified by ELISA. The data are shown as the mean ± SD. Statistical significance tested by one-way ANOVA test. *P < 0.05, **P < 0.01, ***P < 0.001, ns: no significant, n = 3
Fig. 5
Fig. 5
HIF-1α is involved in the regulation of GLUT1-mediated glycolysis and cytokine secretion after Tp treatment of monocytes. A The mRNA levels of HIF-1α after THP-1 cells were treated with different concentrations of Tp (MOI of 1:1, 2:1, and 4:1) for 24 h. B The expression of HIF-1α protein after THP-1 cells were treated with different concentrations of Tp (MOI of 1:1, 2:1, and 4:1) for 24 h was measured by Western blot. Expression of the HIF-1α protein after THP-1 cells were treated with Tp (MOI of 2:1) for different times was measured by Western blot. C Representative images from immunofluorescence analysis of HIF-1α protein accumulation and nuclear localization in THP-1 cells treated by PBS or Tp. Nuclei were stained with DAPI. Immunofluorescence was observed and photographed by a fluorescence microscope. D Nuclear and cytoplasmic extraction reagents were used to extract the nuclear and cytoplasmic proteins from the cells. Western blot analysis was performed after THP-1 cells were treated with different concentrations of Tp (MOI of 1:1, 2:1, and 4:1) for 24 h. β-actin was used as a loading control of cytoplasmic protein (abbreviated as ‘Cyto’ in the figure), and HDAC1 was used as a loading control of nuclear protein (abbreviated as ‘Nuc’ in the figure). E-N THP-1 cells were transfected with Si-NC or Si-HIF-1α for 24 h, and then the transfected THP-1 cells were treated with Tp (MOI of 2:1) for 24 h. The mRNA levels of (E) HIF-1α, (F) SLC2 A1, (G) HK1, (H) HK2, and (I) LDHA were detected by qRT-PCR. J The glucose uptake capacity of THP-1 cells was analyzed by flow cytometry. K The time course of real-time changes in extracellular acidification after the glycolysis assay. L IL-6, (M) IL-8, and (N) CCL2 concentrations in the cell culture supernatants of THP-1 cells were quantified by ELISA. The data are presented as the mean ± SD of three independent experiments. Statistical significance tested by one-way ANOVA test. *P < 0.05, **P < 0.01, ***P < 0.001, ns: no significant
Fig. 6
Fig. 6
Expression analysis of PBMCs from syphilis disease patients. A Peripheral blood samples were collected from healthy controls and syphilis patients with obvious inflammatory pathological manifestations. Mononuclear cells were isolated using a lymphocyte separation solution, and total RNA in the cells was extracted for qRT-PCR detection. Gene expression in (B) HIF-1α, (C) HK1, (D) HK2, (E) SLC2 A1, (F) LDHA, and (G) LDHB in healthy controls (HC; n = 14) versus syphilis patients (n = 8). Tp promoted HIF-1α expression and increased glycolysis in CD14 + monocytes. Normal peripheral blood CD14 + monocytes were separated. CD14 + monocytes were divided into the PBS group and the live Tp (MOI of 1:1, 2:1) group and treated for 24 h, respectively. Flow cytometry was used to detect (H) HIF-1α and (I) LDHA protein expression. J A glucose uptake kit was used to detect the glucose uptake capacity of cells after CD14 + monocytes were treated with Tp (MOI of 2:1) for 24 h. The data are presented as the mean ± SD. Statistical significance tested by unpaired, two-tailed Student’s t test. **P < 0.01, ***P < 0.001, ****P < 0.0001, ns: no significant
Fig. 7
Fig. 7
HIF1-α regulates GLUT1-mediated glycolysis, leading to increased monocyte cytokine production following Treponema pallidum infection. Under normal physiological conditions, monocytes uptake glucose through various glucose transporters and metabolize it via glycolysis and mitochondrial respiration to maintain cellular homeostasis. Following Tp infection, there is an induction of HIF-1α expression in the nucleus of monocytes, leading to the upregulation of GLUT1, LDHA, and other glycolytic enzyme genes, thereby enhancing monocyte glycolysis and subsequently promoting monocyte cytokine secretion

Similar articles

References

    1. Xiong S, Liu Z, Zhang X, et al. Resurgence of syphilis: focusing on emerging clinical strategies and preclinical models. J Transl Med. 2023;21(1):917. 10.1186/s12967-023-04685-4. - PMC - PubMed
    1. Kojima N, Siebert JC, Maecker H, et al. Cytokine expression in Treponema pallidum infection. J Transl Med. 2019;17(1):196. 10.1186/s12967-019-1947-7. - PMC - PubMed
    1. Liu Z, Zhang X, Xiong S, et al. Endothelial dysfunction of syphilis: Pathogenesis. J Eur Acad Dermatol Venereol. 2024. 10.1111/jdv.19899. - PubMed
    1. Bhugra P, Maiti A. Secondary Syphilis. N Engl J Med. 2020;383(14):1375. 10.1056/NEJMicm2001103. - PubMed
    1. Forrestel AK, Kovarik CL, Katz KA. Sexually acquired syphilis: Historical aspects, microbiology, epidemiology, and clinical manifestations. J Am Acad Dermatol. 2020;82(1):1–14. 10.1016/j.jaad.2019.02.073. - PubMed

LinkOut - more resources