

Prevalence and antimicrobial resistance profile of Listeria spp. isolated from raw fish
- PMID: 40346558
- PMCID: PMC12065245
- DOI: 10.1186/s12917-025-04792-y
Prevalence and antimicrobial resistance profile of Listeria spp. isolated from raw fish
Abstract
Background: Listeria spp. contamination in food, particularly antimicrobial-resistant strains, poses an escalating concern for public health. This study investigated the prevalence and antimicrobial resistance profiles of Listeria spp. isolated from raw fish collected from diverse sources in Northern Poland.
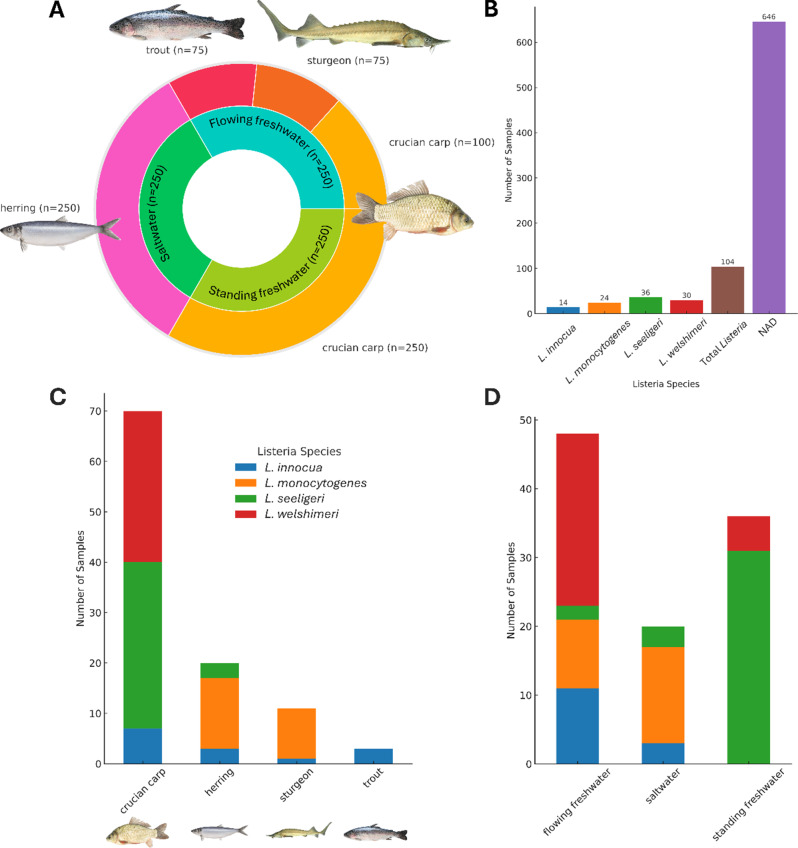
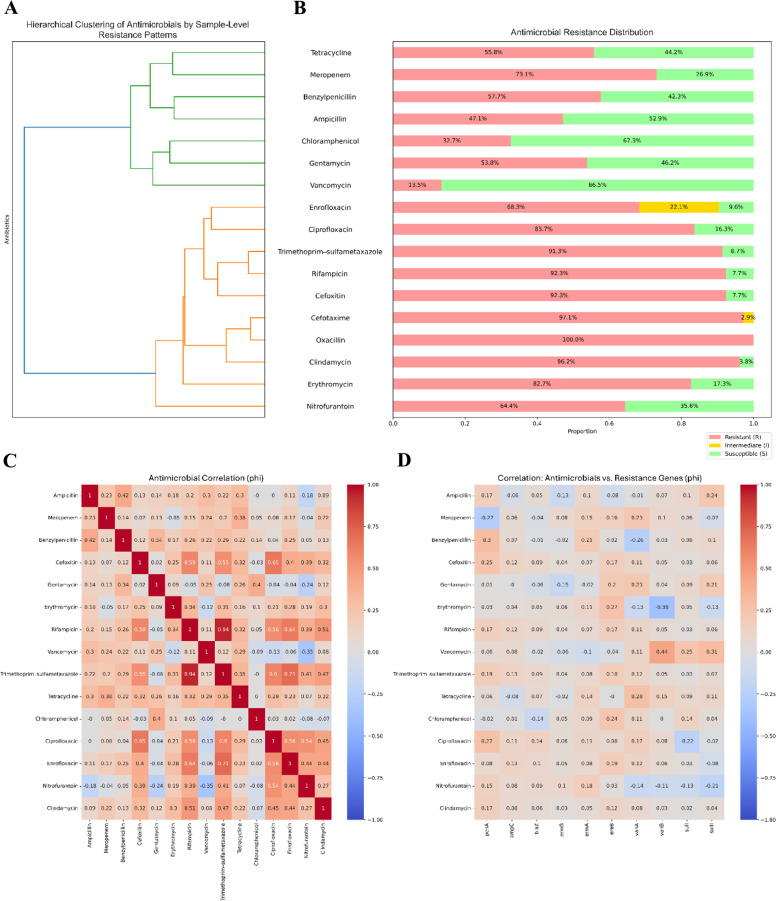
Methods: A total of 750 raw fish samples were collected from standing freshwater tanks, flowing freshwater reservoirs, and a saltwater reservoir. Isolation was performed following the standard protocol, which describes the horizontal method for detecting Listeria spp., including Listeria monocytogenes. The antimicrobial resistance profiles of isolated strains were performed using the disk diffusion method. Antimicrobial resistance genes were identified using PCR, targeting 11 genes associated with resistance to β-lactams, macrolides, glycopeptides, and sulfonamides. Statistical analyses included Phi correlation coefficients, hierarchical clustering, and logistic regression to examine associations between phenotypic resistance patterns and antimicrobial resistance genes.
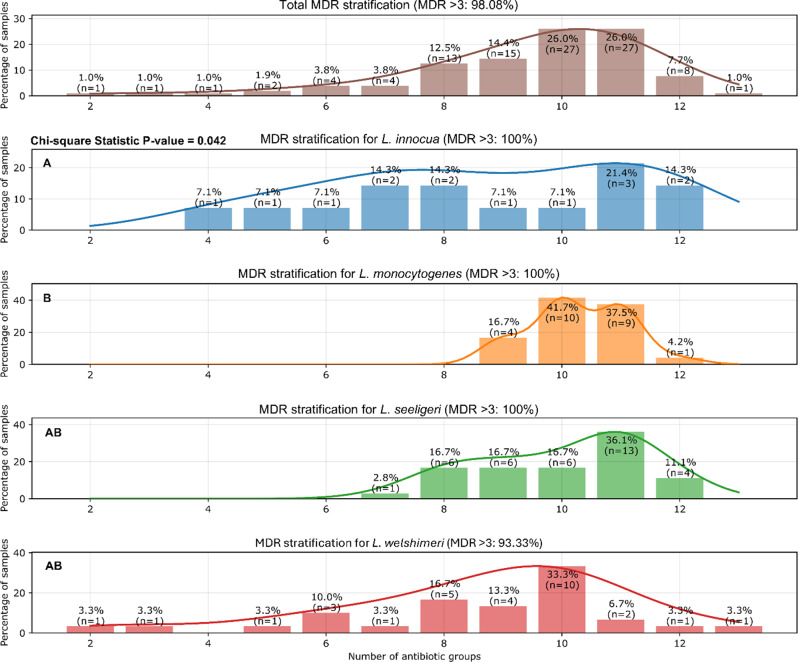
Results: Listeria spp. was isolated from 13.9% of samples (104 positive samples), comprising L. seeligeri (34.6%), L. welshimeri (28.8%), L. monocytogenes (23.1%), and L. innocua (13.5%). Phenotypic antimicrobial susceptibility testing revealed universal resistance to oxacillin (100%) across all Listeria spp. isolates. High resistance levels were also observed for cefotaxime (97.1%), cefoxitin (92.3%), rifampicin (92.3%), clindamycin (96.2%), and trimethoprim-sulfamethoxazole (91.3%). Alarmingly, 98.1% of all Listeria spp. isolates exhibited multidrug resistance (MDR), reaching 100% MDR among L. monocytogenes isolates. Specifically, L. monocytogenes isolates exhibited complete resistance to meropenem, cefoxitin, cefotaxime, rifampicin, and trimethoprim-sulfamethoxazole, and significant resistance to ciprofloxacin (91.7%), clindamycin (83.3%), tetracycline (75.0%), erythromycin (75.0%), benzylpenicillin (70.8%), and nitrofurantoin (70.8%). Molecular analysis identified blaTEM (100%), ampC (37.5%), and ereB (37.5%) as the most prevalent antimicrobial resistance genes in L. monocytogenes.
Conclusions: The exceptionally high prevalence of multidrug-resistant Listeria spp., particularly L. monocytogenes, in raw fish underscores a critical public health risk, suggesting the urgent need for ongoing surveillance and robust risk mitigation strategies in aquaculture and seafood processing. The elevated antimicrobial resistance levels may also indicate aquatic environmental contamination, warranting further investigation into the sources and broader ecological implications of antimicrobial resistance in these ecosystems.
Keywords: Listeria monocytogenes; Aquaculture; Multidrug resistance; Raw fish; Seafood safety.
© 2025. The Author(s).
Conflict of interest statement
Declarations. Ethics approval and consent to participate: Not applicable. Consent for publication: Not applicable. Competing interests: The authors declare no competing interests.
Figures
Similar articles
-
Comparative antimicrobial susceptibility of Listeria monocytogenes, L. innocua, and L. welshimeri.Microb Drug Resist. 2009 Mar;15(1):27-32. doi: 10.1089/mdr.2009.0863. Microb Drug Resist. 2009. PMID: 19216646
-
Prevalence, antimicrobial susceptibility and virulotyping of Listeria species and Listeria monocytogenes isolated from open-air fish markets.BMC Microbiol. 2015 Jul 25;15:144. doi: 10.1186/s12866-015-0476-7. BMC Microbiol. 2015. PMID: 26209099 Free PMC article.
-
Antibiotic resistance in Listeria species isolated from catfish fillets and processing environment.Lett Appl Microbiol. 2010 Jun 1;50(6):626-32. doi: 10.1111/j.1472-765X.2010.02843.x. Epub 2010 Mar 24. Lett Appl Microbiol. 2010. PMID: 20406380
-
Pathogenicity, genotyping and antibacterial susceptibility of the Listeria spp. recovered from stray dogs.Microb Pathog. 2019 Jan;126:123-133. doi: 10.1016/j.micpath.2018.10.037. Epub 2018 Oct 28. Microb Pathog. 2019. PMID: 30381253
-
Global prevalence and antibiotic resistance profiles of bacterial pathogens in table eggs: A systematic review and meta-analysis.Vet World. 2025 Apr;18(4):939-954. doi: 10.14202/vetworld.2025.939-954. Epub 2025 Apr 23. Vet World. 2025. PMID: 40453930 Free PMC article. Review.
Cited by
-
Virulence Gene Profiling and Molecular Typing of Clinical Isolates of Listeria monocytogenes from Wenzhou, Eastern China.Infect Drug Resist. 2025 Aug 8;18:3957-3966. doi: 10.2147/IDR.S526926. eCollection 2025. Infect Drug Resist. 2025. PMID: 40799954 Free PMC article.
References
-
- Gómez-Laguna J, Cardoso-Toset F, Meza-Torres J, Pizarro-Cerdá J, Quereda JJ. Virulence potential of Listeria monocytogenes strains recovered from pigs in Spain. Vet Rec. 2020;187(11):e101. - PubMed
MeSH terms
Substances
LinkOut - more resources
Full Text Sources
Medical
Miscellaneous
