. 2025 May 10;21(1):334.
doi: 10.1186/s12917-025-04762-4.

Effect of PUFAs-ω3 and ω6 on oxidative stress of sheep erythrocytes

Affiliations

Effect of PUFAs-ω3 and ω6 on oxidative stress of sheep erythrocytes

Valeria Pasciu et al. BMC Vet Res. .

Abstract

Background: In recent years, the use of long-chain polyunsaturated fatty acids (PUFA) ω3 and ω6, as food supplements in livestock has increased due to their beneficial properties related to their antioxidant activity. It has been demonstrated however that a high intake of these substances has prooxidant and cell-damaging effects, especially if their circulating concentrations are unbalanced. Starting from these premises, and taking advantage of previous findings, the present study aimed at defining the optimal circulating concentrations and PUFAs ω3/ω6 ratio, to ensure the antioxidant/oxidant balance in sheep RBCs.

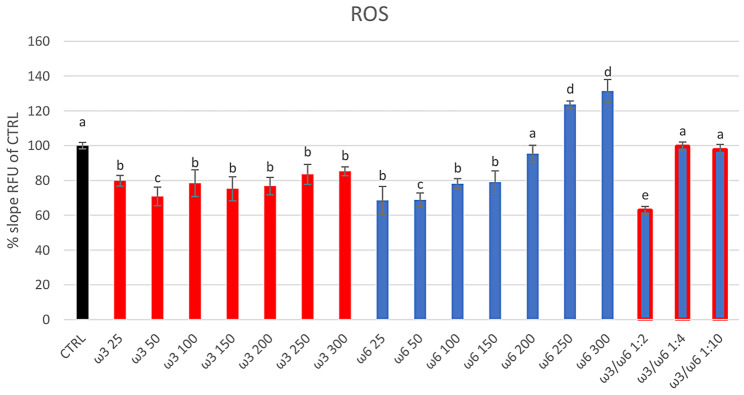
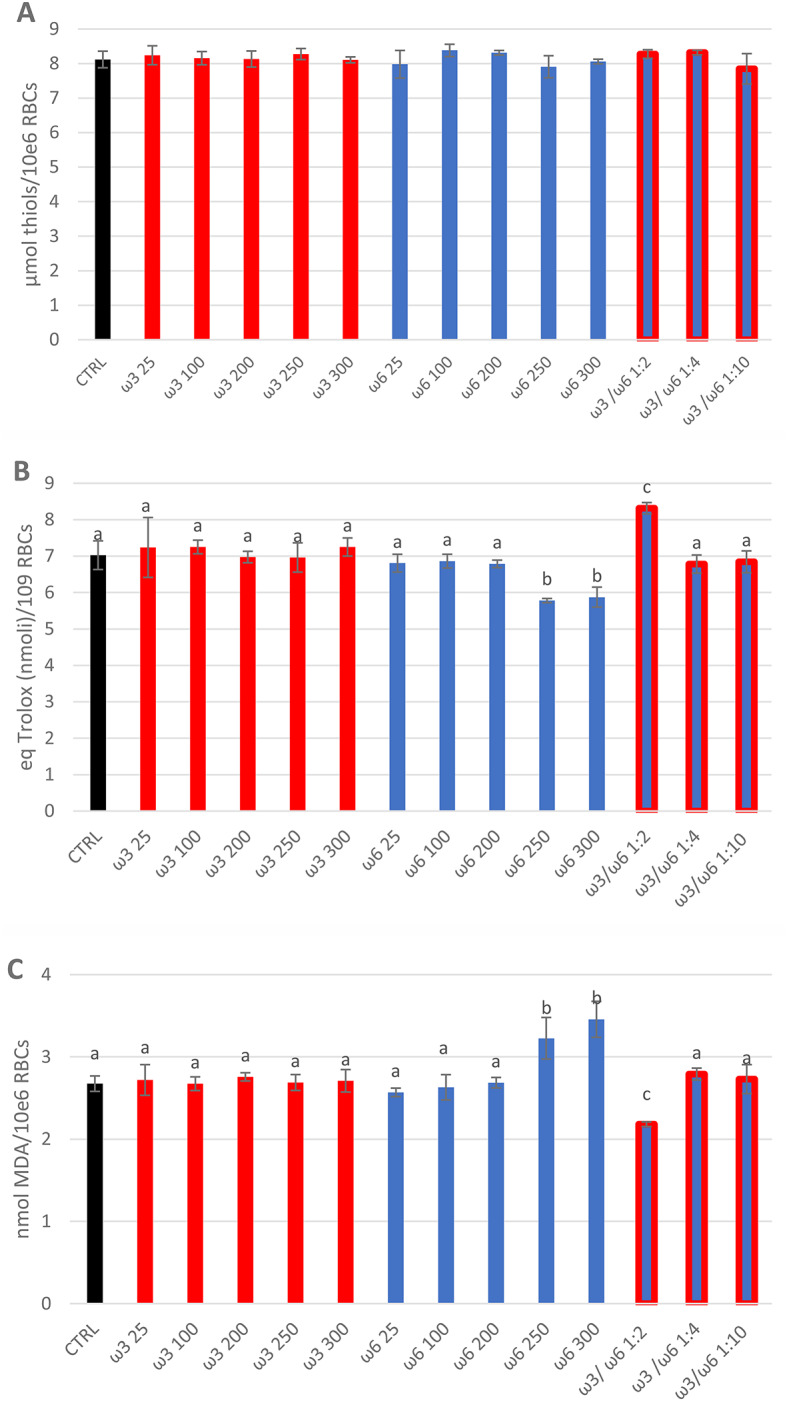
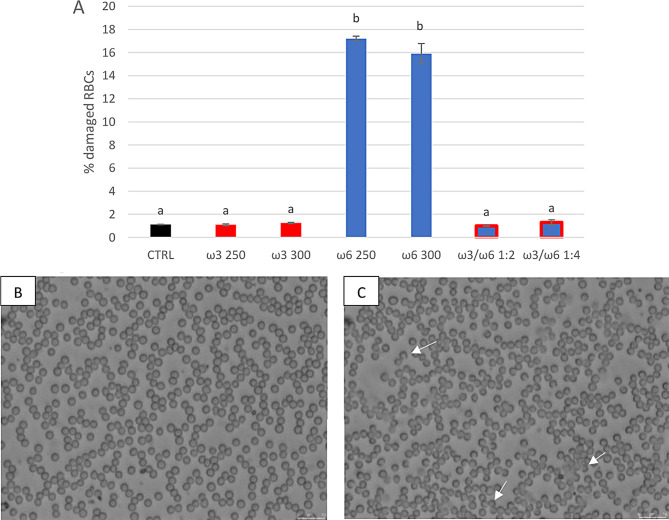
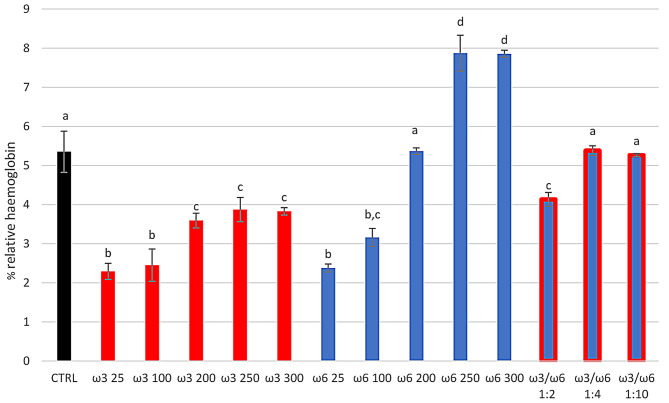
Results: All tested concentrations (25-300 µg/mL in PBS) of PUFAs-ω3 after 4 h of treatment on sheep RBCs, showed antioxidant properties with a significant decrease in reactive oxygen species (ROS) versus the control group (CTRL) (p < 0.05). Furthermore, ω6 showed an antioxidant effect at low concentrations (25-200 g/mL) but a pro-oxidant effect at the highest concentrations (250 and 300 µg/mL) with a significant increase in ROS production (123.6 ± 2.1 and 131.4 ± 6.5% sloope RFU of CTRL respectively p < 0,001), malondialdehyde (MDA) (p < 0.01), and haemolysis (p < 0.01) versus CTRL group (1.1 ± 0.1%), and, also with a decrease of Trolox equivalent antioxidant capacity (TEAC) (p < 0,05). The ratio ω3/ω6 of 1:10 (25/250 µg/mL) and 1:4 (25/100 µg/mL) showed an intracellular ROS level like the CTRL group whereas, the ratio 1:2 (100/200 µg/mL) resulted in a significant decrease in ROS production (62.71 ± 2.31% slope RFU of CTRL, p < 0.001) and MDA (p < 0.001), with an increase in TEAC (p < 0.05), and a decrease haemolysis versus the control group (p < 0,01).

Conclusions: Our results showed that a beneficial effect on the oxidative state of sheep RBCs was obtained with in vitro administration of low concentrations of ω6 and with all tested concentrations of ω3. The addition of ω6 at high concentrations leads to an imbalance in the PUFA ω3/ω6 ratio, compromising the oxidative state and viability of the RBCs. The maximum antioxidative effect was found at ω3/ω6 ratio 1:2).

Keywords: Antioxidant assays; Oxidative stress; PUFAs-ω3; PUFAs-ω6; Reactive oxygen species; Sheep erythrocytes.


Conflict of interest statement

Declarations. Ethics approval and consent to participate: All procedures involving animals in this study were approved by the Local Animal Care and Use Committee (Authorization code: 2899 of 17/01/2018). Consent for publication: All authors have read and agreed to the published version of the manuscript. Competing interests: The authors declare no competing interests.

Figures

Fig. 1
Fig. 1
Intracellular ROS production in sheep RBCs using H2DCF-DA and measuring RFU (RFU measurement RFU = Relative Fluorescent Units) production every 10 min for 4 h. RBCs were treated in vitro at 37 °C with PUFAs-ω3 and PUFAs-ω6 at different concentrations individually (25, 50, 100, 150, 200, 250, and 300 µg/mL), and using the ratio ω3/ω6 of 1:2 (100/200), 1:4 (25/100 µg/mL), 1:10 (25/250 µg/mL). Untreated RBCs at 37 °C for 4 h represent the control group (CTRL). Uppercase letters indicate significant statistical differences between groups of RBCs supplemented with different concentrations of PUFAs (red bars indicate groups with added ω3. Blue bars indicate groups with added ω6. Blue/red bars indicate groups with added ω3/ω6 ratio. Black bar indicated CTRL): p < 0.05 (one-way ANOVA)
Fig. 2
Fig. 2
Total thiols (A), TEAC (B), and MDA (C) assay in sheep RBCs treated for 4 h in vitro at 37 °C with PUFAs-ω3 and PUFAs-ω6 at different concentrations individually (25, 100, 200, 250 and 300 µg/mL), and using the ratio ω3/ω6 of 1:2 (100/200 µg/mL), 1:4 (25/100 µg/mL), 1:10 (25/250 µg/mL). Untreated RBCs after 4 h at 37 °C represent the control group (CTRL). Uppercase letters indicate significant statistical differences between groups of RBCs supplemented with different concentrations of PUFAs (red bars indicate groups with added ω3. Blue bars indicate groups with added ω6. Blue/red bars indicate groups with added ω3/ω6 ratio. Black bar indicated CTRL): p < 0.05 (one-way ANOVA)
Fig. 3
Fig. 3
Morphological evaluation of sheep RBCs treated for 4 h in vitro at 37 °C with different concentrations of PUFAs-ω3 and PUFAs-ω6. In Fig. 3A the % damaged RBCs are reported for the CTRL, and the highest concentrations of PUFAs-ω3 and PUFAs-ω6 (250 and 300 µg/mL), and the ratio ω3/ω6 of 1:2 (100/200 µg/mL) and 1:4 (25/100 µg/mL). Uppercase letters indicate significant differences, between groups: p < 0.001 (one-way ANOVA). Figure 3B and C show microscopic images of healthy and damaged RBCs, respectively. White arrows indicate examples of damaged erythrocytes (Fig. 3C)
Fig. 4
Fig. 4
Effect of the different treatments on haemolysis. Relative haemoglobin percentage of sheep RBCs treated for 4 h in vitro at 37 °C with different concentrations of PUFAs-ω3 and PUFAs-ω6 (25, 100, 200, and 250 µg/mL), and using the ratio ω3/ω6 of 1:2 (100/200 µg/mL), 1:4 (25/100 µg/mL), 1:10 (25/250 µg/mL). Untreated RBCs after 4 h at 37 °C represent the control group (CTRL). Uppercase letters indicate significant differences, between groups of RBCs supplemented with different concentrations of PUFAs Uppercase letters indicate significant statistical differences between groups of RBCs supplemented with different concentrations of PUFAs (red bars indicate groups with added ω3. Blue bars indicate groups with added ω6. Blue/red bars indicate groups with added ω3/ω6 ratio. Black bar indicated CTRL): p < 0.05 (one-way ANOVA)

Similar articles

References

    1. Wathes DC, Abayasekara DRE, Aitken RJ. Polyunsaturated fatty acids in male and female reproduction. Biol Reprod. 2007;77:190–201. - PubMed
    1. Kaur N, Chugh V, Gupta AK. Essential fatty acids as functional components of foods- a review. J Food Sci Technol. 2014;51:2289–303. - PMC - PubMed
    1. Moallem U. Invited review: roles of dietary n-3 fatty acids in performance, milk fat composition, and reproductive and immune systems in dairy cattle. J Dairy Sci. 2018;101:8641–61. - PubMed
    1. Román GC, Jackson RE, Gadhia R, Román AN, Reis J. Mediterranean diet: the role of long-chain ω-3 fatty acids in fish; polyphenols in fruits, vegetables, cereals, coffee, tea, Cacao and wine; probiotics and vitamins in prevention of stroke, age-related cognitive decline, and alzheimer disease. Rev Neurol (Paris). 2019;175:724–41. 10.1016/j.neurol.2019.08.005. - PubMed
    1. Mavangira V, Sordillo LM. Role of lipid mediators in the regulation of oxidative stress and inflammatory responses in dairy cattle. Res Vet Sci. 2018;116:4–14. - PubMed

MeSH terms

LinkOut - more resources