. 2025 May 9;26(1):125.
doi: 10.1186/s13059-025-03600-y.

Parent-of-origin regulation by maternal auts2 shapes neurodevelopment and behavior in fish

Affiliations

Parent-of-origin regulation by maternal auts2 shapes neurodevelopment and behavior in fish

Antoine Emile Clément et al. Genome Biol. .

Abstract

Background: Parental experience can influence progeny behavior through gamete-mediated non-genetic inheritance, that is, mechanisms that do not involve changes in inherited DNA sequence. However, underlying mechanisms remain poorly understood in vertebrates, especially for maternal effects. Here, we use the medaka, a model fish species, to investigate the role of auts2a, the ortholog of human AUTS2, a gene repressed in the fish oocyte following maternal stress and associated with neurodevelopmental disorders.

Results: We show that auts2a expression in the oocyte influences long-term progeny behavior, including anxiety-like behavior and environment recognition capabilities. Using single-nuclei RNA-sequencing, we reveal that maternal auts2a influences gene expression in neural cell populations during neurodevelopment. We also show that maternal auts2a knock-out triggers differences in maternally inherited factors, including early embryonic transcriptional and post-transcriptional regulators.

Conclusions: Together, our results reveal the unsuspected role of an autism-related gene expressed in the mother's oocyte in shaping progeny neurodevelopment and behavior. Finally, we report that auts2a/AUTS2 is part of a group of evolutionarily conserved genes associated with human neurodevelopmental disorders and expressed in oocytes across species, from fish to mammals. These findings raise important questions about their potential role in the non-genetic regulation of progeny neurodevelopment and behavior in vertebrates.

Keywords: ASD; Intergenerational effect; Medaka; Neurodevelopmental disorder; Non-genetic inheritance.


Conflict of interest statement

Declarations. Competing interests: The authors declare no competing interests.

Figures

Fig. 1
Fig. 1
auts2a mutant line description and macroscopic phenotyping. a Scale-free diagram of genomic DNA of WT and mutant auts2a alleles in medaka. Shaded exons represent the translated parts of the gene. b Scaled diagram of the full-length WT and mutant predicted transcripts and proteins. Auts2a protein domains are represented by different colors. Nuclear Localization Signal (NLS, green), Serine Rich Repeat (SRR, red), Proline Rich region 1 and 2 (PR1 & PR2, orange), PY protein binding motif (PY, blue), Histidine repeats (HX, yellow), Auts2 family domain (auts2, pink). c Crossing scheme to generate individuals of various phenotypes with or without maternal auts2a expression. Deep red (wild-type, WT) and deep blue (mutants) individuals are homozygous. Light red (HME +) and blue (HME −) individuals are heterozygous. d Embryo survival throughout development. Stages of development according to Iwamatsu developmental table [31] are displayed on the X axis. Chi-square statistical test was performed between WT (n = 965), HME + (n = 681), HME − (n = 578), and mutant (n = 937) groups. e Head size and body length of 14-week-old fish. ANOVA and post hoc Tuckey’s tests were performed on WT (n = 49), HME + (n = 22), HME − (n = 36) and homozygous mutant (n = 29) groups. * P < 0.05, ** P < 0.01, *** P < 0.001.
Fig. 2
Fig. 2
Long term behavioral phenotypes. a Schematic representation of behavioral tests. b Crossing of individuals used for behavioral test to assess the impact of maternal auts2a expression. Orange individuals are heterozygous and originate from heterozygous auts2a parents. c Percent of time spent in lower zone in the novel tank test and d mean velocity on day 1 and day 2, 10 or 60 min after the beginning of the experiment. ANOVA and post hoc Tukey’s statistical test were performed on WT (n = 23), HME + (n = 10), HME − (n = 16), and mutant (n = 13) groups. *P < 0.05, **P < 0.01, ***P < 0.001
Fig. 3
Fig. 3
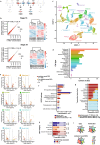
Transcriptomic analysis. a Crossing scheme to generate heterozygous individuals with (HME +) or lacking (HME −) maternal auts2a expression. b Bulk RNA-seq analysis of HME + and HME − progeny at early (stage 18, late neurula) and late (stage 29, late embryonic brain formation) stages of neurodevelopment. Mean normalized counts and Spearman correlation are displayed. Heatmaps display DEGs rlog scaled expression in HME − and HME + samples. c Single-nuclei RNA-seq clustering at late neurula stage (st 18). UMAP constructed in dimensionality-reduced PCA defined by highly variable genes from integrated HME + and HME − datasets. Cells sharing the same color have the same cellular identity determined from expressed marker genes (Additional file 1: Fig. S1a). d Single-nuclei DEGs between HME + and HME − embryos distribution. Bar plot displays number of single-nuclei DEGs for each cluster. Bar colors match with the colors of the UMAP clusters. Cell types are ordered from top to bottom by decreasing abundance. e Single-nuclei DEGs between HME + and HME − embryos at stage 18 in neural populations. Volcano plots display single-nuclei DEGs for neural clusters. HME + was used as the control condition. The colors of the cell type name in each sub-panel matches the colors of the UMAP clusters in panels c and d. f Dysregulated KEGG molecular signaling pathways. Bar plots display the enrichment of single-nuclei DEGs with identified human orthologs belonging to the KEGG signaling pathways database. The number of DEGs for each pathway is indicated. The dashed vertical line shows significance threshold. g Bar plots display the proportion of single-nuclei DEGs with identified human orthologs for each transcription factor family. The number of DEGs for each transcription factor family is indicated. Unknown transcription factors lack a canonical DNA binding domain. h Bar plots display the number of DEGs with identified human orthologs associated with NDDs for all single-nuclei DEGs (dark blue), neural DEGs (orange) and exclusive neural DEGs (red) group. NDDs include ASD, aura, behavior alterations, cognition disorders, delirium, developmental disorders, epilepsy, Huntington, hyperactivity, hyperopia, hypotonia, intellectual disability, language disabilities, mental retardation, microcephaly, nervous system disorders, neurodevelopment disorders, sleep apnea, and schizophrenia. Chi square analysis was performed against a random selection of genes in the genome (see Methods). *P < 0.05, **P < 0.01, *** P < 0.001. i Neuropathology associated with DEGs distribution. Pie charts display the distribution of neuropathology associated DEGs for all single-nuclei DEGs, neural DEGs and exclusive neural DEG group. Numbers correspond to the number of DEGs associated with the seven main neuropathologies for each DEG group. ASD: Autism Spectrum Disorders, BH: behavior, ID: intellectual disability, SCZ: schizophrenia, µC: microcephaly, HP: hypotonia, EP: epilepsy
Fig. 4
Fig. 4
Neural DEGs. A Venn diagram displays the number of single-nuclei neural DEGs (i.e., with an adjusted P-value < 0.05 in at least one neural population) whose human orthologs have been identified as transcription factors (C2H2 ZF: C2H2 zinc finger, FO: forkhead, HD: homeodomain, HMG: High-Mobility Group, unk: unknown DNA binding domain), KEGG pathways (Ax: Axon guidance, Wnt: Wnt signaling pathway, SCP: signaling pathways regulating pluripotency of stem cells) and neuropathologies (ASD: autism spectrum disorders, BH: behavior, ID: intellectual delay, SCZ: schizophrenia, µC: microcephaly, HP: hypotonia, EP: epilepsy)
Fig. 5
Fig. 5
Gene expression in oocytes and one-cell stage RNA-seq analysis. a RNAscope (auts2a probe and negative control probe) on ovarian sections. RNAscope probe staining is displayed in red (auts2a) and green (hdac1 and msi2a) and DAPI staining in blue. Oo: ooplasm, Nu: nucleus. b Immunostaining (AUTS2 primary antibody and negative control without primary antibody) on ovarian section. Oo: ooplasm, Nu: nucleus. Antibody staining is displayed in red and DAPI staining in blue. c Volcano plot of dysregulated genes in 1-cell stage embryos following maternal auts2a loss-of-function. Wild-type was used as the control condition. Red dots correspond to msia2, hdac1, and rb1. ns: genes that are not significantly differentially expressed between WT and mutant
Fig. 6
Fig. 6
Evolutionarilyconserved oocyte genes linked to behavior and nervous system development. a Venn diagram displaying zebrafish and mouse oocyte genes associated with either behavior or nervous system development (NSD). The green area corresponds to genes expressed in oocytes of both species that are associated with both GO terms. b Boxplots (left panel) show the distribution of the disease pleiotropy index (DPI) of human gene orthologs to all common zebrafish and mice oocyte genes (grey), genes associated with behavior GO term (blue), NSD GO term (yellow), or both GO terms (green). The number of genes is indicated for each category. For each group of genes, bar plots (right panel) show the proportion of genes in each DPI class. Within each group of genes, differences between DPI classes were assessed using chi square tests. Groups sharing the same letter are not significantly different (P < 0.05). c DPI of human orthologs of evolutionarily conserved oocyte genes associated with behavior and neurodevelopment (N = 92). Symbols of genes with DPI above 0.75 are displayed

Similar articles

References

    1. Chan JC, Nugent BM, Bale TL. Parental Advisory: Maternal and Paternal Stress Can Impact Offspring Neurodevelopment. Biol Psychiat. 2018;83:886–94. - PMC - PubMed
    1. Mitchell E, Klein SL, Argyropoulos KV, Sharma A, Chan RB, Toth JG, et al. Behavioural traits propagate across generations via segregated iterative-somatic and gametic epigenetic mechanisms. Nat Commun. 2016;7:11492. - PMC - PubMed
    1. Wehmer F, Porter RH, Scales B. Pre-mating and pregnancy stress in rats affects behaviour of grandpups. Nature. 1970;227:622. - PubMed
    1. Duffy KA, Bale TL, Epperson CN. Germ Cell Drivers: Transmission of Preconception Stress Across Generations. Front Hum Neurosci. 2021;15: 642762. - PMC - PubMed
    1. Adrian-Kalchhauser I, Sultan SE, Shama LNS, Spence-Jones H, Tiso S, Keller Valsecchi CI, et al. Understanding “Non-genetic” Inheritance: Insights from Molecular-Evolutionary Crosstalk. Trends Ecol Evol. 2020;35:1078–89. - PubMed

LinkOut - more resources