. 2025 May 9;13(1):72.
doi: 10.1186/s40364-025-00763-5.

S100A9 as a potential novel target for experimental autoimmune cystitis and interstitial cystitis/bladder pain syndrome

Affiliations

S100A9 as a potential novel target for experimental autoimmune cystitis and interstitial cystitis/bladder pain syndrome

Jiang Zhao et al. Biomark Res. .

Abstract

Background: Interstitial cystitis/bladder pain syndrome (IC/BPS) is a chronic inflammatory disease of the bladder for which no effective therapy is currently available. Understanding the pathogenesis of IC/BPS and identifying effective intervention targets are of great clinical importance for its effective treatment. Our work focuses on elucidating the key targets and underlying mechanisms of IC/BPS.

Methods: We established an experimental autoimmune cystitis (EAC) mouse model and generated gene knockout mice to elucidate key mediators triggering chronic inflammatory damage in IC/BPS through using single-cell RNA sequencing, proteomic sequencing, and molecular biology experiments.

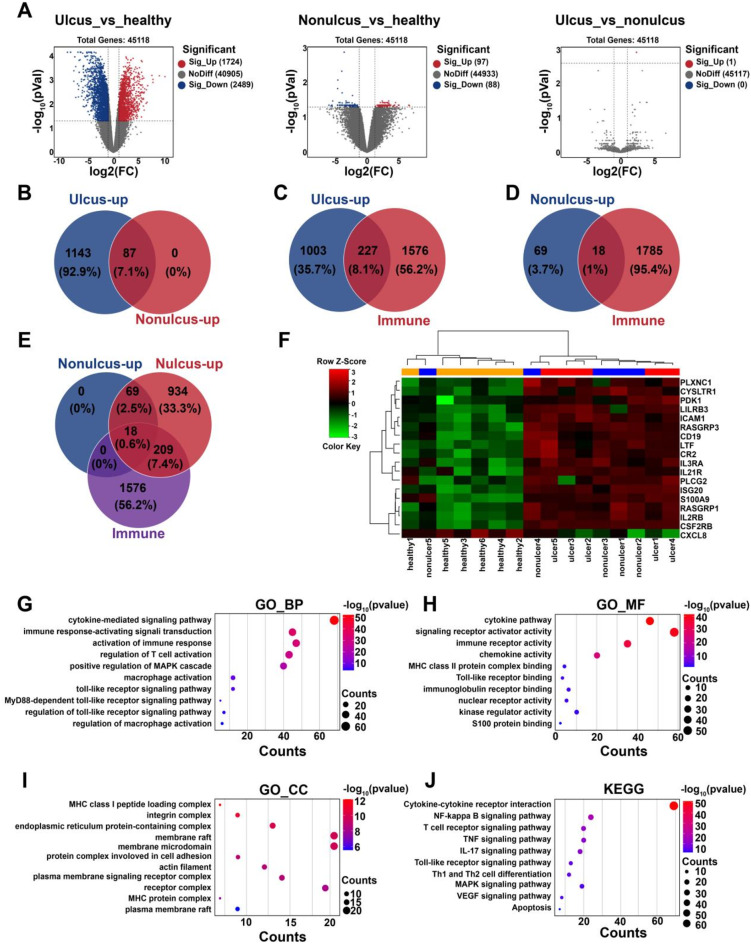
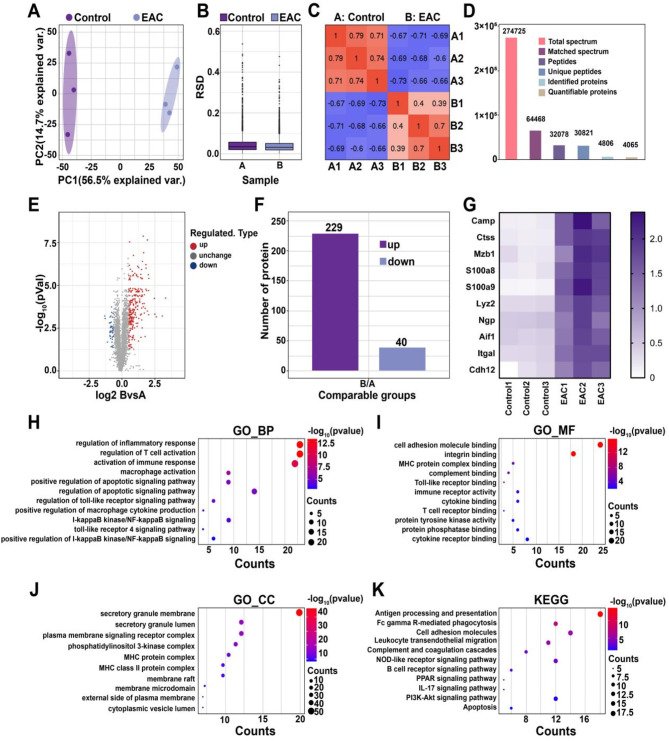
Results: Our study revealed that the infiltration and activation of macrophages, T cells, and mast cells exacerbated inflammatory bladder damage in both IC/BPS and EAC mice. Notably, cell-cell communication among bladder immune cells was significantly enhanced in EAC mice. Macrophages, as the main cell types altered in EAC mice, received and transmitted the most intensity signalling. Mechanistically, macrophages synthesized and secreted S100A9, which in turn facilitated macrophage polarization and promoted the production of pro-inflammatory cytokines. S100A9 emerged as an important pro-inflammatory and pathogenic molecule in IC/BPS and EAC. Further analysis demonstrated that S100A9 activation enhanced the inflammatory response and exacerbated bladder tissue damage in IC/BPS patients and EAC mice via TLR4/NF-κB and TLR4/p38 signalling pathways. Importantly, inhibition of S100A9 with paquinimod, as well as genetic knockout of S100A9, significantly attenuated the pathological process.

Conclusions: S100A9 is an important pro-inflammatory and pathogenic molecule in IC/BPS and EAC. Targeting S100A9-initiated signalling pathways may offer a novel therapeutic strategy for IC/BPS.

Keywords: Autoimmune disease; Experimental autoimmune cystitis; Inflammation; Interstitial cystitis/bladder pain syndrome; S100A9.


Conflict of interest statement

Declarations. Ethics approval and consent to participate: This study was approved by the Research Council and Animal Care and Use Committee of the Army Military Medical University, China (Approval No.: AMUWEC2019414) and was conducted in accordance with animal welfare guidelines and the Declaration of Helsinki. Consent for publication: All authors agree to the publication of the article. Written informed consent for publication was obtained from all participants. Competing interests: The authors declare no competing interests.

Figures

Fig. 1
Fig. 1
Analysis of GSE11783 data for IC/BPS patients. (A)Volcano plot of DEGs in the ulcer, non-ulcer, and normal groups. (B) Venny plot of upregulated genes in the ulcer and non-ulcer groups. (C-D) Venny plots of upregulated genes and immune-related genes in the ulcer and non-ulcer groups. (E) Venny plots of upregulated genes and immune-related genes in the ulcer group and non-ulcernonulcer group. (F) Heatmap plot of the expression of 18 overlapped genes from. (G-J) GO and KEGG enrichment analysis of 227 overlapping genes
Fig. 2
Fig. 2
Comparison TMT analysis of proteomic sequencing between control and EAC mouse bladder tissues. (A) A two-dimensional scatter plot of the principal component analysis (PCA) distribution of all samples by using quantified proteins. (B) Box plot of the relative standard deviation (RSD) distribution of repeated samples. (C) Heatmap of Pearson correlation coefficients for all quantified proteins between each pair of samples (n = 3). (D) Basic statistical images of the mass spectrometry results. (E) Volcano plot of proteins differentially expressed between the EAC and the control group. (F) Column chart of the distribution of differentially expressed proteins between the EAC and control group. (G) Heatmap plot of the top 10 upregulated genes in the EAC group (n = 3). (H-K) GO and KEGG enrichment analyses of the DEGs in the EAC group
Fig. 3
Fig. 3
Screening and analysis of the core target molecule S100A9. (A) Venny plot of the top 10 genes upregulated in the EAC group and 18 candidate key genes for IC/BPS. (B-C) Analysis of S100A9 expression in the bladders from EAC mice and IC/BPS patients. (D) ROC curve analysis of S100A9 gene expression in the ulcer and non-ulcer groups of patients with IC/BPS. (E) Immunohistochemical analysis of S100A9 expression in EAC mice (×200, n = 6). (F) Western blot analysis of S100A9 expression in EAC mice. (G) Immunohistochemical analysis of S100A9 expression in IC/BPS patients (×200, n = 6). NS indicates no difference; *p < 0.05, **p < 0.01, ***p < 0.001
Fig. 4
Fig. 4
Analysis of single cell types in the control and EAC groups. (A) UMAP cluster of whole bladder cells in mice. (B) Dot plots showing the expression of three key markers in each cell types. (C) Distribution of the gene expression, mitochondrial ratio, ribosomal ratio, and total RNA count in different cell types. (D) Comparison of cell cycle phases between different cell types. (E) Analysis of cell number in different cell types between EAC and control group. (F) Circle plot showing the key signals received by macrophages in the EAC group. (G) Circle plot showing the key signals received by macrophages in the control group
Fig. 5
Fig. 5
Expression analysis of S100A9 in EAC group from data of single-cell sequencing. (A) Venny plot of overlapping genes related to S100A9 and S100A8 comparing within the EAC and control groups. (B) GO enrichment analysis of gene pathways associated with S100A9 and S100A8. (C) Distribution and expression analysis of S100A9 and S100A8 in different bladder cell types between control and EAC group. (D) Comparative analysis of S100A9 and S100A8 expression in macrophages between control and EAC groups. (E) Expression analysis of TLR4 receptor in bladder cells between control and EAC groups. (F) Comparative analysis of gene expression in macrophages between the EAC and control groups. (G) GSEA analysis of the activation pathway of MACROPHAGE ACTIVATION. (H) Analysis of cell-cell communication source of neutrophils between control and EAC group. (I) Analysis of cell-cell communication source of macrophages between control and EAC group. (J) Immunofluorescence confocal analysis of S100A9 and macrophage marker F4/80 in control and EAC groups (n = 6)
Fig. 6
Fig. 6
Analysis of S100A9 expression and immune cell infiltration in IC/BPS bladder specimens. Analysis of HE staining of bladder in patients with ulcer type of IC/BPS (×200, n = 6). (B) Analysis of bladder mast cell staining in patients with ulcer type of IC/BPS (×200, n = 6). (C) Analysis of CD68 staining of bladder macrophages from ulcer type IC/BPS patients (×200, n = 6). (D) CD4 staining analysis of bladder T cells from patients with ulcer type of IC/BPS (×200, n = 6). (E) Confocal immunofluorescence analysis of S100A9 and CD68 in normal and IC/BPS groups (n = 6). NS indicates no difference; *p < 0.05, **p < 0.01, ***p < 0.001
Fig. 7
Fig. 7
S100A9 promotes macrophage activation and secretion of inflammatory factors. (A) LPS promoted S100A9 secretion in mice primary macrophages (n = 6). (B-C) S100A9 promoted pro-inflammatory polarisation of primary mouse macrophages (n = 3). (D) S100A9 promoted IL-6, TNF-α, and IL-1β expression in mouse primary macrophages (n = 6). (E) Paquinimod inhibited the increased IL-6, TNF-α and IL-1β mRNA expression in S100A9-induced mouse macrophages (n = 9). (F) Paquinimod inhibited the increase of IL-6, TNF-α and IL-1β levels in S100A9-induced mouse macrophages (n = 9). (G) S100A9 activated TLR4/NF-κB and TLR4/p38 signalling pathways in primary mouse macrophages (n = 3). NS indicates no difference; *p < 0.05, **p < 0.01, ***p < 0.001
Fig. 8
Fig. 8
Analysis of the effects of S100A9 knockdown on bladder tissue and immune cells in EAC mice (n = 6). (A) HE staining analysis of bladder tissues in WT and S100A9 knockdout mice of control and EAC groups (×200). (B) Analysis of mast cell infiltration in WT and S100A9 knockout bladder tissues from control and EAC groups (×200). (C) TUNEL staining for apoptosis analysis in bladder tissues from WT and S100A9 knockout mice in the control and EAC groups (×200). (D) Immunohistochemical analysis of macrophage marker F4/80 in WT and S100A9 knockout mice of control and EAC groups (×200). (E) Immunohistochemical analysis of CD4 in WT and S100A9 knockout mice of control and EAC groups (×200). (F) Immunohistochemical analysis of S100A9 in WT and S100A9 knockdout mice of the control and EAC groups (×200). NS indicates no difference; *p < 0.05, **p < 0.01, ***p < 0.001
Fig. 9
Fig. 9
Knockdown of S100A9 significantly reduced TLR4/NF-κB and TLR4/p38 signalling pathway activating and decreasing inflammation and apoptosis-related protein expression in EAC mice (n = 6). GSEA analysis showing that TLR4/MyD88, NF-κB, and p38 signalling are activated in IC/BPS patients and EAC mice. (B-C) Knockdown of S100A9 significantly reduced TLR4/NF-κB and TLR4/p38 signalling pathway protein expression in EAC mice. (D-E) Knockdown of S100A9 significantly reduced the expression of bladder inflammation-related proteins (IL-6, IL-1β and TNF-α) in EAC mice. (F) GSEA analysis showing that apoptosis signalling is activated in IC/BPS patients and EAC mice. (G-H) Knockdown of S100A9 expression significantly reduced the expression of bladder apoptosis-related proteins (Bax, caspase-3, caspase-8, and caspase-1) and improved the expression of epithelial damage marker proteins (UPK3A and UPK2) in EAC mice. NS indicates no difference; *p < 0.05, **p < 0.01, ***p < 0.001
Fig. 10
Fig. 10
Paquinimod inhibition and S100A9 knockdown significantly improved bladder function in EAC mice (n = 6). (A) Analysis of cystometry data from control, EAC and paquinimod treatment groups. (B) Comparative analysis of micturition frequency (MF), maximum bladder pressure (MBP) and inter-contraction interval (ICI) in the control, EAC and paquinimod treatment groups. (C) Analysis of cystometry data of WT, S100A9−/−, EAC and S100A9−/− +EAC groups. (D) Comparative analysis of MF, MP and ICI in the WT, S100A9−/−, EAC and paquinimod treatment groups. NS indicates no difference; *p < 0.05, **p < 0.01, ***p < 0.001

Similar articles

Cited by

References

    1. Hanno PM, Burks DA, Clemens JQ, Dmochowski RR, Erickson D, Fitzgerald MP, et al. AUA guideline for the diagnosis and treatment of interstitial cystitis/bladder pain syndrome. J Urol. 2011;185(6):2162–70. - PMC - PubMed
    1. Clemens JQ, Erickson DR, Varela NP, Lai HH. Diagnosis and treatment of interstitial cystitis/bladder pain syndrome. J Urol. 2022;208(1):34–42. - PubMed
    1. Berry SH, Elliott MN, Suttorp M, Bogart LM, Stoto MA, Eggers P, et al. Prevalence of symptoms of bladder pain syndrome/interstitial cystitis among adult females in the united States. J Urol. 2011;186(2):540–4. - PMC - PubMed
    1. Suskind AM, Berry SH, Ewing BA, Elliott MN, Suttorp MJ, Clemens JQ. The prevalence and overlap of interstitial cystitis/bladder pain syndrome and chronic prostatitis/chronic pelvic pain syndrome in men: results of the RAND interstitial cystitis epidemiology male study. J Urol. 2013;189(1):141–5. - PMC - PubMed
    1. Tripp DA, Nickel JC, Krsmanovic A. Depression and catastrophizing predict suicidal ideation in tertiary care patients with interstitial cystitis/bladder pain syndrome. Can Urol Assoc J. 2016;10(11/12):383–8. - PMC - PubMed

LinkOut - more resources