

Triglyceride to high-density lipoprotein ratio as a predictor for 10-year cardiovascular disease in individuals with diabetes in Thailand
- PMID: 40346713
- PMCID: PMC12065159
- DOI: 10.1186/s41043-025-00835-0
Triglyceride to high-density lipoprotein ratio as a predictor for 10-year cardiovascular disease in individuals with diabetes in Thailand
Abstract
Background: Cardiovascular disease (CVD) remains the leading cause of morbidity and mortality worldwide. The triglyceride to high-density lipoprotein cholesterol (TG/HDL) ratio has emerged as a potential marker for CVD risk. However, its predictive value for high 10-year predicted Cardiovascular (CV) risk remains unclear; This study evaluates the predictive value of the TG/HDL-C ratio for 10-year cardiovascular risk using the Framingham Heart Study (FHS) risk prediction model in individuals with Type 2 Diabetes Mellitus (T2DM).
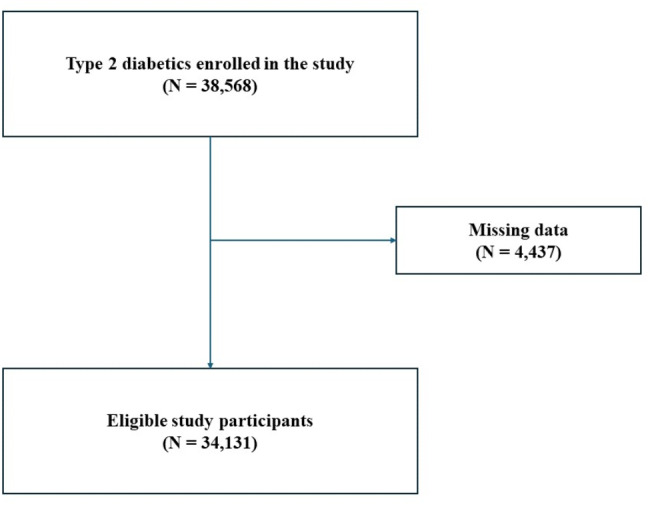
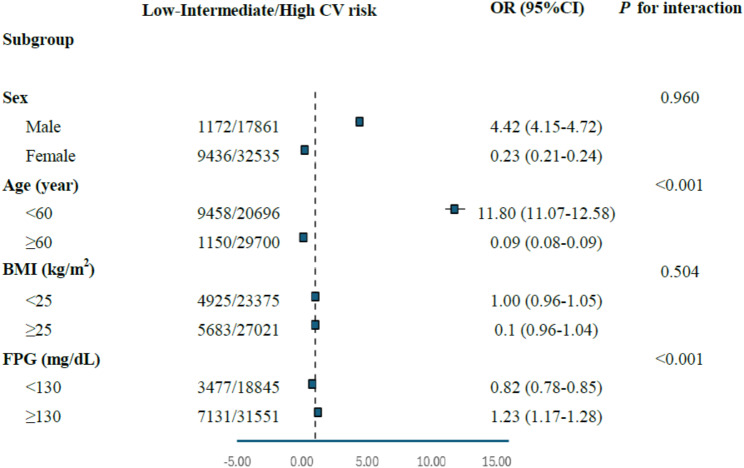
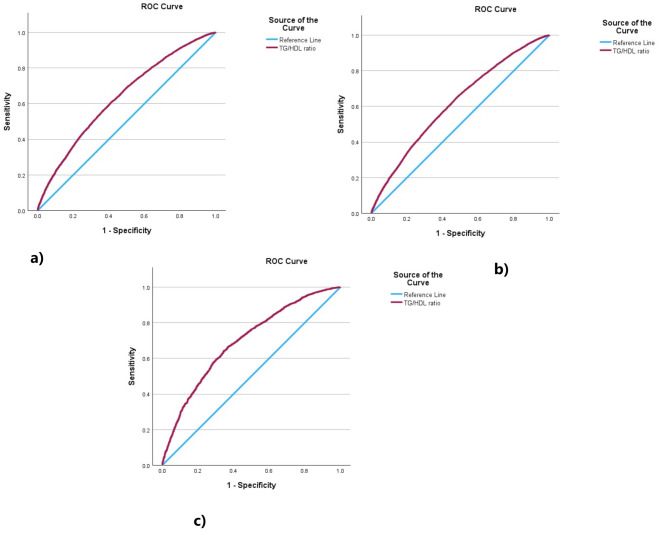
Methods: A cross-sectional study was conducted on 61,004 adults from 2014,2015, and 2018 aged 30-74 years with T2DM, without a history of CVD. The FHS model was used to estimate 10-year predicted CV risk, and high CVD risk was defined as ≥ 20%. ROC curve analysis was used to determine the optimal TG/HDL cutoff for high 10-year predicted CV risk in the overall population and age-specific subgroups. Logistic regression was performed to find the association between TG/HDL and high 10-year predicted CV risk, adjusting for potential confounders.
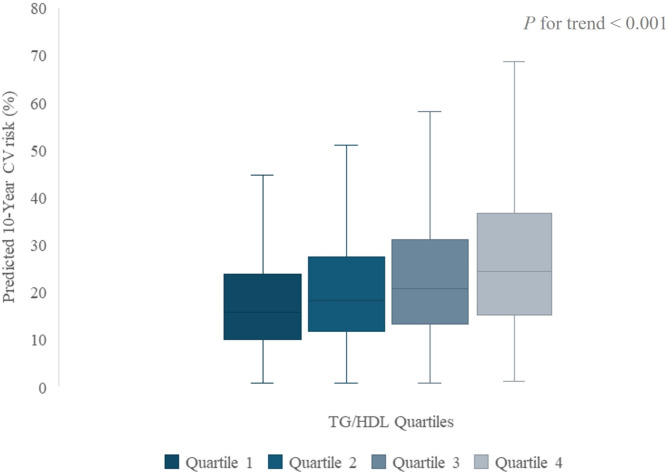
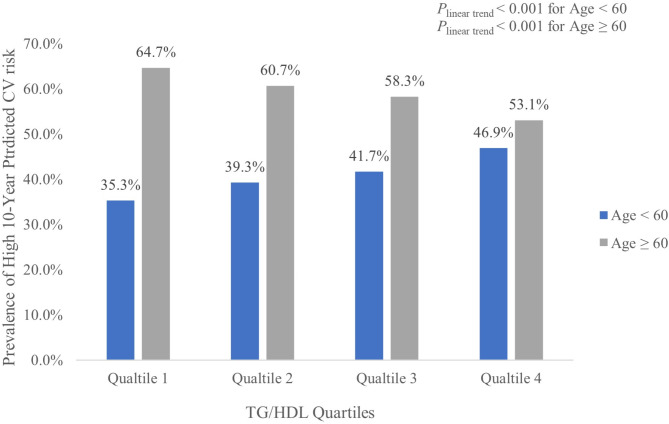
Results: The optimal TG/HDL-C cutoff was 2.52 (AUC = 0.618, 95% CI: 0.612-0.624), with 67% sensitivity and 50% specificity. Higher TG/HDL were associated with increased odds of high predicted CVD risk in a dose-dependent manner, with an adjusted odds ratio (AOR) of 5.16 (95% CI: 4.86-5.49) in the highest TG/HDL quartile (> 4.91). Age-stratified analysis identified lower cutoffs for older adults (≥ 60 years: 2.42, AUC = 0.694) than younger individuals (< 60 years: 2.98, AUC = 0.636), indicating stronger predictive performance in older adults.
Conclusions: The TG/HDL ratio is significantly associated with 10-year predicted CVD risk in T2DM with age-specific differences in predictive value. The lower cutoff for older adults (2.42) suggests even modest elevations indicate increased risk. These findings support TG/HDL integration into routine CVD risk assessments and highlight the importance of age-specific cutoffs for improved risk stratification.
Keywords: Association; Cardiovascular risk; Diabetes mellitus; TG/HDL; Thailand; Triglyceride to HDL ratio.
© 2025. The Author(s).
Conflict of interest statement
Declarations. Ethics approval and consent to participate: The study was approved by the Institutional Review Board, Royal Thai Army (Approved No. Q004h/67), in accordant with international guidelines including the Declaration of Helsinki, the Belmont Report, CIOMS Guidelines, and the International Conference on Harmonization of Technical Requirements for Registration of Pharmaceuticals for Human Use - Good Clinical Practice (ICH-GCP). Due to using secondary data, a waiver of documentation of informed consent was utilized, and the waiver for informed consent was granted by the Institutional Review Board, RTA Medical Department. Consent for publication: Not applicable. Competing interests: The authors declare no competing interests.
Figures
References
-
- Mensah GA, Roth GA, Fuster V. The Global Burden of Cardiovascular Diseases and Risk Factors 2020 and Beyond. [cited 2023 Nov 30]; Available from: 10.1016/j.jacc.2019.10.009 - PubMed
-
- Zhang D, Wang G, Fang J, Mercado C. Hyperlipidemia and medical expenditures by cardiovascular disease status in US adults. Med Care. 2017;55:4–11. - PubMed
MeSH terms
Substances
LinkOut - more resources
Full Text Sources
Medical
Miscellaneous
