. 2025 Jul 14;6(7):101354.
doi: 10.1016/j.xplc.2025.101354. Epub 2025 May 8.

The F-box protein CHALK10 mediates SEMIDWARF-1 ubiquitination and degradation to negatively regulate grain chalkiness in rice

Affiliations

The F-box protein CHALK10 mediates SEMIDWARF-1 ubiquitination and degradation to negatively regulate grain chalkiness in rice

Wei Zhou et al. Plant Commun. .

Abstract

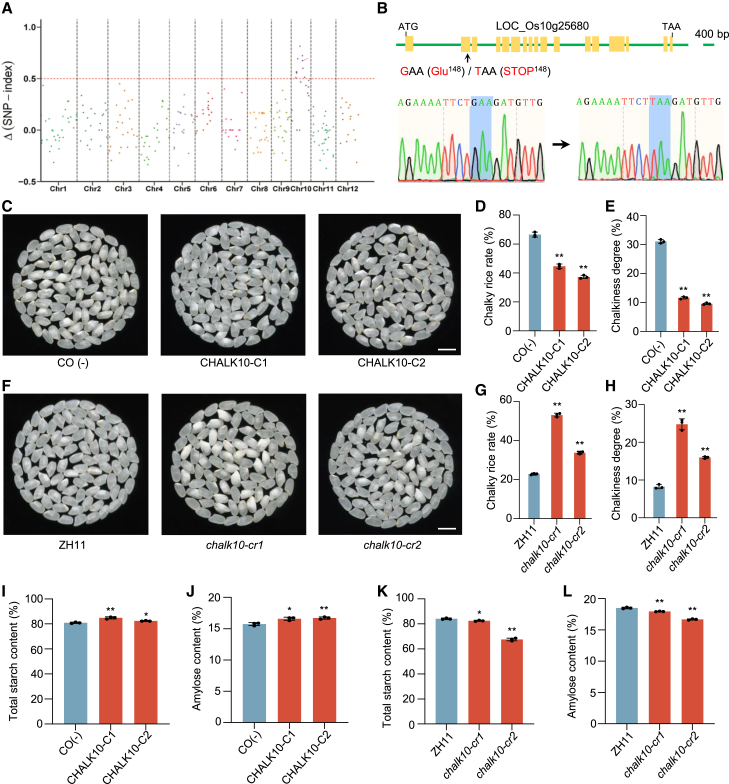
In rice (Oryza sativa), defects in endosperm development can give grains a chalky texture, which decreases grain quality and is thus undesirable for breeding and marketing. However, the molecular basis of chalkiness remains largely unknown. Here, we identified CHALK10, which encodes an F-box protein that negatively regulates rice chalkiness. The chalk10 mutant exhibited abnormal starch granule development, decreased starch content, and altered starch physicochemical properties compared with the wild type. CHALK10 interacts with the gibberellin (GA) oxidase SEMIDWARF-1 (SD1) and promotes the ubiquitination and degradation of SD1 through the 26S proteasome pathway. The grains of SD1-overexpressing plants exhibited increased chalkiness; introduction of the sd1 mutant allele into the chalk10 background largely suppressed the enhanced chalkiness observed in the chalk10 mutant. GA levels were higher in the chalk10 mutant than in the wild type, and application of the bioactive GA form GA3 increased grain chalkiness. The expression of genes related to starch degradation or biosynthesis was altered in the chalk10 mutant, resulting in reduced starch production and increased metabolizable sugar content in the endosperm. In summary, our findings reveal a novel regulatory mechanism of chalkiness and provide potential targets for improving rice quality.

Keywords: CHALK10; Oryza sativa; SD1; chalkiness; gibberellin; rice; starch metabolism.


Figures

Figure 1
Figure 1
Characterization of the chalk10 mutant. (A) Appearance of milled rice from the wild-type Zhonghua 11 (ZH11) and the chalk10 mutant. Scale bars, 1 cm. (B) Transverse sections of endosperm from ZH11 and chalk10 grains. Scale bars, 1 mm. (C) Scanning electron micrographs of ZH11 and the chalky regions of mature chalk10 endosperm. The red box in (B) indicates the target region for microscopy. Scale bars, 100 μm. (D) Transmission electron micrographs of transverse sections from ZH11 and chalk10 endosperm at 9 days after fertilization (DAF). Red dashed circles indicate compound starch granules. Scale bars, 5 μm. (E and F) Chalky rice rate (E) and chalkiness degree (F) of ZH11 and chalk10 grains. (G–K) Starch physicochemical characteristics of ZH11 and chalk10 grains: total starch content (G), amylose content (H), gel consistency (I), gelatinization temperature (J), and viscosity profile (K) of milled flour. To, Tp, and Tc in (J) represent onset, peak, and conclusion gelatinization temperatures, respectively. The gray dashed line in (K) shows the temperature profile during measurement. Data in (E–K) represent means ± standard deviation (SD) from at least three biological replicates. p values were determined by Student’s t-test (∗p < 0.05, ∗∗p < 0.01).
Figure 2
Figure 2
CHALK10 regulates rice chalkiness formation. (A) Identification of genomic regions potentially harboring the causal mutation(s) for chalk10 using MutMap analysis. The red arrow indicates the candidate mutation site within the target region. (B) Gene structure of CHALK10 and the mutation site in the chalk10 mutant. LOC_Os10g25680 was identified as the candidate gene for CHALK10 based on a G-to-T mutation in the chalk10 mutant that results in a premature stop codon at Glu-148 in the second exon. (C–H) Appearance of milled rice (C and F), chalky rice rate (D and G), and chalkiness degree (E and H) in CHALK10 complementation (CO) lines (C–E) and knockout (KO) lines (F–H). CO (−) represents transgene-negative lines. chalk10-cr1 and chalk10-cr2 were generated by CRISPR-Cas9-mediated gene editing and carry a 1-bp insertion in the second exon and a 2-bp deletion in the first exon of CHALK10, respectively. (I–L) Total starch content (I and K) and amylose content (J and L) in the CO (I and J) and KO (K and L) lines. Data in (D), (E), and (G–L) represent means ± SD from at least three biological replicates. p values were determined by Student’s t-test (∗p < 0.05, ∗∗p < 0.01).
Figure 3
Figure 3
CHALK10 interacts with SD1 and SCF components. (A) Y2H assay testing the interaction of SD1 with full-length or truncated CHALK10. CHALK10 was divided into its N terminus, F-box domain, and C terminus, the latter containing 11 leucine-rich repeat (LRR) motifs and one LRR cysteine-containing (LRR-CC) motif. SD, synthetic defined medium; BD, GAL4 DNA-binding domain; AD, GAL4 activation domain. (B) Glutathione S-transferase (GST) pull-down assay of recombinant purified MBP-CHALK10 and GST-SD1. The indicated proteins were mixed, pulled down using GST agarose beads, and analyzed by immunoblotting with anti-MBP and anti-GST antibodies. (C) Luciferase complementation imaging assay testing the interaction between CHALK10 and SD1. Constructs encoding nLuc-tagged SD1 and cLuc-tagged CHALK10 were co-infiltrated into N. benthamiana leaves. Color bar at the right indicates intensity of the firefly luciferase (LUC) signal. (D) Co-immunoprecipitation (coIP) assay testing the interaction between SD1-GFP and CHALK10-FLAG. The plasmids 35S:CHALK10-FLAG and 35S:SD1-GFP were co-transfected into rice protoplasts. Total protein extracts were subjected to immunoprecipitation (IP) with anti-GFP antibodies, followed by immunoblotting (IB). (E) Y2H assay testing the interaction between CHALK10 and OSK1, CUL1, or RBX1 in yeast cells. (F–H) GST pull-down assays testing the interaction between GST-CHALK10 and His-OSK1 (F), MBP-CUL1 (G), or MBP-RBX1 (H). The indicated proteins were mixed, pulled down using GST agarose beads, and analyzed by immunoblotting with anti-His, anti-GST, or anti-MBP antibodies.
Figure 4
Figure 4
SD1 is a substrate of CHALK10 for ubiquitination and degradation. (A) SD1-FLAG accumulates to higher levels in chalk10 than in wild-type ZH11. The 35S:SD1-FLAG plasmid was transfected into protoplasts prepared from ZH11 and chalk10 plants; total proteins were immunoblotted with anti-FLAG, anti-CHALK10, and anti-ubiquitin (anti-Ub) antibodies. β-Actin was used as a loading control. Relative band intensities are indicated above each lane. (B) CHALK10-FLAG promotes the ubiquitination of SD1-GFP in rice protoplasts. The 35S:CHALK10-FLAG plasmid was co-transfected with either 35S:SD1-GFP or 35S:GFP into rice protoplasts. Total protein extracts were immunoblotted with anti-GFP and anti-Ub antibodies. Signals were visualized under short (short exp.) and long (long exp.) exposure conditions. (C) Cell-free degradation assay of GST-SD1 in the presence or absence of the 26S proteasome inhibitor MG132. Total proteins were extracted from ZH11 seedlings and incubated with recombinant purified GST-SD1 or GST (control), with or without 100 μM MG132. (D) Cell-free degradation assay of GST-SD1 using extracts from ZH11 and chalk10. Total proteins were extracted from 10-day-old ZH11 and chalk10 seedlings, then incubated with recombinant purified GST-SD1 or GST as a control. In (C and D), samples were collected at 0, 10, 20, and 30 min. Proteins were analyzed by immunoblotting with anti-GST antibodies. β-Actin served as a loading control. Relative band intensities are indicated above each lane. (E)In vitro ubiquitination assay. Recombinant GST-SD1, MBP-CHALK10, MBP-OSK1, MBP-CUL1, and MBP-RBX1 were purified from E. coli Rosetta (DE3) cells. These proteins were incubated with HA-ubiquitin, E1, and E2 in ATP-containing reaction buffer. SD1 ubiquitination was detected by immunoblotting with anti-Ub and anti-GST antibodies.
Figure 5
Figure 5
SD1 is a positive regulator of rice chalkiness. (A) Appearance of milled rice grains from ZH11 and SD1 overexpression (SD1-OE) lines. Transverse sections of the endosperm from ZH11 and SD1-OE lines are shown in the bottom right corners. Scale bars, 1 cm. (B and C) Scanning electron micrographs of the chalky regions in mature grain endosperm from ZH11 and SD1-OE lines. The red box in (A) indicates the region targeted for microscopy. Scale bars: 200 μm in (B), 60 μm in (C). (D) Relative SD1 expression levels in the endosperm of ZH11 and SD1-OE lines. Samples were collected from different plants (n = 3). (E and F) Chalky rice rate (E) and chalkiness degree (F) of grains from ZH11 and SD1-OE lines. (G–J) Starch physicochemical properties of grains from ZH11 and SD1-OE lines: total starch content (G), amylose content (H), gel consistency (I), and gelatinization temperature (J). (K) Starch viscosity profiles of ZH11 and SD1-OE lines. (L) Appearance of milled rice grains from ZH11, chalk10, sd1, and chalk10 sd1. Scale bars, 1 cm. (M–P) Chalky rice rate (M), chalkiness degree (N), total starch content (O), and amylose content (P) of grains from ZH11, chalk10, sd1, and chalk10 sd1. Data in (D)(K) are presented as means ± SD from at least three biological replicates. p values were determined by Student’s t-test (∗p < 0.05, ∗∗p < 0.01). Data in (M)–(P) also represent means ± SD from at least three biological replicates. Different letters above bars indicate statistically significant differences, as determined by Duncan’s multiple range test (p < 0.05). ns, not significant (p > 0.05).
Figure 6
Figure 6
GA3 application promotes chalkiness. (A) Grain appearance from ZH11 plants treated with different concentrations of gibberellin (GA3). Panicles of ZH11 plants were treated once after fertilization with 0.1, 1, or 10 μM GA3. Water-only treatment (0 μM) served as the control. Scale bars, 1 cm. (B and C) Chalky rice rate (B) and chalkiness degree (C) of grains shown in (A) following the indicated GA3 treatments. (D and E) Total starch content (D) and amylose content (E) of the grains shown in (A) following the indicated GA3 treatments. (F) Contents of the active GAs (GA1, GA3, GA4, and GA7) in 20-DAF endosperm from ZH11 and chalk10 grains. Data in (B)(E) are presented as means ± SD from at least three biological replicates. Different letters above bars indicate statistically significant differences, as determined by Duncan’s multiple range test (p < 0.05). Data in (F) represent means ± SD from at least three biological replicates. p values were determined by Student’s t-test (∗p < 0.05, ∗∗p < 0.01).
Figure 7
Figure 7
Expression analysis of starch metabolic genes and determination of sugar content in the endosperm of ZH11, chalk10, sd1, chalk10 sd1, and SD1-OE lines. (A and B) Relative expression levels of starch degradation-related amylase genes (AMY1A, AMY1C, AMY2A, AMY3A, AMY3B, AMY3C, and AMY3E) in 20-DAF endosperm from ZH11, chalk10, sd1, and chalk10 sd1(A), and from ZH11 and SD1-OE lines (B). Samples were collected from different plants (n = 3). (C and D) Relative expression of starch biosynthesis-related genes (GBSSI, SSIIa, SSIIb, SSIIc, PUL, BEI, BEIIb, and AGPL3) in 20-DAF endosperm from ZH11, chalk10, sd1, and chalk10 sd1(C), and from ZH11 and SD1-OE lines (D). Samples were collected from different plants (n = 3). (E–J) Contents of sucrose (E and H), glucose (F and I), and fructose (G and J) in the grains of ZH11, chalk10, sd1, and chalk10 sd1(E–G), and of ZH11 and SD1-OE lines (H–J). Data in (A), (C), and (E–G) are presented as means ± SD from at least three biological replicates. Different letters above bars indicate statistically significant differences, as determined by Duncan’s multiple range test (p < 0.05). Data in (B), (D), and (H–J) are means ± SD from at least three biological replicates. p values were determined by Student’s t-test (∗p < 0.05, ∗∗p < 0.01). ns, not significant (p > 0.05). (K) Proposed model for the role of CHALK10 in regulating chalkiness formation. In wild-type ZH11 (left), CHALK10 forms an SCF complex with OSK1, CUL1, and RBX1 to degrade its substrate SD1 via the 26S proteasome pathway, maintaining balanced GA biosynthesis and normal starch metabolism. In plants lacking CHALK10 function (right), SD1 is no longer degraded, leading to elevated GA levels. GA3 application phenocopies the chalk10 mutant and SD1-OE lines, disrupting the expression of genes involved in starch biosynthesis and degradation. This process results in reduced starch levels, increased metabolizable sugars, and ultimately enhanced chalkiness.

Similar articles

References

    1. Abe A., Kosugi S., Yoshida K., Natsume S., Takagi H., Kanzaki H., Matsumura H., Yoshida K., Mitsuoka C., Tamiru M., et al. Genome sequencing reveals agronomically important loci in rice using MutMap. Nat. Biotechnol. 2012;30:174–178. doi: 10.1038/nbt.2095. - DOI - PubMed
    1. Abt M.R., Zeeman S.C. Evolutionary innovations in starch metabolism. Curr. Opin. Plant Biol. 2020;55:109–117. doi: 10.1016/j.pbi.2020.03.001. - DOI - PubMed
    1. Achard P., Genschik P. Releasing the brakes of plant growth: how GAs shutdown DELLA proteins. J. Exp. Bot. 2009;60:1085–1092. doi: 10.1093/jxb/ern301. - DOI - PubMed
    1. Alabadí D., Gallego-Bartolomé J., Orlando L., García-Cárcel L., Rubio V., Martínez C., Frigerio M., Iglesias-Pedraz J.M., Espinosa A., Deng X.W., Blázquez M.A. Gibberellins modulate light signaling pathways to prevent Arabidopsis seedling de-etiolation in darkness. Plant J. 2007;53:324–335. doi: 10.1111/j.1365-313X.2007.03346.x. - DOI - PubMed
    1. Asano K., Yamasaki M., Takuno S., Miura K., Katagiri S., Ito T., Doi K., Wu J., Ebana K., Matsumoto T., et al. Artificial selection for a green revolution gene during japonica rice domestication. Proc. Natl. Acad. Sci. USA. 2011;108:11034–11039. doi: 10.1073/pnas.1019490108. - DOI - PMC - PubMed

LinkOut - more resources