. 2025 Aug;24(8):e70101.
doi: 10.1111/acel.70101. Epub 2025 May 10.

SGLT2 Inhibition by Enavogliflozin Significantly Reduces Aβ Pathology and Restores Cognitive Function via Upregulation of Microglial AMPK Signaling in 5XFAD Mouse Model of Alzheimer's Disease

Affiliations

SGLT2 Inhibition by Enavogliflozin Significantly Reduces Aβ Pathology and Restores Cognitive Function via Upregulation of Microglial AMPK Signaling in 5XFAD Mouse Model of Alzheimer's Disease

Jihui Han et al. Aging Cell. 2025 Aug.

Abstract

Alzheimer's disease (AD) is a progressive neurodegenerative disorder characterized by cognitive decline. Metabolic dysfunctions, particularly type 2 diabetes mellitus (T2DM), have been implicated in AD pathogenesis, highlighting the potential for novel therapeutic approaches targeting shared underlying mechanisms. Here, we investigate sodium-glucose cotransporter 2 (SGLT2) inhibition as a therapeutic strategy for AD using Enavogliflozin, a potent SGLT2 inhibitor, in the 5XFAD mouse model. Five-month-old 5XFAD mice were treated with Enavogliflozin (0.1 or 1 mg/kg) or vehicle for 8 weeks. The higher dose significantly improved cognitive performance in Y-maze and Morris Water Maze tests, which correlated with enhanced synaptic plasticity and increased acetylcholine levels. Moreover, Enavogliflozin treatment reduced Aβ pathology and plaque burden, particularly affecting larger plaques. Mechanistically, SGLT2 inhibition attenuated neuroinflammation by suppressing NF-κB signaling and proinflammatory cytokine production while promoting microglial recruitment to plaques. In vitro and ex vivo analyses further revealed that Enavogliflozin enhances microglial phagocytic capacity via AMPK-mediated mitochondrial biogenesis and function. These findings highlight the multifaceted neuroprotective effects of SGLT2 inhibition in AD, demonstrating its potential to mitigate pathology and improve cognitive function. By uncovering its impact on neuroinflammation and microglial function, this study establishes SGLT2 inhibition as a promising therapeutic avenue for AD and other neurodegenerative disorders.

Keywords: Alzheimer's disease; SGLT2 inhibition; amyloid‐beta; anti‐diabetic drugs; cognitive function; neuroinflammation.


Conflict of interest statement

The authors declare no conflicts of interest.

Figures
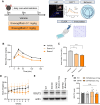
FIGURE 1
FIGURE 1
Enavogliflozin improves glucose tolerance in 5XFAD mice. (A) Schematic illustration of the experimental timeline. Starting at 5 months of age, 5XFAD mice were orally administered vehicle, 0.1 mg/kg, or 1 mg/kg Enavogliflozin daily for 2 months. (B) Oral glucose tolerance test (OGTT) performed after 16 h of fasting at the end of the 2‐month treatment period. Mice were administered a glucose solution (2 g/10 mL/kg) following Enavogliflozin treatment, and blood glucose levels were measured at indicated time points using a glucometer. (C) Area under the curve (AUC) calculated from the OGTT data in (B), n = 10–15 per group. **p < 0.01, ****p < 0.0001. (D) Body weights measured weekly throughout the 8‐week treatment period, n = 10 per group. (E) Representative Western blot images showing SGLT2 protein levels in wildtype (WT) and 5XFAD mice with or without Enavogliflozin treatment. (F) Densitometric analysis of SGLT2 protein levels normalized to β‐actin, n = 5 per group, n.s., not significant. Data are presented as mean ± SEM. Statistical analysis was performed using one‐way ANOVA followed by Tukey's post hoc test.
FIGURE 2
FIGURE 2
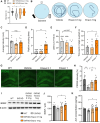
SGLT2 inhibition enhances cognitive function and synaptic plasticity. (A) Percentage of spontaneous alternation in the Y‐maze test, calculated as the number of alternations divided by the total arm entries. *p < 0.05. (B) Schematic representation of the Morris Water Maze apparatus with a platform positioned in one quadrant. Representative swim path traces from different treatment groups 24 h after the last training session. (C) Average swimming velocity during the probe test to assess motor function, n.s., not significant. (D) Number of platform crossings during the 60‐s probe test. **p < 0.01. (E) Latency to first platform crossing during the probe test. (F) Time spent in the target quadrant during the 60‐s probe test. *p < 0.05. (G) Representative confocal microscopy images of hippocampal sections immunostained for PSD95 (green) in 7‐month‐old 5XFAD mice following 2 months of treatment. Scale bar = 150 μm. (H) Quantification of PSD95 intensity *p < 0.05, **p < 0.01. (I) Representative Western blot images showing BDNF protein levels in 7‐month‐old 5XFAD mice after 2 months of treatment. (J) Densitometric analysis of BDNF protein levels normalized to β‐actin, *p < 0.05. (K) Acetylcholine (ACh) concentration in tissue homogenates measured by ELISA, *p < 0.05. All analysis was performed with 10–15 mice per group. Data are presented as mean ± SEM. Statistical analysis was performed using one‐way ANOVA followed by Tukey's post hoc test.
FIGURE 3
FIGURE 3
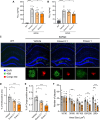
SGLT2 inhibition reduces Aβ pathology in 5XFAD mice. (A, B) Quantification of Aβ42 (A) and Aβ40 (B) concentrations in brain tissue homogenates measured by ELISA, n = 5–10 per group, *p < 0.05, ****p < 0.0001. (C) Representative confocal microscopy images of hippocampal sections immunostained with DAPI (blue) for nuclei, 4G8 (green) for total Aβ, and Congo red (red) for Aβ plaque cores. Upper panels show whole hippocampal images (scale bar = 150 μm), and lower panels show magnified images of the boxed areas (scale bar = 10 μm). (D) Quantification of 4G8‐positive area. *p < 0.05, ***p < 0.001. (E) Quantification of Congo red‐positive area. *p < 0.05, ***p < 0.001. (F) Number of plaques categorized by size ranges (10–30, 30–60, 60–100, 100–200, and > 200 μm2). *p < 0.05, **p < 0.01, ***p < 0.001. All analyses were performed with 9–10 mice per group. Data are presented as mean ± SEM. Statistical analysis was performed using one‐way ANOVA followed by Dunnett's post hoc test.
FIGURE 4
FIGURE 4
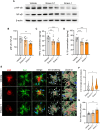
SGLT2 inhibition attenuates pro‐inflammatory phenotype and enhances microglial recruitment for Aβ phagocytosis. (A) Representative Western blot images showing phosphorylated NF‐κB (p‐NF‐κB) and total NF‐κB protein levels in brain tissue homogenates from 5XFAD mice after 2 months of treatment with vehicle or Enavogliflozin (0.1 or 1 mg/kg). (B) Densitometric analysis of p‐NF‐κB to total NF‐κB ratio, **p < 0.01. (C) TNFα concentration in brain tissue homogenates measured by ELISA, **p < 0.01, ***p < 0.001. (D) IL‐1β concentration in brain tissue homogenates measured by ELISA, ***p < 0.001. (E) Representative confocal microscopy images showing 4G8 (red), Iba1 (green), and DAPI (blue) staining. 3D rendering images demonstrate IMARIS rendering of Iba1‐positive microglia and 4G8‐positive Aβ deposits within the microglia. White arrows indicate Iba1‐positive microglia surrounding 4G8‐positive Aβ. Scale bar = 10 μm. (F) Quantification of the number of microglia around Aβ plaques. *p < 0.05. (G) Quantification of Iba1 intensity around Aβ deposits, **p < 0.01. All analyses were performed with 9–10 mice per group. Data are presented as mean ± SEM. Statistical analysis was performed using one‐way ANOVA followed by Tukey's post hoc test.
FIGURE 5
FIGURE 5
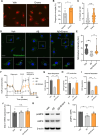
Enavogliflozin increases mitochondrial biogenesis and function through AMPK signaling. (A) Representative confocal microscopy images of primary microglia (Iba1, red) treated with vehicle or Enavogliflozin (0.1 μM) for 24 h, followed by bead (FITC) uptake for 1 h. Scale bar = 10 μm. (B) Quantification of phagocytic microglia, defined as Iba1‐positive cells containing more than four beads, expressed as percentage of total microglia, from 5 independent experiments. *p < 0.05. (C) Quantification of the number of phagocytosed beads per microglial cell, from 5 independent experiments. ****p < 0.0001. (D) Representative confocal microscopy images of primary microglia treated with vehicle, Aβ (4 μM), or Aβ with Enavogliflozin (0.1 μM) for 24 h and stained with Mitotracker (green). Scale bar = 10 μm. (E) Quantification of Mitotracker intensity, from 4 independent experiments. *p < 0.05, **p < 0.01. (F) Oxygen consumption rate (OCR) measured by Seahorse assay in primary microglia treated with vehicle, Aβ (4 μM), or Aβ with Enavogliflozin (0.1 μM) for 24 h. Oligomycin, an inhibitor of ATP synthase; carbonyl cyanide‐p‐trifluoromethoxyphenylhydrazone (FCCP), the reversible inhibitor of OXPHOS; rotenone/antimycin A (Rote/AA), the mitochondrial complex I and complex III inhibitor. Cells were treated sequentially with 2 μM oligomycin, 1 μM FCCP, and 0.5 μM Rote/AA, as indicated. (G–I) Quantification of basal respiration (G), ATP production (H), and maximal respiration (I) from the OCR measurements from 4 independent experiments. *p < 0.05, **p < 0.01, ***p < 0.001, ****p < 0.0001. (J) SGLT2 mRNA expression in primary microglia treated with vehicle, Aβ, or Aβ with Enavogliflozin measured by qRT‐PCR, from 4 independent experiments. n.s., not significant. (K) Representative Western blot images showing phosphorylated AMPK (pAMPK), total AMPK, and β‐actin. (L) Densitometric analysis of pAMPK to AMPK ratio from 4 independent experiments. *p < 0.05, **p < 0.01. Data are presented as mean ± SEM. Statistical analysis was performed using one‐way ANOVA followed by Tukey's post hoc test.

References

    1. Atri, A. , Feldman H. H., Hansen C. T., et al. 2022. “Evoke and Evoke+: Design of Two Large‐Scale, Double‐Blind, Placebo‐Controlled, Phase 3 Studies Evaluating the Neuroprotective Effects of Semaglutide in Early Alzheimer's Disease.” Alzheimer's & Dementia 18, no. S10: e062415. 10.1002/alz.062415. - DOI - PMC - PubMed
    1. Bekinschtein, P. , Cammarota M., Katche C., et al. 2008. “BDNF Is Essential to Promote Persistence of Long‐Term Memory Storage.” Proceedings of the National Academy of Sciences of the United States of America 105, no. 7: 2711–2716. 10.1073/pnas.0711863105. - DOI - PMC - PubMed
    1. Bellaver, B. , Povala G., Ferreira P. C. L., et al. 2023. “Astrocyte Reactivity Influences Amyloid‐β Effects on Tau Pathology in Preclinical Alzheimer's Disease.” Nature Medicine 29, no. 7: 1775–1781. 10.1038/s41591-023-02380-x. - DOI - PMC - PubMed
    1. Biessels, G. J. , and Despa F.. 2018. “Cognitive Decline and Dementia in Diabetes Mellitus: Mechanisms and Clinical Implications.” Nature Reviews. Endocrinology 14, no. 10: 591–604. 10.1038/s41574-018-0048-7. - DOI - PMC - PubMed
    1. Craft, S. 2009. “The Role of Metabolic Disorders in Alzheimer Disease and Vascular Dementia: Two Roads Converged.” Archives of Neurology 66, no. 3: 300–305. 10.1001/archneurol.2009.27. - DOI - PMC - PubMed

MeSH terms

LinkOut - more resources