. 2025 Sep;80(9):2519-2530.
doi: 10.1111/all.16580. Epub 2025 May 10.

Comprehensive αβ T-Cell Receptor Repertoire Analysis Reveals a Unique CD8+ TCR Landscape in DOCK8-Deficient Patients

Affiliations

Comprehensive αβ T-Cell Receptor Repertoire Analysis Reveals a Unique CD8+ TCR Landscape in DOCK8-Deficient Patients

Ceren Bozkurt et al. Allergy. 2025 Sep.

Abstract

Background: Dedicator of cytokinesis protein 8 (DOCK8) is a guanine nucleotide exchange factor highly expressed in, and critical for, the function of various innate and adaptive immune cells. DOCK8 deficiency leads to combined immunodeficiency characterized by susceptibility to infections, autoimmunity, and a severe Th2-type immune response. While dysfunction in various T cell subsets has been implicated in these phenotypes, a comprehensive analysis of the T-cell receptor (TCR) repertoire in these patients has not yet been documented. This study investigates the αβ TCR repertoire in DOCK8-deficient patients to identify features related to disease pathogenesis and explore the potential role of TCR repertoire alterations in disease development.

Methods: We compared immune repertoire profiles determined by high-throughput TCR sequencing of circulating CD4+ and CD8+ T cells from patients with DOCK8 deficiency (n = 10) to healthy controls (n = 7) and patients with ataxia-telangiectasia (AT) (n = 5).

Results: Different diversity analyses revealed a restricted TRA and TRB repertoire in both CD4+ and CD8+ T cells from DOCK8-deficient patients, with the restriction being more pronounced in CD8+ T cells. Skewed usage of individual variable (V) and joining (J) genes and potentially self-reactive CD8+ T cell clones, as determined by hydrophobicity and cysteine indices, were identified in DOCK8-deficient patients.

Conclusion: Our study represents the most comprehensive immune repertoire analysis in DOCK8 deficiency. The identification of a significantly restricted αβ TCR repertoire, along with the detection of potentially autoreactive clones, highlights the crucial role of immune repertoire profiling in elucidating the pathogenesis of DOCK8 deficiency.

Keywords: DOCK8 deficiency; T‐cell receptor repertoire; autoimmunity; immune repertoire sequencing.


Conflict of interest statement

The authors declare no conflicts of interest.

Figures

FIGURE 1
FIGURE 1
Diversity analyses of immune repertoire in CD4+ T cells of the samples. (A) Diversity of TRA and TRB immune repertoire (richness) calculated by Chao1 index. (B, C) TRA and TRB diversity analyses based on clonotype abundance. The results of Inverse Simpson and True diversity indices were given in B and C, respectively. (D) The inequality comparisons of TRA and TRB repertoires calculated by Gini coefficient index. (E) Comprehensive diversity comparisons (Hill numbers) of TRA and TRB repertoires. In TRA Gini coefficient graph bars show mean with ±standard error of mean (SEM) and statistical significance between HC‐DOCK8 and HC‐AT groups was determined by one‐way ANOVA. For the other graphs bars show median with confidence interval (CI). Statistical significance between HC‐DOCK8 and HC‐AT groups was determined by Mann–Whitney test. *p < 0.05, **p < 0.01. AT, ataxia‐telangiectasia; HC, healthy control; ns, not significant; TRA, T‐cell receptor alpha; TRB, T‐cell receptor beta. Q values represent different diversity calculations.
FIGURE 2
FIGURE 2
Diversity analyses of immune repertoire in CD8+ T cells of the samples. (A) Diversity of TRA and TRB immune repertoire (richness) calculated by Chao1 index. (B, C) TRA and TRB diversity analyses based on clonotype abundance. The results of Inverse simpson and True diversity indices were given in B and C, respectively. (D) The inequality comparisons of TRA and TRB repertoires calculated by Gini coefficient index. (E) Comprehensive diversity comparisons (Hill numbers) of TRA and TRB repertoires. Bars show median with CI. Statistical significance between HC‐DOCK8 and HC‐AT groups was determined by the Mann–Whitney test. *p < 0.05, **p < 0.01, ***p < 0.001. AT, ataxia‐telangiectasia; HC, healthy control; ns, not significant; TRA, T‐cell receptor alpha; TRB, T‐cell receptor beta. Q values represent different diversity calculations.
FIGURE 3
FIGURE 3
TRAV and TRAJ gene usage in DOCK8 patients and healthy controls. (A) The frequency of TRAV and TRAJ genes in CD4+ T cell repertoire sequences. (B) The frequency of TRBV and TRBJ genes in CD4+ T cell repertoire sequences. (C) The frequency of TRAV and TRAJ genes in CD8+ T cell repertoire sequences. (D) The frequency of TRBV and TRBJ genes in CD8+ T cell repertoire sequences. Bars show mean with ±SEM. Statistical significance was determined by unpaired t test. HC, healthy control; TRAJ, T‐cell receptor alpha joining; TRAV, T‐cell receptor alpha variable; TRBJ, T‐cell receptor beta joining; TRBV, T‐cell receptor beta variable.
FIGURE 4
FIGURE 4
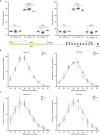
Analyses of TRAV–TRAJ clusters and CDR3 lengths. (A) Frequencies of proximally, middle, and distally located TRAV–TRAJ associations in the samples. The graph on the left represents CD4+ T cells, while the one on the right shows CD8+ T cells. Bars show mean with ±SEM. Statistical significance was determined by unpaired t test. The schematic illustration represents chromosomal locations of TRAV, TRAJ, and TRAC genes. (B) The frequency of TRA and TRB CDR3 sequences with different nucleotide lengths of CD4+ T cells in unique clonotypes. (C) The frequency of TRA and TRB CDR3 sequences with different nucleotide lengths of CD8+ T cells in unique clonotypes. AT, ataxia‐telangiectasia; HC, healthy control; TRA, T‐cell receptor alpha; TRAJ, T‐cell receptor alpha joining; TRAV, T‐cell receptor alpha variable; TRB, T‐cell receptor beta.
FIGURE 5
FIGURE 5
Self‐reactive T cell indices and pathology associated TRB clonotypes. (A) Cysteine index of TRA and TRB repertoire of CD4+ T cells. (B) Cysteine index of TRA and TRB repertoire of CD8+ T cells. (C) Hydrophobic index of TRB repertoire of CD4+ and CD8+ T cells. (D) Frequencies of pathology associated TRB clonotypes in CD4+ and CD8+ T cells. Bars in cysteine and hydrophobic index graphs represent median with CI. Statistical significance between HC‐DOCK8 and HC‐AT groups was determined by Mann–Whitney test. *p < 0.05. AT, ataxia‐telangiectasia; HC, healthy control; TRA, T‐cell receptor alpha; TRB, T‐cell receptor beta.

References

    1. Janssen E., Kumari S., Tohme M., et al., “DOCK8 Enforces Immunological Tolerance by Promoting IL‐2 Signaling and Immune Synapse Formation in Tregs,” JCI Insight 2, no. 19 (2017): e94298, 10.1172/jci.insight.94298. - DOI - PMC - PubMed
    1. Engelhardt K. R., McGhee S., Winkler S., et al., “Large Deletions and Point Mutations Involving the Dedicator of Cytokinesis 8 (DOCK8) in the Autosomal‐Recessive Form of Hyper‐IgE Syndrome,” Journal of Allergy and Clinical Immunology 124, no. 6 (2009): 1289–1302, 10.1016/j.jaci.2009.10.038. - DOI - PMC - PubMed
    1. Zhang Q., Davis J. C., Lamborn I. T., et al., “Combined Immunodeficiency Associated With DOCK8 Mutations,” New England Journal of Medicine 361, no. 21 (2009): 2046–2055, 10.1056/NEJMoa0905506. - DOI - PMC - PubMed
    1. Su H. C., Jing H., Angelus P., and Freeman A. F., “Insights Into Immunity From Clinical and Basic Science Studies of DOCK8 Immunodeficiency Syndrome,” Immunological Reviews 287, no. 1 (2019): 9–19, 10.1111/imr.12723. - DOI - PMC - PubMed
    1. Biggs C. M., Keles S., and Chatila T. A., “DOCK8 Deficiency: Insights Into Pathophysiology, Clinical Features and Management,” Clinical Immunology 181 (2017): 75–82, 10.1016/j.clim.2017.06.003. - DOI - PMC - PubMed

MeSH terms

Substances