

Phylogeographic and genetic network assessment of COVID-19 mitigation protocols on SARS-CoV-2 transmission in university campus residences
- PMID: 40347833
- PMCID: PMC12139431
- DOI: 10.1016/j.ebiom.2025.105729
Phylogeographic and genetic network assessment of COVID-19 mitigation protocols on SARS-CoV-2 transmission in university campus residences
Abstract
Background: Congregate living provides an ideal setting for SARS-CoV-2 transmission in which many outbreaks and superspreading events occurred. To avoid large outbreaks, universities turned to remote operations during the initial COVID-19 pandemic waves in 2020 and 2021. In late-2021, the University of California San Diego (UC San Diego) facilitated the return of students to campus with comprehensive testing, vaccination, masking, wastewater surveillance, and isolation policies.
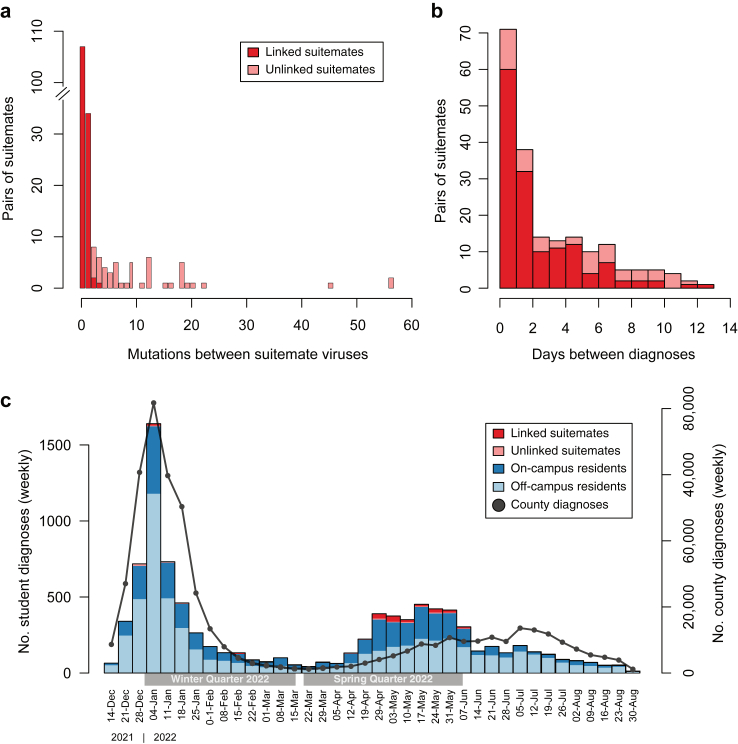
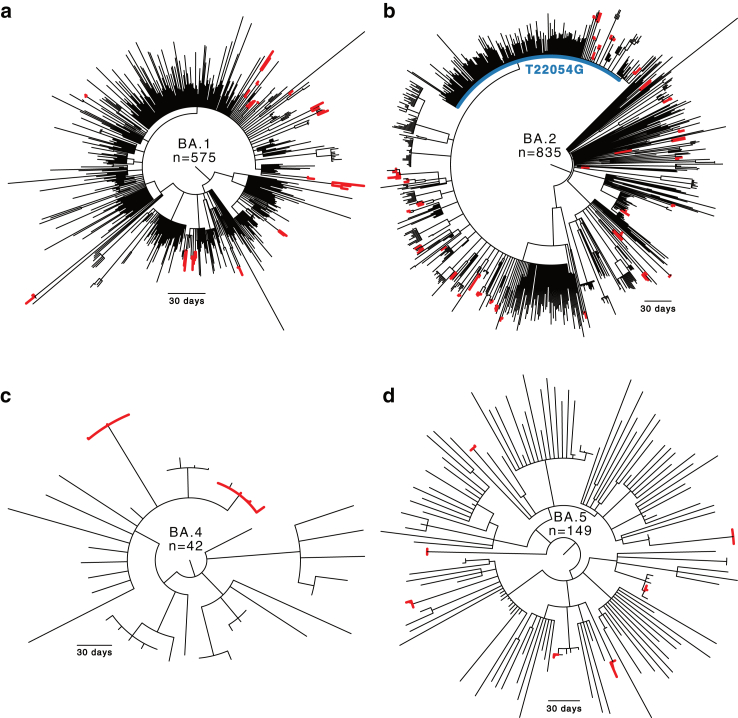
Methods: We performed molecular epidemiological and phylogeographic analysis of 4418 SARS-CoV-2 genomes sampled from UC San Diego students during the Omicron waves between December 2021 and September 2022, representing 58% of students with confirmed SARS-CoV-2 infection. We overlaid these analyses across on-campus residential information to assess the spread and persistence of SARS-CoV-2 within university residences.
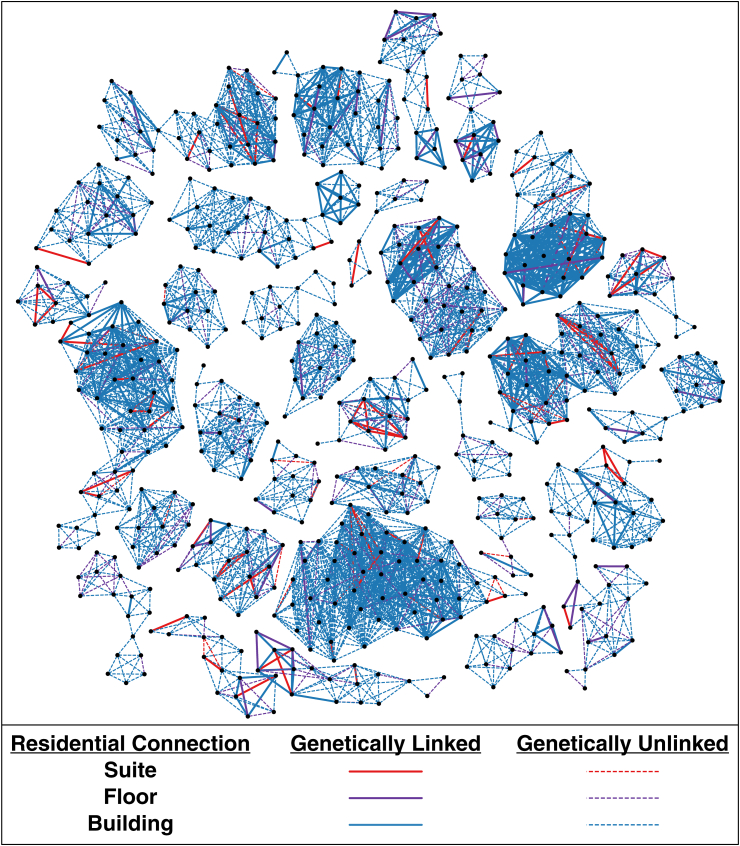
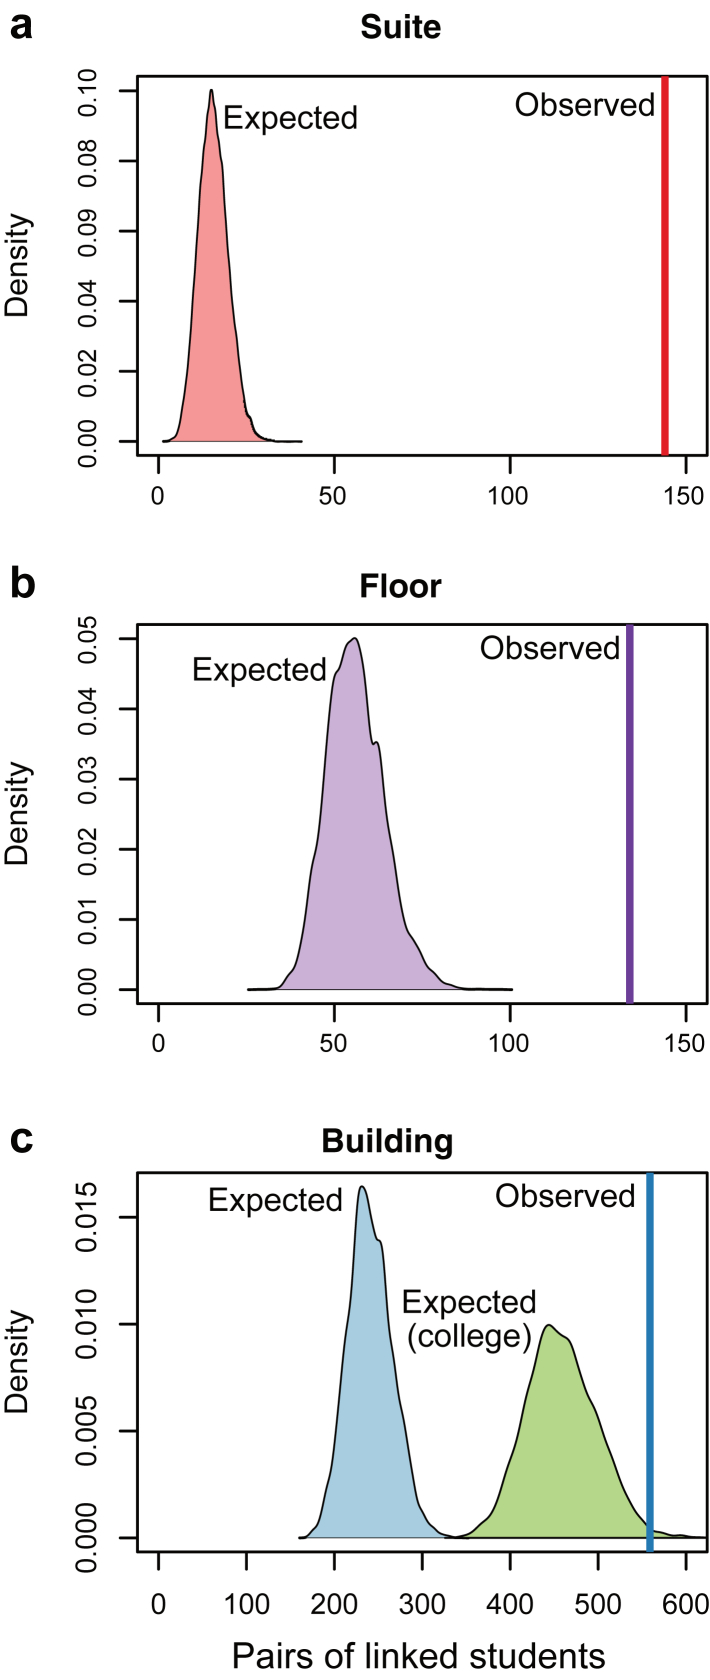
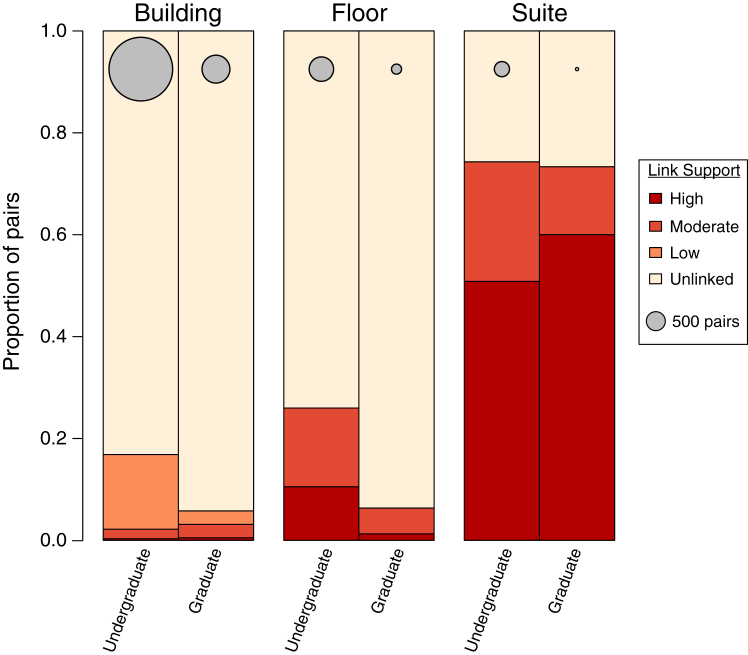
Findings: Within campus residences, SARS-CoV-2 transmission was frequent among students residing in the same room or suite. However, a quarter of pairs of suitemates with concurrent infections had distantly related viruses, suggesting separate sources of infection during periods of high incidence in the surrounding community. Students with concurrent infections residing in the same building were not at substantial increased probability of being members of the same transmission cluster. Genetic network and phylogeographic inference indicated that only between 3.1 and 12.4% of infections among students could be associated with transmission within buildings outside of individual suites. The only super-spreading event we detected was related to a large event outside campus residences.
Interpretation: We found little evidence for sustained SARS-CoV-2 transmission within individual buildings, aside from students who resided in the same suite. Even in the face of heightened community transmission during the 2021-2022 Omicron waves, congregate living did not result in a heightened risk for SARS-CoV-2 transmission in the context of the multi-pronged mitigation strategy.
Funding: SEARCH Alliance: Centers for Disease Control and Prevention (CDC) BAA (75D301-22-R-72097) and the Google Cloud Platform Research Credits Program. J.O.W.: NIH-NIAID (R01 AI135992). T.I.V.: Branco Weiss Fellowship and Newkirk Fellowship. L.L.: University of California San Diego.
Keywords: Mitigation; Phylogeography; SARS-CoV-2; Transmission cluster; University.
Copyright © 2025 The Author(s). Published by Elsevier B.V. All rights reserved.
Conflict of interest statement
Declaration of interests J.O.W. reports grants or contracts to their institution from the CDC and consulting fees as an expert witness (consulting fees paid to author) related to the COVID-19 pandemic. R.K. reports consulting fees from DayTwo, Cybele, and BiomSense, Inc.; serves on boards for GenCirq and Micronoma; and has stock in Biota. R.T.C. reports consulting fees or support from Amazon, Arcturus, and MicrobiotiX; serves on boards for Merck, Syneos, VIR Biotechnology; and has stock or stock options for Antiva Bioscienes and Arcturus. N.M. reports grants or contracts to their institution from Gilead and Abbive unrelated to this work. The SEARCH Alliance was funded in by the Centers for Disease Control and Prevention (CDC).
Figures

Similar articles
-
Safe reopening of college campuses during COVID-19: The University of California experience in Fall 2020.PLoS One. 2021 Nov 4;16(11):e0258738. doi: 10.1371/journal.pone.0258738. eCollection 2021. PLoS One. 2021. PMID: 34735480 Free PMC article.
-
Averting an Outbreak of SARS-CoV-2 in a University Residence Hall through Wastewater Surveillance.Microbiol Spectr. 2021 Oct 31;9(2):e0079221. doi: 10.1128/Spectrum.00792-21. Epub 2021 Oct 6. Microbiol Spectr. 2021. PMID: 34612693 Free PMC article.
-
Assessment of a Multifaceted Approach, Including Frequent PCR Testing, to Mitigation of COVID-19 Transmission at a Residential Historically Black University.JAMA Netw Open. 2021 Dec 1;4(12):e2137189. doi: 10.1001/jamanetworkopen.2021.37189. JAMA Netw Open. 2021. PMID: 34902039 Free PMC article.
-
SARS-CoV-2 Diversity and Transmission on a University Campus across Two Academic Years during the Pandemic.Clin Chem. 2025 Jan 3;71(1):192-202. doi: 10.1093/clinchem/hvae194. Clin Chem. 2025. PMID: 39749508
-
Surveillance-based informative testing for detection and containment of SARS-CoV-2 outbreaks on a public university campus: an observational and modelling study.Lancet Child Adolesc Health. 2021 Jun;5(6):428-436. doi: 10.1016/S2352-4642(21)00060-2. Epub 2021 Mar 19. Lancet Child Adolesc Health. 2021. PMID: 33751952 Free PMC article.
References
-
- Prather K.A., Marr L.C., Schooley R.T., McDiarmid M.A., Wilson M.E., Milton D.K. Airborne transmission of SARS-CoV-2. Science. 2020;370(6514):303–304. - PubMed
-
- Puglisi L.B., Brinkley-Rubinstein L., Wang E.A. COVID-19 in carceral aystems: a review. Annu Rev Criminol. 2023;6:399–422.
MeSH terms
LinkOut - more resources
Full Text Sources
Medical
Miscellaneous
