. 2025 Jun:116:105725.
doi: 10.1016/j.ebiom.2025.105725. Epub 2025 May 9.

SLK is mutated in individuals with a neurodevelopmental disorder

Collaborators, Affiliations

SLK is mutated in individuals with a neurodevelopmental disorder

Lama Alabdi et al. EBioMedicine. 2025 Jun.

Abstract

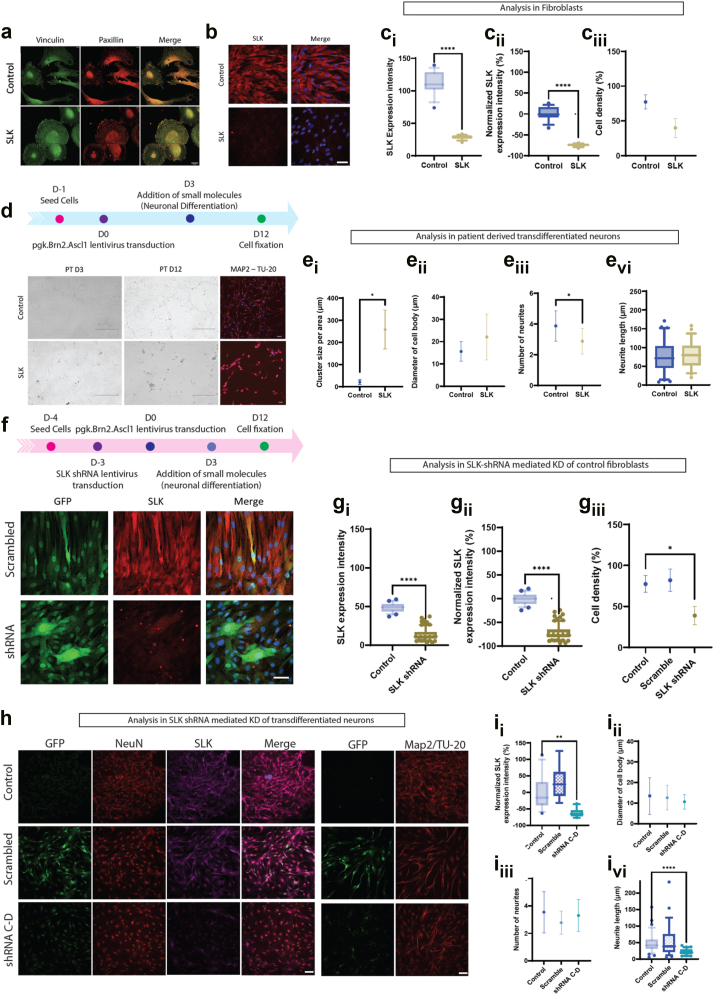
Background: Key to neuronal cell polarization and maturation is proper cytoskeletal organization and function that endows the bipolar neuronal cell with mature dendrites, axons, and functional synapses. Ste20-like kinase (SLK) has been shown to have various cytoskeletal roles. SLK regulates the polarity of microtubules, and its deficiency in the developing murine cortex leads to major defects including impaired development of the distal dendritic tree. No neurodevelopmental phenotypes in humans, however, have been linked to SLK.

Methods: Clinical phenotyping, positional mapping, exome sequencing and functional analyses using patient-derived cells, SLK knock down cell lines, as well as a Drosophila model of Slik deficiency (the orthologue of SLK).

Findings: We identified three individuals from three families (two are consanguineous) in whom a neurodevelopmental disorder (NDD) is linked to biallelic variants in SLK. The deleterious nature of these variants is confirmed by their failure to rescue the abnormal synapse maturation and locomotor defects phenotype in a Drosophila model of Slik deficiency. We also recapitulated the previously published abnormal cytoskeletal phenotype using patient cells, which showed abnormal organization of the cytoskeleton with accompanying impairment of migration and polarization. Furthermore, transdifferentiated neurons from patient fibroblasts displayed immature neuronal-like morphology with reduced dendritic arborization.

Interpretation: Our results support an autosomal recessive SLK-related NDD and suggest abnormal cytoskeleton-mediated neuronal maturation as the underlying mechanism.

Funding: MRC (MR/S01165X/1, MR/S005021/1, G0601943, MR/S005021/1), The National Institute for Health Research University College London Hospitals Biomedical Research Centre, Rosetree Trust, Ataxia UK, MSA Trust, Brain Research UK, Sparks GOSH Charity, Muscular Dystrophy UK (MDUK), Muscular Dystrophy Association (MDA USA). National Institutes of Health (NIH) grants HL134940 and DK098410. King Abdullah University of Science and Technology (KAUST) through the baseline fund to STA and LI as well as to STA and LI, and the KAUST Center of Excellence for Smart Health (KCSH), under award number 5932.

Keywords: Focal adhesion; Neurodevelopmental disorder; SLK; Transdifferentiation.


Conflict of interest statement

Declaration of interests FSA is a paid employee of Lifera Omics.

Figures

Fig. 1
Fig. 1
Pedigrees and clinical data of index individuals included in this study. (a–c) Pedigrees of the three study families with ∗ indicating individuals available for testing. (d and e) Frontal photos of the index individuals from Family 1 and Family 2, respectively illustrating subtle facial dysmorphism in Family 1_IV:1 (elongated face, prominent columella, and overbite). (f and g) Axial and sagittal brain CT cuts for Family 1_IV:1, respectively, depicting abnormally enlarged ventricles (hydrocephalus). (h) An axial brain MRI image for Family 2_ IV:3 showing abnormally dilated ventricles. (i) A sagittal brain MRI image for Family 2_IV:3 showing a cystic area in posterior fossa communicating with the 4th ventricle (Dandy-Walker variant).
Fig. 2
Fig. 2
Molecular characterization of NDD-associated SLK variants. (a) A schematic representation of the SLK gene; the red arrow indicates the variant identified in Family 1 while the green arrow indicates the variant identified in Family 2; both of which map to the same exon (exon 9). The yellow arrows indicate the compound heterozygous missense variants identified in the proband from Family 3 (b) A diagram depicting domains of the SLK protein and locations of identified variants. (c) Representative immunoblot analysis from three different replicates using protein derived from individual from family 1 (IV:1) lymphoblastoid cell line showing complete absence of both the full length as well as the predicted truncated version of the SLK protein. (d) A dot blot chart of qRT-PCR results showing marked reduction in the expression of SLK transcript in the index of family 1 (IV:1). The green circle points represent data points collected from three replicates from two different control samples, the red squares represent datapoints collected from three different replicates from the patient sample (IV:1). The horizontal line represents the mean.
Fig. 3
Fig. 3
Quantification of wound assay, Golgi appearance and microtubule distribution in patient-derived fibroblasts compared to control. (a) Representative images of sub-confluent fibroblast cells derived from either the index individual in Family 1 (IV:1) or control cell lines at 0 h of wound-induced cell migration assay. Scale bar: 1000 μm. (b) Wound closure was followed serially for 29 h during which a significant difference in cell migration was observed between the two cell lines. Scale bar: 1000 μm. (c) Percent wound closure was evaluated up to 29 h. (d) The remaining area of the wound was measured in μm2. The percent wound closure and area of the wound were measured using the ImageJ plugin Wound healing size tool image tool analysis (https://github.com/AlejandraArnedo/Wound-healing-size-tool/wiki). Data from 50 cells were collected and analysed. (e) Control cells showing perinuclear compact and polarized Golgi apparatus that are directed toward the migrating wound edge. (f) IV:1-derived fibroblast cells depicting a dispersed and non-polarized (oriented) Golgi apparatus towards the migrating/wound edge. (g) A representative image of normally polarized and parallel orientated microtubules in control cells. (h) A representative image of individual IV:1-derived fibroblast cells showing an un-polarized chaotic microtubule distribution; microtubules labelled with α-tubulin (green) and the centrosome is labelled with Pericentrin (orange) antibodies. (i) The total area of Golgi from 100 cells was measured using the ImageJ software. Error bars represent stdev. (j) The directional orientation of Golgi from 100 cells was assessed and presented as percent mean polarization with error bars representing stdev of 3 replicates. (k) The direction of orientation (paralellness) of microtubules was measured using the LPX ImageJ plugin (https://lpixel.net/services/research/lpixel-imagej-plugins/); and data presented as mean and stdev of images of 100 cells. Data from 50 cells were collected and analysed and p-value was calculated based on Welch's t-test for (c, d, i, j and k). The red squares represent datapoints collected from control sample, the green circles represent datapoints collected from the patient sample (IV:1). The horizontal line represents the mean.
Fig. 4
Fig. 4
The effect of SLK deficiency on Paxillin localization and neuronal differentiation. (a) Immunofluorescence staining for Paxillin and Vinculin in fibroblasts derived from the index individual in Family 1 (IV:1) (SLK) and control (Control/WT) cell lines. Green and red represent Vinculin and Paxillin, respectively, while yellow indicates their colocalization. The scale bar in the bottom right corner denotes a length of 20 μm. (b) Anti-SLK immunostaining on control and SLK mutant patient fibroblasts, scale bar = 50 μM. (ci) SLK expression intensity in control vs SLK mutant fibroblasts (p < 0.0001 (unpaired t-test with Welch's correction)). (cii) Normalized SLK expression percentage in control vs SLK mutant fibroblasts (p < 0.0001 (unpaired t-test with Welch's correction)). (ciii) Percentage change in cell density between control and SLK mutant fibroblasts (Kruskal–Wallis test, p = 0.1039). (d) Schematic representation of the transdifferentiation protocol (top panel). Representative images of control and SLK patient derived fibroblasts (PT D3 refers to 3 days post transduction with Brn2 and Ascl1 lentivirus, scale bar = 300 μM), transdifferentiated neurons (PT D12, 12 days after transduction; scale bar = 300 μM) and transdifferentiated fibroblasts were stained with Tubulin β-III and Map2. Scale bar = 50 μM. (ei) Statistical analysis of the transdifferentiated SLK patient derived fibroblasts. (p = 0.0256 (Mann Whitney test of normalized cluster size)) and cell body diameter (eii, p = 0.1229 (Unpaired t-test with Welch's correction of the number of neurites)). (eiii, p = 0.0471(Unpaired t-test with Welch's correction of the number of neurites)) and length of neurites (eiv, p = 0.7643 (Unpaired t-test with Welch's correction of the number of neurites)). (f) Schematic representation of lentiviral shRNA mediated knockdown (KD) of SLK followed by transdifferentiation to produce neurons (upper panel). shRNA mediated knockdown (KD) of SLK derived fibroblasts indicating the efficiency of the KD (bottom panel, Scale bar = 50 μM). (gi) Analysis in fibroblasts reveals that the shRNA mediated KD of SLK resulted in a marked reduction in SLK expression intensity (p < 0.0001 (Mann–Whiteny test)). (gii) Normalized SLK expression percentage decrease (Control vs shRNA mediated KD of SLK fibroblasts, (p < 0.0001 (Mann–Whiteny test)). (giii) Percentage change in cell density between control, scrambled shRNA and shRNA mediated KD of SLK fibroblasts (p = 0.0179 (Kruskal–Wallis test)). (h) Representative images of control, scrambled shRNA and shRNA mediated KD of SLK transdifferentiated neurons at 20× magnification. Scale bar = 300 μM. Please note the reduction in the SLK intensity in neurons derived from shRNA KD fibroblasts. (ii) Normalized percentage change in SLK expression intensity (Control vs scrambled shRNA vs shRNA mediated KD of SLK fibroblasts, p = 0.0089 (Brown-Forsythe and Welch ANOVA tests) and (iii, p = 0.1773 (Kruskal–Wallis test, of the diameter of cell body)), number of neurites (Iiii, p = 0.0178 (Kruskal–Wallis test, of the diameter of cell body)) and neurite length (Iiv, p < 0.0001 (Kruskal–Wallis test, of the diameter of cell body)).
Fig. 5
Fig. 5
Neuromuscular appearance and function in Drosophila larvae with silenced Slik compared to control. (a) On the left, a graphic representation of the Drosophila larval central nervous system. Red dotted lines delineate the outline of the ventral ganglion. On the right, the Drosophila larval ventral ganglion was visualized by GFP (green fluorescence) induced by Slik Trojan-Gal4. Scale bar: 40 μm. (b) Drosophila larval macrocephaly phenotype induced by elav-Gal4, neuron-specific expression of UAS-RNAi transgene targeting Slik. The Drosophila larval ventral ganglion was visualized by HRP (red). Scale bar: 40 μm. (c) Quantitation of Drosophila larval ventral ganglion size relative to that in control larvae. N = 6 larvae per genotype. (d) On the left, a graphic representation of the Drosophila larval central nervous system. Red dotted lines delineate the outline of the neuromuscular junction (NMJ). On the right, Drosophila larval NMJ phenotype induced by elav-Gal4, which drives neuron-specific expression of a UAS-RNAi transgene targeting Slik. The Drosophila larval NMJ was visualized by HRP (red). Synaptic vesicle protein CSP was detected by immunofluorescence (green). Scale bar: 10 μm. Scale bar magnification: 2 μm. (e and f) Quantitation of Drosophila larval NMJ bouton number and size compared to that in control larvae. N = 6 larvae per genotype. (g) Quantitation of Drosophila larval NMJ CSP intensity relative to that in control flies. N = 6 larvae per genotype. (h) Quantitation of Drosophila larval righting time. N = 20 larvae per genotype. (i) Quantitation of climbing ability in adult flies. N = 40 flies per genotype. (j) Survival curves for adult flies expressing Slik RNAi transgenes in their nervous system. N = 100 flies per genotype. Results have been presented as mean ± s.e.m., normalized to the control group. Statistical significance was defined as ∗p < 0.05, ∗∗p < 0.01, ∗∗∗p < 0.001 (Student's t-test for normal distributed data or Mann–Whitney test for nonnormal distributed data).
Fig. 6
Fig. 6
Neuromuscular developmental defects induced by Drosophila Slik silencing can be rescued by wildtype human SLK, but not NDD-associated variants. (a) Drosophila larval macrocephaly phenotype induced by elav-Gal4, neuron-specific expression of UAS-RNAi transgene targeting Slik. This macrocephaly phenotype can be restored by wildtype human SLK, but not disease variants. The Drosophila larval ventral ganglion was visualized by HRP (red). Scale bar: 40 μm. (b) Quantitation of Drosophila larval ventral ganglion size relative to that in control larvae. N = 6 larvae per genotype. (c) Drosophila larval NMJ phenotype induced by elav-Gal4, which drives neuron-specific expression of a UAS-RNAi transgene targeting Slik. This neuronal defect can be restored by wildtype human SLK, but not disease variants. The Drosophila larval NMJ was visualized by HRP (red). Synaptic vesicle protein CSP was detected by immunofluorescence (green). Scale bar: 2 μm. (d) Quantitation of Drosophila larval NMJ CSP intensity relative to that in control flies. N = 6 larvae per genotype. (e) Quantitation of Drosophila larval NMJ bouton size compared to that in control larvae. N = 6 larvae per genotype. (f) Quantitation of Drosophila larval righting time. N = 20 larvae per genotype. (g) Quantitation of climbing ability in adult flies. N = 40 flies per genotype. Results have been presented as mean ± s.e.m., normalized to the control group. Statistical significance was defined as ∗p < 0.05, ∗∗p < 0.01, ∗∗∗p < 0.001 (one-way analysis of variance followed by a Tukey–Kramer post-test for normal distributed data or Kruskal–Wallis H-test followed by a Dunn's test for non-normal distributed data).

References

    1. Ferrante M., Migliore M., Ascoli G.A. Functional impact of dendritic branch-point morphology. J Neurosci. 2013;33(5):2156–2165. - PMC - PubMed
    1. Scott E.K., Luo L. How do dendrites take their shape? Nat Neurosci. 2001;4(4):359–365. - PubMed
    1. Kapitein L.C., Hoogenraad C.C. Building the neuronal microtubule cytoskeleton. Neuron. 2015;87(3):492–506. - PubMed
    1. Yadav S., Oses-Prieto J.A., Peters C.J., et al. TAOK2 kinase mediates PSD95 stability and dendritic spine maturation through Septin7 phosphorylation. Neuron. 2017;93(2):379–393. - PMC - PubMed
    1. Wagner S., Flood T.A., O'Reilly P., Hume K., Sabourin L.A. Association of the Ste20-like kinase (SLK) with the microtubule: role in Rac1-mediated regulation of actin dynamics during cell adhesion and spreading. J Biol Chem. 2002;277(40):37685–37692. - PubMed

Substances

LinkOut - more resources