. 2025 Jun 11;5(6):100876.
doi: 10.1016/j.xgen.2025.100876. Epub 2025 May 9.

Identification of targetable vulnerabilities of PLK1-overexpressing cancers by synthetic dosage lethality

Affiliations

Identification of targetable vulnerabilities of PLK1-overexpressing cancers by synthetic dosage lethality

Chelsea E Cunningham et al. Cell Genom. .

Abstract

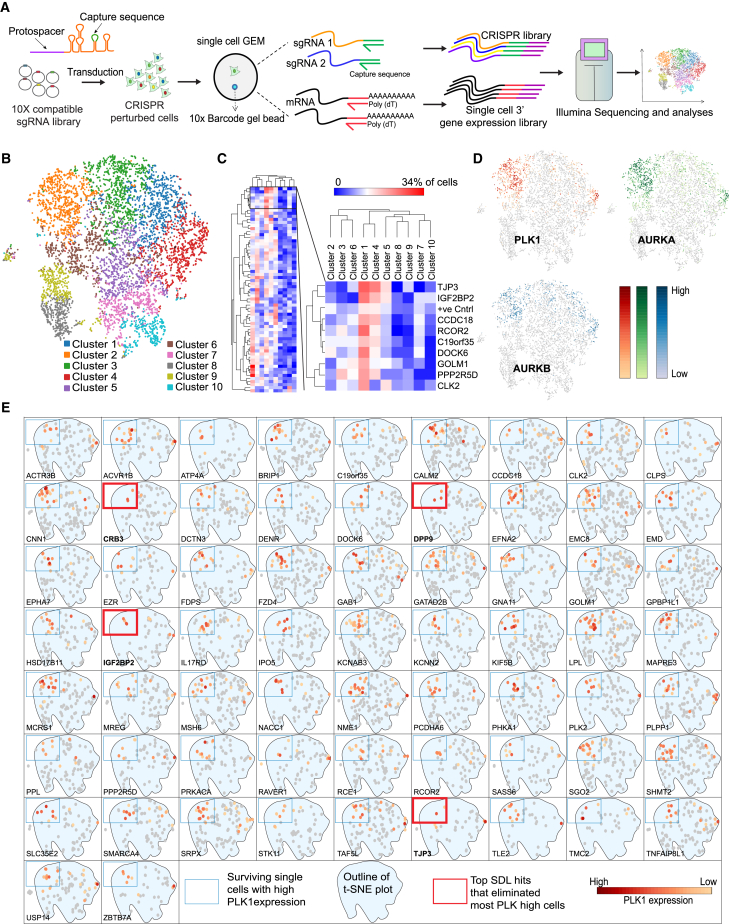
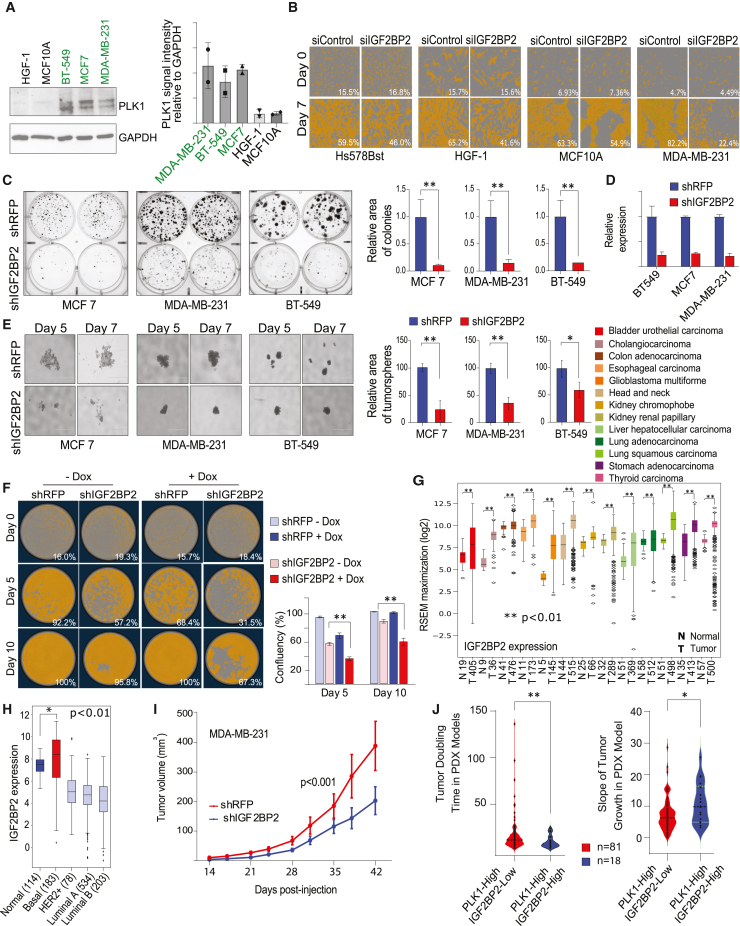
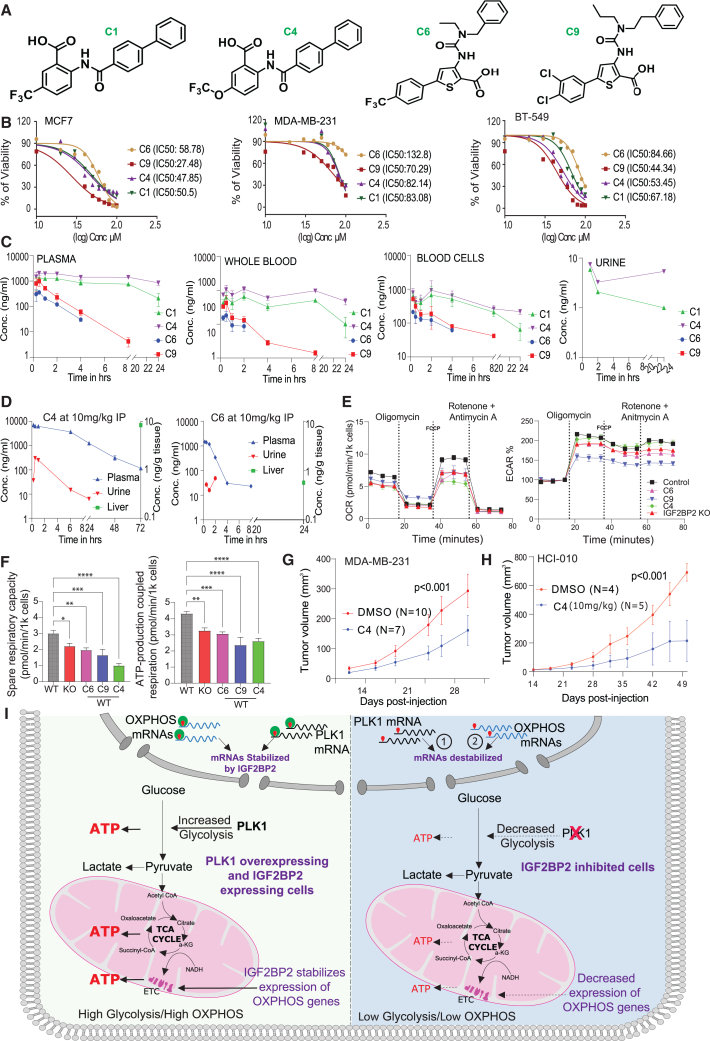
Chromosomal instability (CIN) drives tumor heterogeneity, complicating cancer therapy. Although Polo-like kinase 1 (PLK1) overexpression induces CIN, direct inhibition of PLK1 has shown limited clinical benefits. We therefore performed a genome-wide synthetic dosage lethality (SDL) screen to identify effective alternative targets and validated over 100 candidates using in vivo and in vitro secondary CRISPR screens. We employed direct-capture Perturb-seq to assess the transcriptional consequences and viability of each SDL perturbation at a single-cell resolution. This revealed IGF2BP2 as a critical genetic dependency that, when targeted, downregulated PLK1 and significantly restricted tumor growth. Mechanistic analyses showed that IGF2BP2 loss disrupted cellular energy metabolism and mitochondrial ATP production by downregulating PLK1 levels as well as genes associated with oxidative phosphorylation. Consistent with this, pharmacological inhibition of IGF2BP2 severely impacts the viability of PLK1-overexpressing cancer cells addicted to higher metabolic rates. Our work offers a novel therapeutic strategy against PLK1-driven heterogeneous malignancies.

Keywords: IGF2BP2; IMP2; PLK1; chromosomal instability; in vivo CRISPR screen; perturb-seq; single-cell CRISPR screening; synthetic dosage lethality; tumor heterogeneity.


Conflict of interest statement

Declaration of interests D.W.C reports consultancy and advisory relationships with AstraZeneca, Daiichi Sankyo, Exact Sciences, GenomeRx, Gilead, GlaxoSmithKline, Inivata/NeoGenomics, Lilly, Merck, Novartis, Pfizer, Roche, and SAGA and research funding to their institution from AstraZeneca, GenomeRx, Guardant Health, Grail, Gilead, GlaxoSmithKline, Inivata/NeoGenomics, Knight, Merck, Pfizer, ProteinQure, and Roche.

Figures

None
Graphical abstract
Figure 1
Figure 1
Genome-wide shRNA screening identifies synthetic dosage lethal partners of PLK1 (A) Schematic showing expected outcomes in PLK1-overexpressing cancer cells following PLK1 or PLK1-SDL gene inhibition. PLK1 inhibition may cause aneuploidy and increased cell death, while PLK1-SDL inhibition is expected to cause cell death alone. (B) Western blot of HCT116-PLK1-inducible cells with/without doxycycline. The upper band indicates phosphorylated PLK1-S137D; GAPDH serves as a loading control. (C) Schematic of genome-wide screening workflow with example microarray outcomes for non-essential (NE, green/yellow), SDL (blue), and essential (E, red) genes. (D) Volcano plot of pooled genome-wide shRNA screen. Genes significantly reducing fitness in PLK1-overexpressing vs. non-overexpressing cells (p < 0.05, WDC <2-fold) are shown in red (SDL hits), positives in blue. A total of 960 SDL hits were identified (full list in Table S1). (E) Schematic summarizing prioritization strategy for experimental validation. (F) CRISPR arrayed in vitro screening workflow in PDX breast cancer cells (±Cas9) using high-throughput imaging to assess lethality. (G) Western blot of PLK1 and Cas9 in HCI-010, HCI-010+Cas9, and non-malignant Hs578Bst cells; GAPDH used as loading control. (H) Sample images from automated imaging of different PLK1-SDL sgRNAs in −Cas9 and +Cas9 HCI-010 cells, with MetaXpress object masking (blue) shown for day 6. (I) Schematic of in vivo pooled CRISPR screen in PDX breast cancer model (±Cas9), with sequencing to identify sgRNA dropout. (J) Volcano plot of log10p value vs. WDC fitness score from the in vivo screen. Genes with p < 0.05 (WDC permutation-based) are significant; essential genes highlighted in red. (K) Final list of SDL hits identified across in vitro arrayed and in vivo pooled CRISPR screens.
Figure 2
Figure 2
Shortlisting of the top PLK1-SDL candidates using direct guide RNA capture Perturb-seq screening (A) Schematic of Perturb-seq screening using direct guide RNA capture. A 10X-compatible guide library with capture sequence 1 in the stem loop was transduced into MCF7 cells, followed by 4 days of culture post-puromycin selection. Gene expression and CRISPR knockout (KO) libraries were prepared after cell barcoding and indexing and sequenced using NovaSeq. (B) Single-cell K-means cluster projection of the t-SNE-embedded pooled sgRNA screen showing 10 clusters (n = 7,434 cells). (C) Hierarchical clustering using Pearson correlation of the knockout percentage per gene across the 10 clusters. Enriched knockouts in clusters 1 and 4, along with positive controls, are presented. (D) Expression of PLK1, AURKA, and AURKB (log2 scale, n = 7,434) shows high co-expression in cluster 2. (E) Cells with high PLK1 expression (boxed cluster 2) were traced across all 65 single-gene knockouts. Knockouts of CRB3, DPP9, IGF2BP2, and TJP3 showed the fewest cells with elevated PLK1.
Figure 3
Figure 3
IGF2BP2 affects the expression of PLK1 and reduces cellular respiration (A) Violin plots showing PLK1 levels in pooled single cells from 65 knockouts, generated using 10x Genomics Loupe Browser. (B) PLK1 and IGF2BP2 expression were positively correlated across multiple TCGA cancer types. Spearman correlations were calculated using log2 RSEM-normalized RNA-seq data. Each patient is a blue dot; frequency plots along the axes indicate expression distribution. Correlation coefficient (r), sample size (n), and p values are shown; the blue line indicates best fit. (C) Digital droplet PCR results (target/GAPDH ratios) show significant PLK1 downregulation in MCF7 (p < 0.001) and BT549 (p < 0.05) cells, and upregulation in MDA-MB-231 cells (p < 0.001) following IGF2BP2 knockdown. (D) RT-qPCR showing IGF2BP2 and PLK1 expression in Tet-induced and uninduced HCT116 cells, relative to controls. (E) Western blot of PLK1 levels after IGF2BP2 knockdown in Tet-inducible HCT116 cells; GAPDH used as loading control. (F) Differentially expressed genes related to OXPHOS in 2D vs. 3D cultures are marked in red (downregulated) or blue (upregulated). (G) Schematic of human respiratory chain (BioRender.com), highlighting genes downregulated in HCT116 IGF2BP2 knockout cells (shared in 2D and 3D); affected complexes marked in red. n = 3 biological replicates. (H) Transcript sequences from Ensembl (GRCh38.p14) were analyzed using Bio.Seq v1.83. Motifs “UGGA” or “AGGU” were counted; results visualized with seaborn. (I) Mitochondrial stress tests (Agilent) were performed on HCT116 wild-type and IGF2BP2 knockout cells; OCR and ECAR values are presented.
Figure 4
Figure 4
Loss of IGF2BP2 suppresses the growth of PLK1-overexpressing cells and tumors (A) Western blot showing PLK1 protein levels in non-malignant and malignant cells; quantification is shown on the right. (B) Sample images with orange cell masking (S3-IncuCyte) of non-malignant cells transfected with scrambled or IGF2BP2-targeting siRNA. Representative images from day 0 and day 7 are shown. PLK1-overexpressing MDA-MB-231 cells served as a control. Mean confluency from independent replicates (n = 3) is indicated in white. (C) Colony formation assay in breast cancer cells after IGF2BP2 knockdown; shRFP used as control. Colonies were quantified in ImageJ by area, in MCF7 (p < 0.01), MDA-MB-231 (p < 0.01), and BT549 (p < 0.05). (D) qPCR confirming IGF2BP2 knockdown following shIGF2BP2 lentiviral transduction vs. shRFP. (E) Representative tumorsphere images from MCF7, MDA-MB-231, and BT549 cells (scale bar, 1,000 μm), imaged with EVOS m5000. Tumorsphere area per well, quantified using ImageJ, was significantly reduced after IGF2BP2 knockdown (MCF7/MDA-MB-231: p < 0.01; BT549: p < 0.05). (F) Images with orange cell masking and quantification of PLK1-inducible HCT116 cells following IGF2BP2 knockdown using S3-IncuCyte. (G) TCGA data showing IGF2BP2 overexpression in multiple cancers (p < 0.01, Wilcoxon rank-sum test). Cancer type abbreviations follow the TCGA portal; x axis shows sample numbers. (H) TCGA breast cancer data classified by PAM50 shows IGF2BP2 is significantly overexpressed in TNBC. (I) Tumor volume after IGF2BP2 knockdown: MDA-MB-231 cells (2 × 10⁶) transduced with shIGF2BP2 or shRFP were injected into NSG mice (n = 10/group), with tumor volumes measured every 3–4 days. Tumor volume was significantly reduced in the knockdown group (p < 0.001, two-way ANOVA). (J) PDX models were categorized by PLK1 and IGF2BP2 expression. Tumor doubling times and growth slopes are shown for each group. Significance was determined by unpaired t test with Welch’s correction (∗p < 0.05; ∗∗p < 0.01); sample sizes are indicated.
Figure 5
Figure 5
Pharmacological inhibition of IGF2BP2 reduces tumor growth (A) Chemical structures of tested IGF2BP2 inhibitors. (B) Dose-response curves for compounds C1, C4, C6, and C9 in PLK1-overexpressing cell lines. (C) Concentrations of C1, C4, C6, and C9 in plasma, whole blood, blood cells (0.25–24 h), and urine (1, 2, 24 h) after i.v. administration (1 mg/kg). (D) Pharmacokinetics of C4 and C6 after i.v. injection (10 mg/kg): plasma levels of C4 (0.25–72 h) and C6 (0.25–24 h); liver concentrations at selected time points. (E) Mitochondrial stress test (Agilent) in HCT116 wild-type and IGF2BP2 knockout cells treated with 50 μM of C4, C6, C9, or DMSO for 4 h (n = 6 technical replicates). OCR and ECAR compared between treated wild-type and knockout cells. (F) Spare respiratory capacity (left) and ATP-linked respiration (right) of HCT116 wild-type cells treated with IGF2BP2 inhibitors compared with knockout cells. (G and H) Effect of C4 on tumor growth: MDA-MB-231 (2 × 10⁶) or HCI-010 (1 × 10⁶) cells were injected into mammary fat pads of female NSG mice. C4 (10 mg/kg) or DMSO was delivered i.p. in 2-hydroxypropyl-β-cyclodextrin, 5 days on/2 off for 30 days. Tumor volume (±SEM) measured every 3–4 days; group size shown on graph. Significance by nonlinear regression with least squares fit. (I) Proposed model: In IGF2BP2-intact cells, glycolysis and mitochondrial metabolism cooperate to generate ATP. IGF2BP2 inhibition reduces PLK1 mRNA (1) and downregulates OXPHOS-related genes (2) leading to cell death.

References

    1. Burrell R.A., McGranahan N., Bartek J., Swanton C. The causes and consequences of genetic heterogeneity in cancer evolution. Nature. 2013;501:338–345. doi: 10.1038/nature12625. - DOI - PubMed
    1. Burrell R.A., Swanton C. The evolution of the unstable cancer genome. Curr. Opin. Genet. Dev. 2014;24:61–67. doi: 10.1016/j.gde.2013.11.011. - DOI - PubMed
    1. McGranahan N., Swanton C. Biological and Therapeutic Impact of Intratumor Heterogeneity in Cancer Evolution. Cancer Cell. 2015;27:15–26. doi: 10.1016/j.ccell.2014.12.001. - DOI - PubMed
    1. Misale S., Arena S., Lamba S., Siravegna G., Lallo A., Hobor S., Russo M., Buscarino M., Lazzari L., Sartore-Bianchi A., et al. Blockade of EGFR and MEK intercepts heterogeneous mechanisms of acquired resistance to anti-EGFR therapies in colorectal cancer. Sci. Transl. Med. 2014;6 doi: 10.1126/scitranslmed.3007947. - DOI - PubMed
    1. Cunningham C.E., MacAuley M.J., Yadav G., Vizeacoumar F.S., Freywald A., Vizeacoumar F.J. Targeting the CINful genome: Strategies to overcome tumor heterogeneity. Prog. Biophys. Mol. Biol. 2019;147:77–91. doi: 10.1016/j.pbiomolbio.2019.02.006. - DOI - PubMed

MeSH terms