. 2025 May 10;11(1):122.
doi: 10.1038/s41531-025-00966-5.

An approach to characterize mechanisms of action of anti-amyloidogenic compounds in vitro and in situ

Affiliations

An approach to characterize mechanisms of action of anti-amyloidogenic compounds in vitro and in situ

P Stalder et al. NPJ Parkinsons Dis. .

Abstract

Amyloid aggregation is associated with neurodegenerative disease and its modulation is a focus of drug development. We developed a chemical proteomics pipeline to probe the mechanism of action of anti-amyloidogenic compounds. Our approach identifies putative interaction sites with high resolution, can probe compound interactions with specific target conformations and directly in cell and brain extracts, and identifies off-targets. We analysed interactions of six anti-amyloidogenic compounds and the amyloid binder Thioflavin T with different conformations of the Parkinson's disease protein α-Synuclein and tested specific compounds in cell or brain lysates. AC Immune compound 2 interacted with α-Synuclein in vitro, in intact neurons and in neuronal lysates, reduced neuronal α-Synuclein levels in a seeded model, and had protective effects. EGCG, Baicalein, ThT and doxycycline interacted with α-Synuclein in vitro but not substantially in cell lysates, with many additional putative targets, underscoring the importance of testing compounds in situ. Our pipeline will enable screening of compounds against any amyloidogenic proteins in cell and patient brain extracts and mechanistic studies of compound action.


Conflict of interest statement

Competing interests: AC Immune (ACI) provided two of the compounds used in the study and Ait-Bouziad, N., Davranche, A., Boudou, C., Tsika, E., Ouared, A., and Stöhr, J. are employees of ACI. LiP-MS is subject of a patent licensed to the company Biognosys. The other authors declare no competing interests.

Figures

Fig. 1
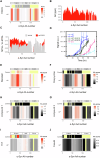
Fig. 1. A new amino acid-centric analysis approach for higher-resolution structural comparison with LiP-MS.
A Volcano plot comparing LiP peptide abundances generated upon limited proteolysis of α-Synuclein monomers and fibrils. B All detected and quantified LiP peptides and their corresponding scores (−log10(q-value) x |log2(fold change)|) were mapped along the α-Synuclein sequence. The scale reflects the score for every peptide. The more intense the red color, the higher the score. For all panels, not significant is shown in gray, not detected in yellow. C Structural fingerprint comparing α-Synuclein monomer and fibril after applying the classical LiP-MS data analysis pipeline. Significant regions (|log2FC| > 1, q-value < 0.05) in red. D Structural fingerprint comparing α-Synuclein monomer and fibril upon scoring changes per amino acid. The scale indicates the score per amino acid. The significance threshold of −log10(0.05) × |log2(2)| is shown in white, with red indicating higher scores. The more intense the red color, the higher the score. N-term N-terminus, NAC non-amyloid β component (aa 61–95), C-term C-terminus.
Fig. 2
Fig. 2. The amino acid centric analysis improves identification of small molecule binding regions.
A Volcano plot comparing abundances of peptides generated in FBP-bound and FBP-unbound ptsI. Significant (|log2FC| > 1, q-value < 0.05) in red, not significant in gray. B Fingerprint of the classical LiP-MS data analysis pipeline. Significant regions in red, not significant in gray, not detected in yellow. C Fingerprint upon scoring changes per amino acid. The scale indicates the score per amino acid. The significance threshold of −log10(0.05) × |log2(2)| is shown in white, with red indicating higher scores. The more intense the red color, the higher the score. Not significant in gray. Not detected in yellow. D Peptide centric fingerprint mapped on the ptsI structure (PDB: 2xz7). PEP in cyan. E Amino acid centric fingerprint mapped on the ptsI structure (PDB: 2xz7). PEP in cyan.
Fig. 3
Fig. 3. Effects of anti-amyloidogenic compounds on the structure of α-Synuclein upon in vitro aggregation.
Structures of ACI compound 1 (A; N-(2,3-dihydrobenzo[b][1,4]dioxin-6-yl)-6-methoxy-9-methyl-6,7,8,9-tetrahydro-5H-pyrido[2,3-b]indol-2-amine) and ACI compound 2 (B; (6R)-N2-(2,3-dihydro-1,4-benzodioxin-6-yl)-N6,9-dimethyl-5,6,7,8-tetrahydropyrido[2,3-b]indole-2,6-diamine). C ThT signal over a 17 h α-Synuclein aggregation assay in the indicated conditions (molar ratio compound/α-Synuclein of 5.7). D ThT fluorescence signal intensity after 17 h of incubation (TEnd). E Half time (T½) of aggregation extracted from ThT fluorescence curve profile. Inf, infinite. FL Structural fingerprints comparing the initial and final α-Synuclein structures under the indicated conditions: DMSO control condition (F), Fasudil (G), compound 1 (H), Doxycycline (I), compound 2 (J), Baicalein (K) and EGCG (L). The scale indicates the score per amino acid. The significance threshold of −log10(0.05) × log2(2) is shown in white, with red indicating higher scores. The more intense the red color, the higher the score. Not significant in gray. Not detected in yellow. N-term N-terminus, NAC non-amyloid β component (aa 61–95), C-term C-terminus.
Fig. 4
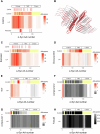
Fig. 4. Structural changes within monomeric α-Synuclein in the presence of compounds.
A Fingerprint of EGCG-treated α-Synuclein monomer compared to untreated α-Synuclein monomer. The upper panel indicates control (trypsin-only) peptide analysis. The lower panel indicates amino acid-level analysis of LiP peptides; the scales in both fingerprints (i.e., black to red) indicates the score per amino acid or peptide. The significance threshold of −log10(0.05) × log2(2) is shown in white, with red indicating higher scores. The more intense the red color, the higher the score. Not significant in gray and black. Not detected in pale yellow. B NMR spectra of α-Synuclein with 10 x EGCG. C MTSL/no MTSL of no EGCG (light gray) and 10 x EGCG (red) treated α-Synuclein monomer. D ThT assay with ΔN (Δ2-11) - and ΔC (Δ122-140) α-Synuclein treated with 10 x EGCG. EJ Fingerprints of the comparison of the untreated α-Synuclein monomer structure and α-Synuclein monomers treated with Baicalein (E), Doxycycline (F), compound 2 (G), compound 1 (H), Thioflavin T (I) and Fasudil (J). Scales in panels EJ are indicated, colors are as in (A).
Fig. 5
Fig. 5. Structural changes of α-Synuclein fibrils in the presence of compounds.
A Fingerprint of EGCG treated α-Synuclein fibril compared to untreated α-Synuclein fibril (upper panel control peptide analysis, middle panel amino acid analysis of LiP results, lower panel predicted interaction sites). The position of lysine residues is shown. The scale indicates the score per amino acid. The significance threshold of −log10(0.05) × log2(2) is shown in white, with red indicating higher scores. The more intense the red color, the higher the score. Not significant in gray. Not detected in pale yellow. B EGCG fingerprint mapped on the α-Synuclein fibril structure (pdb: 6cu7); color scheme as in (A). CH Fingerprints of the comparison of the untreated α-Synuclein fibril structure and α-Synuclein fibrils treated with Baicalein (C), Doxycycline (D), Thioflavin T (E), compound 2 (F), compound 1 (G) and Fasudil (H). Scales in panels CH are indicated, colors are as in (A).
Fig. 6
Fig. 6. Putative in situ binding targets of anti-amyloidogenic compounds.
Volcano plots showing peptides with altered abundance after addition of EGCG to a cell lysate (A) and brain lysate (B). Dotted lines indicate the significance threshold |log2FC| > 1, q-value < 0.05; peptides from α -synuclein are colored in red. (C) Structural fingerprint of α-Synuclein in cell (top) and brain (bottom) lysate. The scale indicates the score per amino acid. The significance threshold of −log10(0.05) × log2(2) is shown in white, with red indicating higher scores. The more intense the red color, the higher the score. Not significant in gray. Not detected in yellow. D Number of putative targets identified for the indicated compounds in a LiPQuant analysis in cell lysate (LiPQuant score > 2). E Plotted is the percentage of LiPQuant hits for doxycycline (LiPQuant score >2) (red) or background proteome (orange) that were previously identified in a doxycycline pulldown. Enrichment over background was calculated using Fisher’s exact test. F GO enrichment analysis (molecular function) for putative target proteins of the indicated compounds (LiPQuant score > 2). G Significant peptides (orange for EGCG, red for Baicalein) mapped on GRP78 structure (pdb: 3ldp). Small molecule inhibitor 3P1 in cyan. Binding site in purple. H Significant peptide (red) mapped on GLUD1 structure (pdb: 1l1f). ATP binding site extracted from “www.uniport.org” in cyan. I Significant peptide (red) mapped on bovine GLUD1 structure (pdb: 6dhl). ECG in cyan. J The two significant peptides (red) of Cytochrome C in the presence of Baicalein mapped on the Cytochrome C structure (pdb: 1j3s). HEME C in cyan. Significant peptides were defined as those with a LiPQuant score >2.
Fig. 7
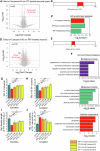
Fig. 7. Compound 2 interacts with α-Synuclein in situ and modifies its toxicity.
A Volcano plot shows proteins with structural changes detected by LiP-MS upon addition of compound 2 to a lysate of α-Synuclein PFF-seeded primary rat neurons. Note that the changing α-Synuclein peptide is specific for rat α-Synuclein and can therefore be confidently assigned to the endogenous neuronal protein and not to the added seeds. B Mapping structurally altered α-Synuclein peptide onto the sequence of α-Synuclein upon addition of compound 2 to a lysate. C GO enrichment analysis for all significant hits in (A). D Volcano plot showing LiP-MS hits structurally altered in primary rat neurons seeded with α-Synuclein and treated with compound 2, compared to untreated cells. The α-Synuclein and tau hits are marked; 61–67 indicates the location of the α-Synuclein peptide that is altered; note that this peptide cannot distinguish between rat and human α-Synuclein. E Mapping structurally altered peptide onto the sequence of α-Synuclein upon treating α-Synuclein seeded live rat neurons with compound 2. F GO enrichment analysis of LiP-MS hits in (D). Relative number of neurons (G) or TH positive neurons (H), relative neurite length of TH positive neurons (I) and relative alpha-synuclein quantity (J) upon treatment of neurons with PFFs and different concentrations of compound 2.

Similar articles

References

    1. Otzen, D. & Riek, R. Functional amyloids. Cold Spring Harb. Perspect. Biol. 11. 10.1101/cshperspect.a033860 (2019). - PMC - PubMed
    1. Spillantini, M. G. et al. Alpha-synuclein in Lewy bodies. Nature388, 839–840, 10.1038/42166 (1997). - PubMed
    1. Glenner, G. G. & Wong, C. W. Alzheimer’s disease: initial report of the purification and characterization of a novel cerebrovascular amyloid protein. Biochem. Biophys. Res. Commun.120, 885–890, 10.1016/s0006-291x(84)80190-4 (1984). - PubMed
    1. Wong, C. W., Quaranta, V. & Glenner, G. G. Neuritic plaques and cerebrovascular amyloid in Alzheimer disease are antigenically related. Proc. Natl. Acad. Sci. USA82, 8729–8732, 10.1073/pnas.82.24.8729 (1985). - PMC - PubMed
    1. Lunkes, A. et al. Proteases acting on mutant huntingtin generate cleaved products that differentially build up cytoplasmic and nuclear inclusions. Mol. Cell10, 259–269, 10.1016/s1097-2765(02)00602-0 (2002). - PubMed

LinkOut - more resources