. 2025 May 10;16(1):4352.
doi: 10.1038/s41467-025-59548-x.

Mapping the interaction surface between CaVβ and actin and its role in calcium channel clearance

Affiliations

Mapping the interaction surface between CaVβ and actin and its role in calcium channel clearance

Francisco Castilla et al. Nat Commun. .

Abstract

Defective ion channel turnover and clearance of damaged proteins are associated with aging and neurodegeneration. The L-type CaV1.2 voltage-gated calcium channel mediates depolarization-induced calcium signals in heart and brain. Here, we determined the interaction surface between actin and two calcium channel subunits, CaVβ2 and CaVβ4, using cross-linking mass spectrometry and protein-protein docking, and uncovered a role in replenishing conduction-defective CaV1.2 channels. Computational and in vitro mutagenesis identified hotspots in CaVβ that decreased the affinity for actin but not for CaV1.2. When coexpressed with CaV1.2, none of the tested actin-association-deficient CaVβ mutants altered the single-channel properties or the total number of channels at the cell surface. However, coexpression with the CaVβ2 hotspot mutant downregulated current amplitudes, and with a concomitant reduction in the number of functionally available channels, indicating that current inhibition resulted from a build-up of conduction silent channels. Our findings established CaVβ2-actin interaction as a key player for clearing the plasma membrane of corrupted CaV1.2 proteins to ensure the maintenance of a functional pool of channels and proper calcium signal transduction. The CaVβ-actin molecular model introduces a potentially druggable protein-protein interface to intervene CaV-mediated signaling processes.


Conflict of interest statement

Competing interests: The authors declare no competing interests.

Figures

Fig. 1
Fig. 1. Workflow diagram illustrating the strategy used to identify the interaction surface between CaVβ and actin by combining cross-linking mass spectrometry (XL-MS) with protein-protein docking and experimental validation.
The overall strategy can be divided in four phases; a pre-phase, named protein preparation, aimed to generate the proteins under study, and XL-MS, modeling and experimental and functional validation phases. The optimization of the XL-reaction conditions was done by testing different amounts of the XL (DSBU and DSSO) at different reaction times, as shown in Supplementary Fig. 1, and visualized by SDS-PAGE (1). Replicas of the optimal XL-reaction conditions were carried out for further analysis (2). The band containing the specific cross-linked product between CaVβ and actin was excised and in gel trypsinized (3). The mix of peptides were subjected to C18 stage tip cleaning (4) and LC-MS/MS (5). XL-MS data analysis was performed using three different search engines (6). Unique intermolecular cross-links that were identified by at least two search engines (7) were considered for filtering using DisVis (8) to obtain a set of self-consistent XL-MS derived distance restraints (9). XL-MS restraints together with bioinformatics-predicted restraints from NACCESS and CPORT programs, considered as unambiguous and ambiguous restraints, respectively (10), served as input files for the HADDOCK hybrid docking protocol (11) to generate CaVβ–actin models (12). The top four HADDOCK models of the selected docking cluster were used to predict hotspots via Computational Alanine Scanning (CAS) with six predictors (Anchor, BeAtMuSiC, Bude Alanine Scan, Mutabind2, Robetta and SAAMBE-3D) (13). Hotspot mutations selected based on the average ΔΔG over the six predictors were introduced by site-directed mutagenesis into CaVβ (14). The impact of the CaVβ hotspot mutants on its binding affinity for actin were assessed by in vitro assays (15), and the mutants with decreased affinity were tested for its effect on calcium channel function in living cells by electrophysiology (16).
Fig. 2
Fig. 2. Chemical XL-MS and computational analysis define a set of distance constraints for modeling the CaVβ–actin complex.
A Domain architecture (top) and crystal structure (bottom) of rat CaVβ2 (UniProtKB Q8VGC3-2; PDB 5V2P). Src homology 3 (SH3) and guanylate kinase (GK) domains forming the protein core are labeled. Numbers represent the first and last residues. B Size exclusion chromatography profile of the CaVβ2-core; inset, purified protein resolved by SDS-PAGE. Numbers denote the size of molecular weight (MW) standards. The experiments were repeated at least 3 times. C Representative SDS-PAGE images of optimal cross-linking reactions for the CaVβ2-core and actin using DSSO, DSBU, and control reaction with only vehicle, no cross-linker (Non-XL) from 5, 4 and 3 independent replicas, respectively. DSSO: lane 1, MW standards; lane 2, CaVβ2-core–actin cross-linking; lane 3, actin alone incubated with DSSO; and lane 4, CaVβ2-core alone incubated with DSSO. DSBU: lane 1, CaVβ2-core–actin cross-linking; lane 2, actin alone incubated with DSBU; and lane 3, CaVβ2-core alone incubated with DSBU. MW standards lane was omitted and the full image is shown in Supplementary Fig. 1. The red arrow and asterisk denote the band that was excised from the gel for tryptic digestion and LC-MS/MS analysis. Non-XL control: lane 1, MW standards; lane 2, CaVβ2-core and actin together incubated with DMSO; lane 3, actin alone incubated with DMSO; and lane 4, CaVβ2-core alone incubated with DMSO. D Linear representation depicting the location and residue number of unique intermolecular cross-links between CaVβ2-core and actin (UniProtKB P68135, PDB 5OOE). E Three-dimensional ribbon representation of two adjacent actin monomers in one protofilament, named n and n + 2, shown in yellow and pink, respectively. Actin amino acids participating in the unique intermolecular cross-links (shown as spheres, with those in monomer n + 2 labeled with a prime (ʹ) symbol) form a contiguous patch across two adjacent actin subunits (black contour). F Structural mapping of inter-cross-links (red lines) that satisfied data consistency upon DisVis filtering for one CaVβ2 molecule and two adjacent actin monomers. Actin is shown in space-filling and ribbon mode, but for clarity CaVβ2 is displayed in ribbon mode only.
Fig. 3
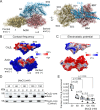
Fig. 3. Model of CaVβ2 bound to actin shows an extended contact surface and electrostatic complementarity.
A Space-filling and ribbon diagram showing two views related by a 90° rotation of the best-scoring docking model of CaVβ2 complexed with actin. One molecule of CaVβ2 (blue) interacts with two adjacent monomers in one actin protofilament, named n (yellow) and n + 2 (pink). Actin subunits are labeled based on their position along the filament from the pointed end (−) to the barbed end (+). For clarity, CaVβ2 is shown in ribbon mode only in the right panel. The four actin subdomains, SD1–SD4, are labeled in the n monomer. Subdomains in monomer n + 2 are indicated with a prime (ʹ); SD2ʹ and SD3ʹ were omitted. B Surface models showing the contact frequency of CaVβ2 and actin residues. C Same as in B but showing the electrostatic potential map of both proteins. D SDS-PAGE analysis of a representative F-actin cosedimentation assay using the indicated NaCl concentrations. Briefly, the CaVβ2-core was incubated with phalloidin-stabilized actin filaments, the mixture was centrifuged, and the supernatant (S) and pellet (P) fractions separated. The pellet was resuspended in the same volume of SDS-loading buffer as the volume of supernatant, and the supernatant and pellet fractions were resolved by denaturing SDS-PAGE. Control assays included the CaVβ2-core only (lower panel). For clarity, irrelevant lanes were cropped from the source images (as indicated by the white space); full gel images are shown in Supplementary Fig. 8. E Fraction of CaVβ2-core bound to actin (calculated by densitometry) against NaCl concentration. Box plot shows the mean (dashed line), median (continuous line), interquartile range (25th–75th percentiles, box edges) and whiskers (1.5× interquartile range). Each dot represents an independent experiment; p-values, two-tailed t-test. Each experiment was repeated three times. Also see Supplementary Fig. 8.
Fig. 4
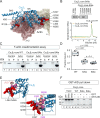
Fig. 4. Alanine substitution of predicted PPI hotspots decreases the in vitro affinity of CaVβ2 for actin but not for the AID peptide.
A Structure of CaVβ2 (blue ribbon), indicating the eight predicted hotspot residues (red spheres) mutated to alanine in the CaVβ2-core. Two actin subunits interacting with CaVβ2 are shown in space-filling mode, oriented from the barbed end (n + 2, pink) to the pointed end (n, yellow). B Linear diagram of the CaVβ2-core domain, indicating the positions of hotspot mutations and size exclusion chromatography profiles of the hotspot mutants, CaVβ2-core 6Ala (orange) and CaVβ2-core 8Ala (green). The arrow denotes the elution volume for CaVβ2-core WT. C SDS-PAGE of representative F-actin cosedimentation assays for the CaVβ2-core WT (lanes 2–5), CaVβ2-core 6Ala (lanes 6–9), and CaVβ2-core 8Ala (lanes 10–13). MW standard (lane 1). CaVβ2-core-derived proteins were centrifuged either alone (control) or after incubation with polymerized actin (actin). S, supernatant; P, pellet. Asterisks denote bands of CaVβ2-core-derived proteins that pelleted with actin. Each experiment was repeated three times; full images are shown in Supplementary Fig. 11A. D Fraction of the indicated CaVβ2-core proteins bound to actin. Box plot shows the mean (dashed line), median (continuous line), interquartile range (25th–75th percentiles, box edges) and whiskers (1.5× interquartile range). Each dot represents an independent experiment; p-values, unpaired two-tailed t-test. E CaVβ2 complexed with the AID peptide (PDB 5V2P). CaVβ2 is depicted as a blue ribbon with hotspots for actin binding as red van der Waals spheres and the critical residues for CaVβ association (L352, I343, and M245), in purple. The AID is shown as a pink ribbon. F SDS-PAGE of a representative pull down assay using as bait GST, either alone or fused to AID (GST-AID) and as prey CaVβ2-core WT (WT), CaVβ2-core 6Ala (6Ala), or CaVβ2-core 8Ala (8Ala). MW standards (lane 1), CaVβ2-core proteins used as input (lanes 2–4), elution fractions from the GST (control, lanes 5, 7, and 9) and GST-AID pull down assays (lanes 6, 8, and 10). Each experiment was repeated three times; full images are shown in Supplementary Fig. 11C.
Fig. 5
Fig. 5. CaVβ4 R482X hotspot mutations blunt association with actin.
A Superimposition of the actin-bound structures of CaVβ2 (cyan ribbon) and CaVβ4 (purple ribbon). Each CaVβ structure represents the average of the four best-scoring models of the selected docking cluster. For clarity, two actin subunits used as a reference for the alignment are shown in space-filling mode (yellow and pink). B Linear diagram and comparison of the in vitro actin-binding affinities by F-actin cosedimentation assay for Cavβ4-core (lanes 2–5) and Cavβ4 R482X (lanes 6–9). Numbers denote the positions of predicted hotspots substituted by alanine in the CaVβ4 R482X background according to human CaVβ4 (UniProtKB O00305-1). S and P, supernatant and pellet fractions, respectively. Single and double black arrows indicate the amount of corresponding protein that cosedimented with actin. The assays were repeated at least 3 times (Supplementary Fig. 15A). C Size exclusion chromatography profiles for CaVβ4 R482X (carrying no Ala substitutions) (black), CaVβ4 R482X 6Ala (orange), and CaVβ4 R482X 8Ala (green). D SDS-PAGE of F-actin cosedimentation assays for CaVβ4 R482X (lanes 2–5), CaVβ4 R482X 6Ala (lanes 6–9), and CaVβ4 R482X 8Ala (lanes 10–13). S, supernatant; P, pellet. Asterisks indicate protein bands that pelleted with actin. Each experiment was repeated three times; full images are shown in Supplementary Fig. 15C. E Fraction of the indicated CaVβ4 R482X proteins bound to actin. In box plot: mean (dashed line), median (continuous line), interquartile range (25th–75th percentiles, box edges), and whiskers (1.5× interquartile range). Each dot represents an independent experiment; p-values, unpaired two-tailed t-test. F SDS-PAGE of a representative pull-down assay using as bait GST, either alone or fused to AID (GST-AID), and as prey CaVβ4 R482X (–), CaVβ4 R482X 6Ala (6Ala), or CaVβ4 R482X 8Ala (8Ala). Molecular weight standard (lane 1), CaVβ4 R482X-derived proteins used as input (lanes 2–4), elution fractions from the pull down assay using either GST (lanes 5, 7, and 9) as control or GST-AID (lanes 6, 8, and 10) and the indicated proteins. Each experiment was repeated three times; full images are shown in Supplementary Fig. 15D.
Fig. 6
Fig. 6. An actin-association-deficient CaVβ2 mutant decreases CaV1.2-mediated ionic current but not gating currents.
A Schematic of the membrane-associated CaVβ2 fused to mRFP (CaVβ2-mRFP) and laser scanning confocal images of HEK293 cells expressing either the wild-type full-length CaVβ2 (WT) or the eight hotspot mutant (8Ala). Fluorescence images for the indicated CaVβ2 (a;d, magenta) and the plasma membrane marker CellMaskTM (b;e, green); overlapping pixels appear as white (c;f). Scale bar, 15 µm (for all images). B Colocalization analysis between the indicated CaVβ2 protein and CellMaskTM. Box plot shows the mean (dashed line), median (continuous line), interquartile range (25th–75th percentiles, box edges) and whiskers (1.5 × interquartilee range). Each dot represents the Mander’s overlap coefficient (MOC) for a field of view containing between 150 and 200 cells; p-value, two-tailed t-test. C Western blot (WB) of crude lysates from cells expressing either CaVβ2 WT or CaVβ2 8Ala. Lysates from three separate experiments were probed with anti-CaVβ2 and anti-GAPDH antibodies. D Representative ionic current traces and plots of ionic current versus voltage (I/V) and fraction of activated channels versus voltage obtained from HEK293 cells cotransfected with CaV1.2 and either CaVβ2 WT or CaVβ2 8Ala. Only the traces induced by −40, +15, and +40 mV pulses are shown. Currents were elicited by voltages of −50 to +50 mV in 5 mV increments from a holding potential of −90 mV; Data are presented as mean ± SEM; number of recorded cells = 32, 29 and 5 for CaV1.2/CaVβ2 WT, CaV1.2/CaVβ2 8Ala, and CaV1.2 alone, respectively. E Representative gating currents obtained from cells in panel (D) and total charge movement (Qon) calculated from the integral of the On gating current (shaded area) during the voltage step to the reversal potential for the carrier ion, Ba2+. In box plot: mean (dashed line), median (continuous line), interquartile range (25th–75th percentiles, box edges) and whiskers (1.5 × interquartile range). Each dot represents an individual recorded cell; p-values, unpaired two-tailed t-test. Mean values ± S.E.M: 363 ± 33 fC (n = 32) and 304 ± 28 fC (n = 29) for CaV1.2/CaVβ2 WT and CaV1.2/CaVβ2 8Ala, respectively.
Fig. 7
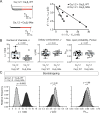
Fig. 7. The CaVβ2 actin association-deficient mutant reduces the number of functional CaV1.2 channels and does not alter the channel conductance or maximal open probability.
A Representative ionic current traces, with red lines delineating the time window used for noise analysis and plotting the relationship between variance and mean macroscopic current σ2IVmVrev versus IVmVrev obtained at different voltages for two representative cells expressing CaV1.2 complexed with either CaVβ2 WT or CaVβ2 8Ala. The number of functional channels n and the unitary conductance γ were calculated from the slope and y-intercept of the linear fit, respectively (Eq. 6). B Box plots for n, γ, and Pomax. The box edges represent interquartile ranges (25th–75th percentiles), the continuous and dashed lines the median and mean values and the ranges of the whiskers denote 1.5× the interquartile range. Each data point represents an individual recorded cell (number of cells = 18 and 17 for CaV1.2/CaVβ2 WT and CaV1.2/CaVβ2 8Ala, respectively). P-values were determined by unpaired two-tailed t-test. The smaller unitary conductance value for CaV1.2 reported here is explained by the absence of CaV agonists in our whole-cell current recordings. C Bootstrap sample distributions for n, γ, and Pomax (bootstrap sample N = 500,000). The mean values for n, γ, and Pomax obtained from the corresponding bootstrap distributions are; n, 12233 ± 1219 for CaV1.2/CaVβ2 WT and 6580 ± 899 for CaV1.2/CaVβ2 8Ala; γ, 3.9 ± 0.1 pS for CaV1.2/CaVβ2 WT and 4.0 ± 0.1 pS for CaV1.2/CaVβ2 8Ala; and Pomax, 0.59 ± 0.02 for CaV1.2/CaVβ2 WT and 0.60 ± 0.02 for CaV1.2/CaVβ2 8Ala; p-values were determined by bootstrap t-test.
Fig. 8
Fig. 8. CaVβ4 R482X hotspots mutant keeps CaV1.2-mediated ionic current intact.
A Representative laser scanning confocal images of HEK293 cells expressing either CaVβ4 R482X (a;c) or CaVβ4 R482X 8Ala (d;f) fused to mCherry. Plasma membrane was stained with CellMaskTM (b;e, green). Merged images (c;f). Scale bar, 15 µm (for all images). B Western blot of three separate crude lysates from cells expressing either CaVβ4 R482X (--) or the 8Ala mutant (8Ala) probed with anti-CaVβ4 and anti-GAPDH antibodies. Uncropped images are shown in Supplementary Fig. 18A. C Representative ionic current traces (induced by −35, +20, and +45 mV pulses) from cells co-expressing CaV1.2 with either CaVβ4 R482X or CaVβ4 R482X 8Ala. D Plots of ionic current and fraction of activated channels versus voltage, and total charge movement (Qon) from the indicated channel subunit combinations. Ionic currents were elicited by voltages of −50 to +50 mV in 5 mV increments from a holding potential of −90 mV; data are presented as mean ± SEM. In the box plot, the edges represent interquartile ranges (25th–75th percentiles), the continuous and dashed lines, the median and mean values and whiskers denote 1.5× the interquartile range. Each data point represents an individual recorded cell. Qon mean values ± SEM: 234 ± 24 fC and 259 ± 37 fC (number of cells = 24 and 20) for CaV1.2/CaVβ4 R482X and CaV1.2/CaVβ4 R482X 8Ala, respectively. E Box plots for n, γ, and Pomax for the indicated channel subunit combinations with interquartile ranges (25th–75th percentiles), median (continuous line), mean (dashed lines) and whiskers (1.5× the interquartile range). Each individual data point represents an individual recorded cell (number of cells = 13 and 15 for CaV1.2/CaVβ4 R482X and CaV1.2/CaVβ4 R482X 8Ala, respectively); p-values, unpaired two-tailed t-test. F Bootstrap distributions from the data shown in panel (E). Bootstrap sample N = 500,000. The mean values for n, γ, and Pomax are: n, 2901 ± 509; γ, 3.4 ± 0.1 pS and Pomax, 0.61 ± 0.02 for CaV1.2/CaVβ4 R482X, and n, 3425 ± 437; 3.8 ± 0.3 pS and 0.63 ± 0.03 for CaV1.2/CaVβ4 R482X 8Ala; p-values, bootstrap t-test.
Fig. 9
Fig. 9. Model for the clearance of corrupted CaV1.2 channels from the plasma membrane.
Conformationally impaired CaV1.2 proteins at the plasma membrane can be generated by diverse cellular stimuli, which change the channel environment leading to local unfolding, or by exocytic insertion of misfolded channels that evade cytosolic quality control (biosynthetic misfolding). CaVβ–actin interaction is mandatory for the endocytic removal of corrupted CaV1.2 channels, which prevents their build-up and maintains stable CaV1.2 currents, but not for the insertion of functionally folded channels. PM, plasma membrane.

Similar articles

References

    1. Catterall, W. A. Voltage-gated calcium channels. Cold Spring Harb. Perspect. Biol.3, a003947 (2011). - PMC - PubMed
    1. Hidalgo, P. & Neely, A. Multiplicity of protein interactions and functions of the voltage-gated calcium channel β-subunit. Cell calcium42, 389–396 (2007). - PubMed
    1. Neely, A. & Hidalgo, P. Structure-function of proteins interacting with the α1 pore-forming subunit of high-voltage-activated calcium channels. Front. Physiol.5, 209 (2014). - PMC - PubMed
    1. Rima, M. et al. Protein partners of the calcium channel β-subunit highlight new cellular functions. Biochemical J.473, 1831–1844 (2016). - PubMed
    1. Buraei, Z. & Yang, J. Structure and function of the beta subunit of voltage-gated Ca(2)(+) channels. Biochimica et. biophysica acta1828, 1530–1540 (2013). - PMC - PubMed

LinkOut - more resources