. 2025 May 10;10(1):92.
doi: 10.1038/s41541-025-01138-5.

Cellular immune signatures and differences of four porcine circovirus type 2 vaccines to heterologous PCV2d infection

Affiliations

Cellular immune signatures and differences of four porcine circovirus type 2 vaccines to heterologous PCV2d infection

Shuai Li et al. NPJ Vaccines. .

Abstract

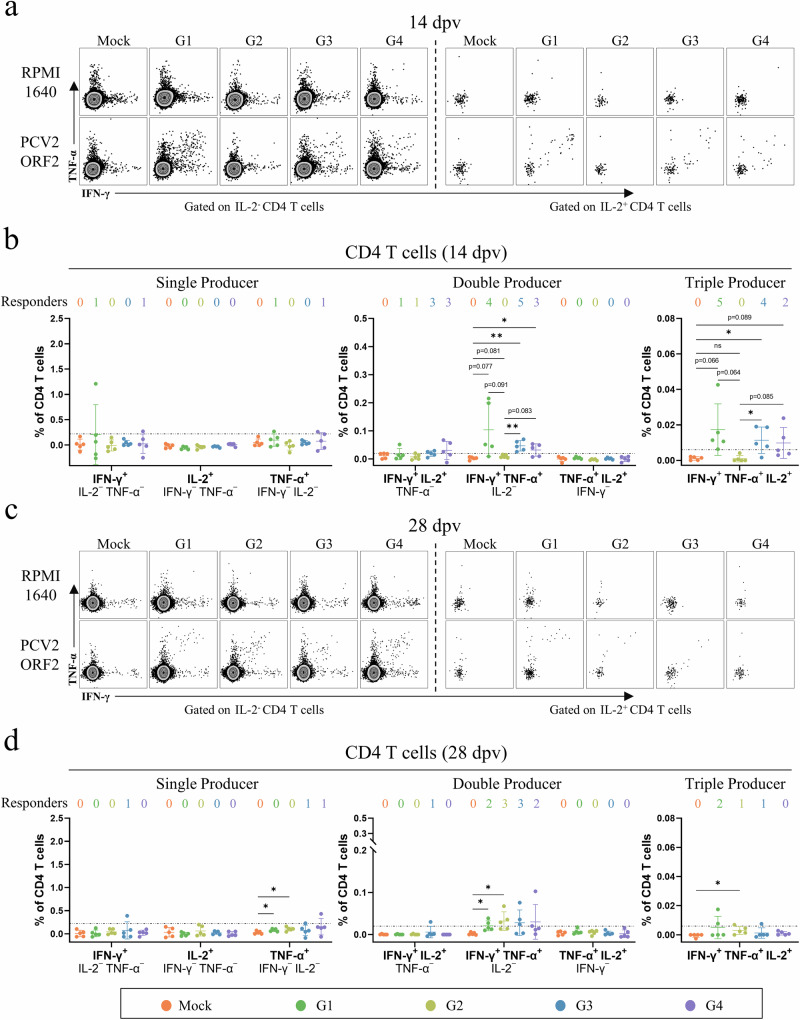
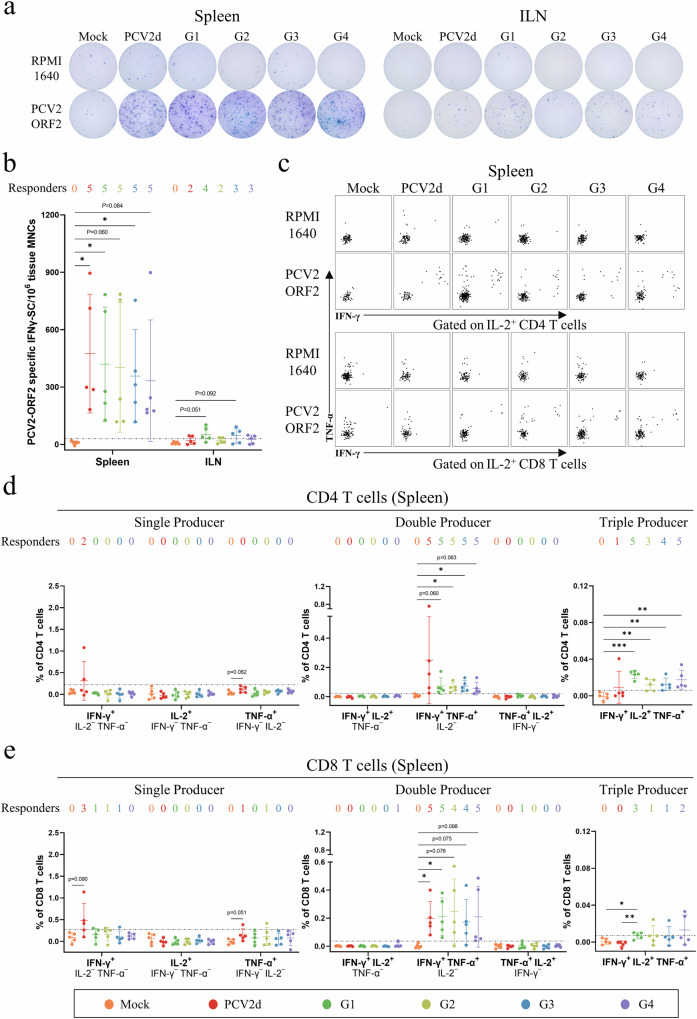
Multiple PCV2 vaccines originating from different antigens and formula are commercially available and have shown great effectiveness in protecting pigs from clinical disease. However, our understanding of the immune mechanisms underlying these vaccine-induced protection is fairly limited, except for antibody responses. Head-to-head comparisons of T-cell responses induced by these vaccines in pigs would provide valuable insights into the mechanisms of protective immunity against PCV2. Here, T-cell responses in peripheral blood of pigs after vaccination with four representative PCV2 vaccines, as well as local and systemic recall responses following challenge with a PCV2d strain were examined. All four PCV2 vaccines induce a rapid cellular immune response that could be detected as early as 7 days post-vaccination. Some vaccine-primed CD4 T cells exhibit multifunctionality, being capable of secreting double (IFNγ/TNFα) and even triple cytokines (IFNγ/TNFα/IL-2) simultaneously. In contrast, a weak CD8 T cell response was also detected in the vaccinated pigs but just IFNγ/TNFα double producer and lack of cytotoxicity. These vaccine-activated CD4 and CD8 T cells displayed phenotypes of effector memory or terminally-differentiated effector memory T cells, which rapidly expand to subsequent PCV2d challenges. Prior-vaccinated pigs exhibited a stronger T cell cytokine response post-challenge, being most evident in the spleen. Notably, the cellular immune response induced by different types of PCV2 vaccines exhibited high similarity in phenotypic and functional properties, while showing significant differences in kinetics and magnitude. These results advance our understanding of cell-mediated immune protection afforded by different PCV2 vaccines and unravel fundamental differences in cellular immune response induced by PCV2 vaccines utilizing diverse technologies.


Conflict of interest statement

Competing interests: The authors declare no competing interests.

Figures

Fig. 1
Fig. 1. Experimental design of T-cell immune responses.
Thiry SPF pigs were divided into six groups (5 pigs/group): Mock (tangerine), PCV2d (red), G1 (green), G2 (mustard), G3 (blue), and G4 (purple) group. The G1-G4 groups were vaccinated with different vaccines, while the PCV2d and Mock groups served as negative controls. At 28 dpv, the G1-G4 and PCV2d groups were challenged with PCV2d, while the Mock group remained unchallenged. Heparinized blood was collected weekly (0, 7, 14, 21, 28 dpv, and 7, 14 dpc) to prepare peripheral blood mononuclear cells (PBMCs) for different immunological assays at indicated time points. All pigs were euthanized at 42 dpv (14 dpc), and spleen and inguinal lymph node (ILN) were collected to isolate mononuclear cells (MNCs) for several immunological tests. This figure and all its elements were originally created by the authors using Adobe Illustrator and Microsoft PowerPoint without adaptation of copyrighted material.
Fig. 2
Fig. 2. The PCV2-ORF2-specific IFNγ-SC responses in PBMCs after vaccination.
PBMCs from different groups were prepared at indicated time points to enumerate the IFNγ-secreting cells (IFNγ-SC) following stimulation with PCV2-ORF2 antigen, with cRPMI-incubated cultures serving as blank controls. a Dynamic changes of the PCV2-ORF2-specific IFNγ-SC in PBMCs across all groups post-vaccination. Data was expressed as the number of IFNγ-SC/106 PBMCs after background subtraction. Individual pigs were shown as gray symbols with connecting lines. The dotted black line indicates the limit of detection (LOD) and the thick color-coded lines represent the mean at each time point post-vaccination. Statistical significance was analyzed using an unpaired two-tailed t-test with Welch’s correction when indicated. “Intergroup Comparison” on the top panel shows the difference between each time point in different groups, color-coded per comparison based on the group compared (Mock-tangerine, G1-green, G2-mustard, G3-blue, and G4-purple). P values < 0.1 are indicated in bold, and <0.05 are shown in underlined and bold. Responders on the top depict the number of pigs with positive responses at different time points. b Representative images of ELISPOT wells of each group at 0, 7, 14, 21, and 28 dpv. c Temporal patterns of peak IFNγ-SC responses across groups.
Fig. 3
Fig. 3. The multifunctional CD4 T-cell responses in PBMCs after vaccination.
Intracellular cytokine staining of PBMCs isolated from 14 and 28 dpv was performed following restimulation with PCV2-ORF2 antigen, with cRPMI-incubated cultures as blank controls. Representative dot plots for IFNγ/TNFα double-positive and IFNγ/TNFα/IL-2 triple-positive CD4 T cells in PBMCs from different groups at 14 dpv (a) and 28 dpv (c). Comparison of single-, double-, or triple-positive cytokine responses in CD4 T cells at 14 dpv (b), and 28 dpv (d) among different groups. Each colored symbol represents background-subtracted data from one pig, with horizontal lines indicating mean ± standard deviation (SD). The limit of detection (LOD) is shown with dashed black lines. Responders on the top depict the number of positives within different groups. Statistical significance was analyzed using an unpaired two-tailed t-test with Welch’s correction when appropriate; ns non-significant, *P < 0.05, **P < 0.01.
Fig. 4
Fig. 4. The multifunctional CD8 T-cell responses in PBMCs after vaccination.
At 14 and 28 dpv, intracellular cytokine staining of PBMCs was conducted after in vitro restimulation with PCV2-ORF2 antigen, with cRPMI-maintained cultures as blank controls. a Representative graphs for IFNγ/TNFα double-positive CD8 T cells in PBMCs from different groups at 14 and 28 dpv. Comparison of single-, double-, or triple-positive cytokine responses in CD8 T cells at 14 dpv (b), and 28 dpv (c) across distinct groups. Background-subtracted data are shown as scatterplots with individual samples (dots); the horizontal line represents the mean; error bars show standard deviations (SD); dashed black line denotes the limit of detection (LOD); Responders (top row) depicts the number of positives in diverse groups. P values were determined from an unpaired two-tailed t-test with Welch’s correction as appropriate.
Fig. 5
Fig. 5. The dynamic changes of different memory T cell subsets in PBMCs after vaccination.
Prepared PBMCs were utilized to analyze the phenotypic changes in CD4 and CD8 T cells at 0, 14, and 28 dpv. (a) Representative dot plots of CD27 and CD8α expression on CD4 T cells in PBMCs from different groups at 0, 14, and 28 dpv. The values in the quadrants indicate the percentages of each CD4 T cell subset, with red-shaded areas depicting the percentage of CD4 TEM cells. Dynamic changes of CD4 TEM cells (b), CD8 TEM cells (c), and CD8 TEMRA cells (d) in PBMCs from different groups. Groups are color-coded: Mock in tangerine, G1 in green, G2 in mustard, G3 in blue, and G4 in purple. Gray symbols indicate individual samples, connected by gray lines. Color-coded bold lines represent the mean at each time point. Statistical significance of different groups at each time point was determined using an unpaired two-tailed t-test with Welch’s correction as appropriate and is shown as “Intergroup Comparison” on the top panel, color-coded based on the groups compared. 0.05 ≤ P values < 0.1 are shown as bold; P values < 0.05 are indicated by bold underline; P values < 0.001 are denoted as 0.000. Asterisks indicate significant intragroup differences between points in time (*P < 0.05, **P < 0.01, ***P < 0.001) as detected by paired t-tests.
Fig. 6
Fig. 6. The protective efficacy of different vaccines against PCV2d challenge.
After the challenge, rectal temperature was measured daily, body weight was monitored at 0, 7, and 14 dpc, and viremia, viral shedding, and viral load of tissues were determined by detecting PCV2 DNA. Rectal temperature (a), average daily weight gain (b), viremia (c), fecal viral shedding (d), nasal viral shedding (e), and viral load of tissues (f) in distinct groups after the PCV2d challenge. Rectal temperatures are shown as means ± standard deviation (error bars), and above 40 °C (indicated by dashed line) are defined as fever. The average daily weight gain (ADWG) of individual animals is expressed as a color-coded symbol with midline and bars indicating means ± standard deviation. In (ce), symbols represent the mean, the vertical bars indicate ± one standard deviation, and the numbers on the top of the error bar depict the percentage of positives in the PCV2d group at different time points. Data in (f) is expressed as per (b). Asterisks in (b, f) denote significant differences (*P < 0.05, ***P < 0.001) between the indicated groups, as determined by an unpaired two-tailed t-test with Welch’s correction as appropriate.
Fig. 7
Fig. 7. The proliferation levels of different T cell subsets from PBMCs at 14 dpc.
PBMCs were isolated at 14 dpc to evaluate Ki-67 expression in different T cell subsets. a Representative dot plots of CD27 and CD8α expression on Ki-67+ CD4 T cells (left), and CD27 and CD45RA expression on Ki-67+ CD8 T cells (right) in PBMCs of each group at 14 dpc. Numbers in quadrants indicate the percentage of cells. Red-shaded and green-shaded areas depict the percentage of effector memory cells and terminally differentiated effector memory cells, respectively. b Comparison of the Ki-67 expression in CD4 T cells among groups at 14 dpc. c Comparison of the Ki-67 expression in CD4 TN cells, CD4 TCM cells, and CD4 TEM cells among groups at 14 dpc. d Comparison of the Ki-67 expression in CD8 T cells across groups at 14 dpc. e Comparison of the Ki-67 expression in CD8 TN cells, CD8 TCM cells, CD8 TEM cells, and CD8 TEMRA cells across groups at 14 dpc. Each colored symbol represents an individual animal; horizontal lines show the mean; error bars indicate standard deviation (SD). Asterisks denote statistically significant differences (*P < 0.05, **P < 0.01, ***P < 0.001) between the specified groups, as determined by an unpaired two-tailed t-test with Welch’s correction applied when appropriate.
Fig. 8
Fig. 8. PCV2-ORF2-specific T-cell cytokine response in PBMCs after the PCV2d challenge.
The IFNγ-ELISPOT and intracellular cytokine staining assays were used to evaluate PCV2-ORF2-specific T-cell cytokine response in PBMCs after the PCV2d challenge. a Dynamic changes of the PCV2-ORF2-specific IFNγ-SC in PBMCs among all groups post-challenge. b Representative images of ELISPOT wells from each group at 7, 14 dpc. Comparison of single-, double-, or triple-positive cytokine responses in CD4 T cells (c) and CD8 T cells (d) at 14 dpc among groups. All data were background subtracted. The dotted black line indicates the limit of detection (LOD). Responders (top row) depict the number of pigs with positive responses. In (a), the thick color-coded lines show the group mean at each time point post-challenge and gray symbols represent individual animals with gray lines connecting identical animals. In (c, d), data are expressed as means ± SD with one symbol indicating one pig. Asterisks in (c, d) represent significant differences (*P < 0.05) between indicated groups, while “Intergroup Comparison” (bold: P < 0.01, bold and underlined: P < 0.05) on the top panel of (a) indicate the intergroup difference at different time points and are color-coded as follows: Mock (tangerine), PCV2d (red), G1 (green), G2 (mustard), G3 (blue), and G4 (purple). The statistical significance of data was analyzed using unpaired two-tailed t-tests with Welch’s correction when indicated.
Fig. 9
Fig. 9. PCV2-ORF2-specific T-cell cytokine response in tissues at necropsy.
The IFNγ-ELISPOT and intracellular cytokine staining assays were performed to assess PCV2-ORF2-specific T-cell cytokine response in the spleen and inguinal lymph node (ILN). a Representative images of ELISPOT wells in the spleen and ILN from each group. b PCV2-ORF2-specific IFNγ-SC responses in the spleen and ILN across groups. c Representative dot plots for IFNγ/TNFα/IL-2 triple-positive CD4 and CD8 T cells in the spleen from distinct groups. Comparison of single-, double-, or triple-positive cytokine responses in splenic CD4 T cells (d) and CD8 T cells (e) across groups. Colored dots represent background-subtracted data from individuals; horizontal lines display means; error bars indicate standard deviations. The dotted black line denotes the limit of detection (LOD). Responders (top row) show the number of pigs with positive responses. Asterisks denote significant differences (*P < 0.05, **P < 0.01) between the indicated groups as determined by an unpaired two-tailed t-test with Welch’s correction as appropriate.

References

    1. Meng, X.-J. Porcine circovirus type 2 (PCV2): pathogenesis and interaction with the immune system. Annu. Rev. Anim. Biosci.1, 43–64 (2013). - PubMed
    1. Opriessnig, T. & Halbur, P. G. Concurrent infections are important for expression of porcine circovirus associated disease. Virus Res.164, 20–32 (2012). - PMC - PubMed
    1. Segalés, J. Porcine circovirus type 2 (PCV2) infections: clinical signs, pathology and laboratory diagnosis. Virus Res.164, 10–19 (2012). - PubMed
    1. Ouyang, T., Zhang, X., Liu, X. & Ren, L. Co-Infection of Swine with Porcine Circovirus Type 2 and Other Swine Viruses. Viruses11, 10.3390/v11020185 (2019). - PMC - PubMed
    1. Guo, J. et al. Porcine Circovirus Type 2 Vaccines: Commercial Application and Research Advances. Viruses14, 10.3390/v14092005 (2022). - PMC - PubMed

LinkOut - more resources