. 2025 May 10;16(1):4363.
doi: 10.1038/s41467-025-59471-1.

Designer artificial environments for membrane protein synthesis

Affiliations

Designer artificial environments for membrane protein synthesis

Conary Meyer et al. Nat Commun. .

Abstract

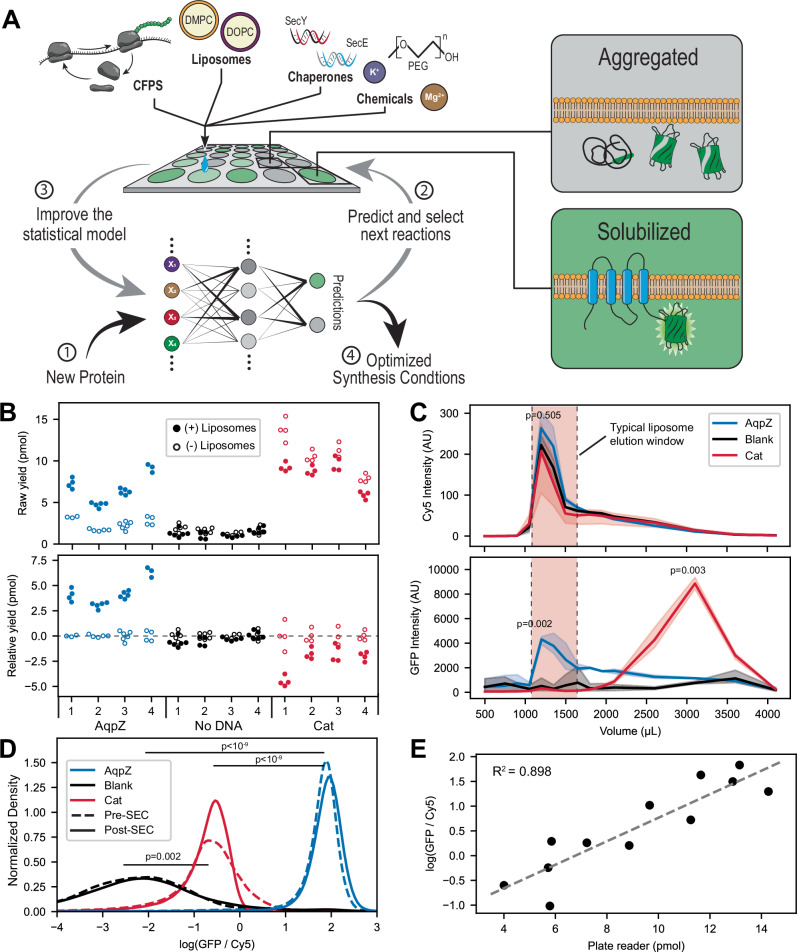
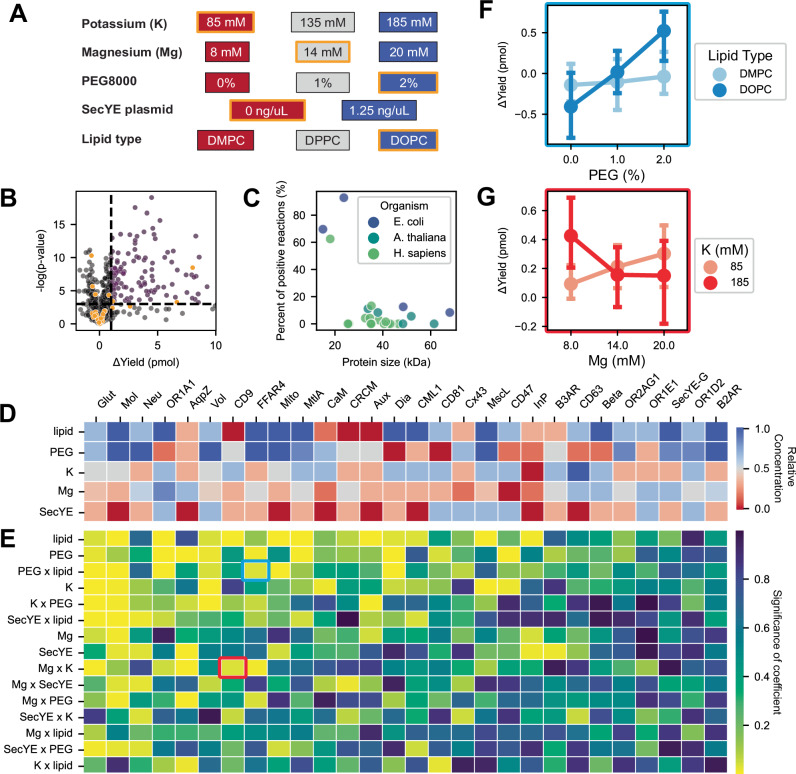
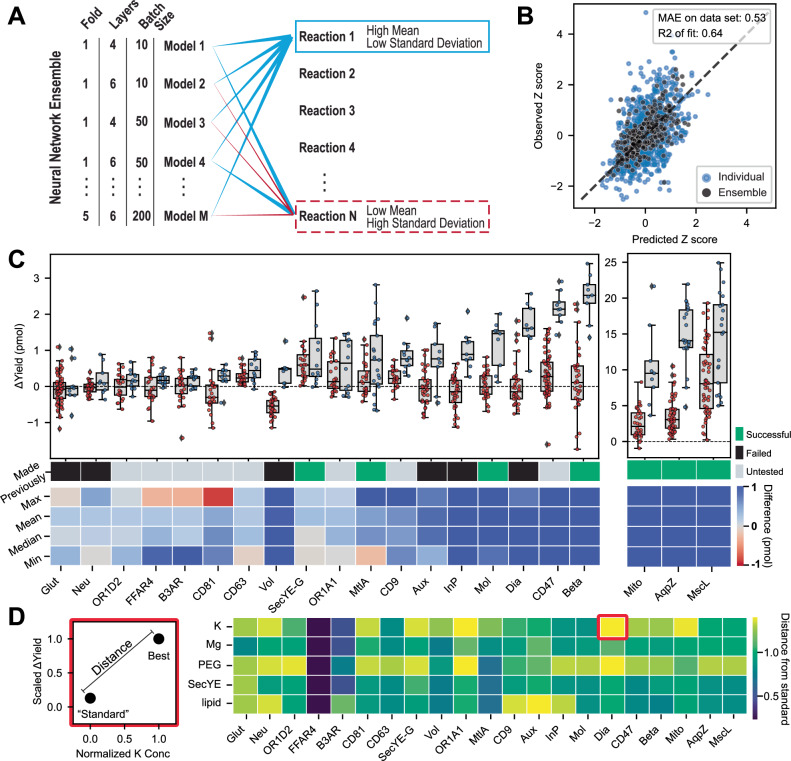
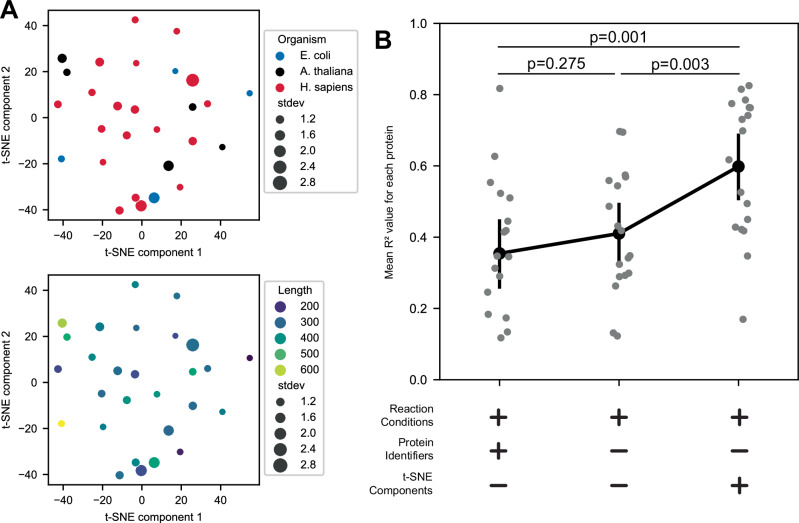
Protein synthesis in natural cells involves intricate interactions between chemical environments, protein-protein interactions, and protein machinery. Replicating such interactions in artificial and cell-free environments can control the precision of protein synthesis, elucidate complex cellular mechanisms, create synthetic cells, and discover new therapeutics. Yet, creating artificial synthesis environments, particularly for membrane proteins, is challenging due to the poorly defined chemical-protein-lipid interactions. Here, we introduce MEMPLEX (Membrane Protein Learning and Expression), which utilizes machine learning and a fluorescent reporter to rapidly design artificial synthesis environments of membrane proteins. MEMPLEX generates over 20,000 different artificial chemical-protein environments spanning 28 membrane proteins. It captures the interdependent impact of lipid types, chemical environments, chaperone proteins, and protein structures on membrane protein synthesis. As a result, MEMPLEX creates new artificial environments that successfully synthesize membrane proteins of broad interest but previously intractable. In addition, we identify a quantitative metric, based on the hydrophobicity of the membrane-contacting amino acids, that predicts membrane protein synthesis in artificial environments. Our work allows others to rapidly study and resolve the "dark" proteome using predictive generation of artificial chemical-protein environments. Furthermore, the results represent a new frontier in artificial intelligence-guided approaches to creating synthetic environments for protein synthesis.


Conflict of interest statement

Competing interests: The authors declare no competing interests.

Figures

Fig. 1
Fig. 1. Established MEMPLEX (Membrane Protein Learning and Expression) to design artificial environments for membrane protein synthesis.
A Schematic illustrating MEMPLEX. A custom droplet printer tests new proteins against varied conditions; solubilization is assessed by a split‐GFP reporter. Each condition has a control lacking liposomes to track the background from misfolded protein. The resulting data is used to train deep neural networks to select the highest-yielding reactions for the next round of experiments. B Only the membrane protein (AqpZ) shows an increase in fluorescence with liposome addition. Raw yields (top) and yields were corrected by subtracting the no‐liposome control (bottom) (Method 8). Filled circles: +liposomes; open circles: −liposomes. (n = 4–6). See Supplementary Table 1 for reaction conditions. C Size-Exclusion Chromatography (SEC) traces confirm only AqpZ co‐elutes with liposomes (Cy5‐labeled) (Method 13). Top panel: Liposome elution monitoring Cy5 signal from labeled lipids. Bottom panel: GFP elution monitoring GFP reporter bound to liposomes/membrane proteins. Red shaded area indicates the expected elution for liposomes. Blue line is AqpZ, Black line is no protein, and Red line is Cat. (n = 3 biological replicates, each with 3 technical replicates pooled for analysis. Data are shown as mean values +/- SEM. Overall differences were tested via one-way ANOVA. If ANOVA test was significant, pairwise comparisons were performed using Welch’s two-sided t-tests with Bonferroni correction.). D Comparison of the solubilized membrane protein signal (GFP) normalized by the liposome size (Cy5) from flow cytometry analysis of single liposomes. AqpZ-liposomes show higher ratios than samples producing Cat or no protein (Method 14). Kernel density plots show the distribution of the log(GFP/Cy5) values taken from events recorded during flow cytometry (Supplementary Fig. 6) (flow cytometry samples n = 3 biological replicates, 100,000 events recorded for each). Dashed lines represent samples prior to SEC, solid lines represent samples after SEC. (n = 3, p-values from a Tukey’s HSD post hoc test performed on median values per biological replicate, following a significant two-way ANOVA.). E Plate reader measurements show linear agreement with the normalized GFP signal observed in the flow cytometry sample (Method 14). (n = 12 biological replicates). Source data are provided as a Source Data file.
Fig. 2
Fig. 2. Chemical, lipid, and protein factors interact to determine optimal artificial synthesis environments of membrane proteins.
A Schematic of the initial screen’s search space. Lipid types were numerically encoded by carbon tail length, from DMPC (14 carbons, low) to DOPC (18 carbons, high). Orange-outlined boxes indicate the “standard” reaction composition. B Each dot compares the same reaction ± liposomes (n = 914). The vertical line (Δyield = 1 pmol) and horizontal line (p = 0.05 from two‐sided t‐tests) define successful synthesis. Orange points: standard condition; magenta points: yield ≥ 1 pmol and p < 0.05. (n = 914, 4 with liposome and 4 without liposomes each). C The low frequency of identifying a successful reaction composition for proteins >25 kDa supports the need for high throughput screening. A successful reaction composition was defined as having a p-value <0.05 and a mean difference of >1 pmol of protein. The number of reactions tested that were labeled as successful was divided by the total number tested for each protein (n ≥ 24 per protein, 4 with liposome and 4 without liposomes each). 8,296 unique cell-free reactions. D The optimal reaction compositions differ widely across proteins. The average concentration for each component across the top 3 performing reaction conditions was calculated for each protein. The color scale corresponds to the colors used in (A). (n = 8296). E Heat map of p‐values (ordinary least squares models) shows frequent interdependence among variables (n = 8296). Blue and red boxes correspond to panels (F) and (G). F FFAR4 requires specific lipid types (DMPC vs. DOPC) at varying PEG levels (n = 24). Error bars: 95% CI. G CD9 depends on potassium levels as magnesium changes (n = 24). Error bars: 95% CI. Source data are provided as a Source Data file.
Fig. 3
Fig. 3. Machine learning enables the rapid design of artificial environments to synthesize previously unattainable membrane proteins.
A Illustration of the ensemble-based active learning strategy. 45 different models were trained using: (1) different levels of model complexity (4, 5, or 6 hidden layers), (2) different batch sizes during training (10, 50, and 200) and (3) different train-test splits in the data to capture the data differently. These diverse models are then used to predict the yield of possible reaction conditions. The reactions with consistently high predicted values are selected over the reactions with low predicted values or high variance among predictions (Method 17). B The ensemble outperforms the individual model predictions when comparing the predicted to the observed Z-scored values (Method 17). Blue: individual model predictions, Black: average of all model predictions versus average of all observed values from a specific reaction composition. C Active learning results in higher synthesis yield of membrane proteins. The points represent the average of all biological replicates (n = 4) for a given reaction composition. All proteins in this plot show a statistically significant (two-sided t-test p-value < 0.05) difference between the screening (red dots) and active learning (light blue dots) reactions. Box plots illustrate the interquartile range (25th to 75th percentile), with the center line indicating the median, and the whiskers extending to minimum and maximum values. 7 proteins do not show a statistically significant change from the active learning (Supplementary Fig. 10). The bar immediately below the box plots indicates whether the protein has been reportedly attempted in previous works. Gray indicates it has not been reported, Black indicates it has been tried but was unsuccessful in cell-free protein synthesis using liposomes, Green indicates it was shown to be successful. The heat map indicates the changes (max, mean, min, and median) between the screening and active learning populations. >11,000 data points. D PEG and potassium result in the largest average increase in membrane-protein yield when comparing the standard vs. optimal synthesis conditions. The calculation of the Euclidean norm, (Yield)2+(Concentration)2, is shown in the left panel. Source data are provided as a Source Data file.
Fig. 4
Fig. 4. Cross-protein learning improves the prediction of optimal artificial environments for membrane-protein synthesis.
A t-SNE embedding capturing the proteins’ differential response to reaction conditions reveals no clear clustering of proteins. Each point represents the centroid of all individual model’s predictions for how a protein will respond to all assessed reaction conditions (Method 18). The size of the point represents the standard deviation between the model’s predictions for each protein. Top panel: colored by organism of origin. Bottom panel: colored by the length of the protein. B The inclusion of a protein’s location in the reaction condition embedding space yields improved prediction accuracy. Individual ensembles are trained using the specified input data, one where each protein is held out of the dataset and then predicted afterward. Proteins with no successful synthesis conditions were excluded. n = 16 proteins. Each data point represents the R² obtained by a given model on a particular protein. Statistical significance was evaluated using repeated‐measures ANOVA (with ‘Protein’ as the subject factor and ‘Model’ as the within‐subject factor). Where overall significance was detected, pairwise comparisons between models were conducted using two‐sided paired t‐tests with a Bonferroni correction. Error bars represent mean ± SEM. Source data are provided as a Source Data file.
Fig. 5
Fig. 5. Structural features predict successful membrane protein synthesis in artificial environments.
A Protein structures are decomposed into bins based on amino acid location relative to a simulated membrane (Method 20). Classification is based on the vertical position and whether an amino acid contacts lipids or is buried within the protein. Left panel: All possible layers are shown, with the shaded region indicating the membrane interior. Right panel: The protein is rotated 90° to display only amino acids within membrane layers; those in polar or water layers are labeled as part of the external shell. B Classifiers trained on tSNE embeddings of membrane-contacting amino acids achieved the highest accuracy (Method 21). Embeddings were generated using various feature combinations, and the maximum accuracy of each Ensemble Classifier is shown. Although all combinations were evaluated, only pairs of features are displayed to highlight the specific contributions of each feature. C The tested proteins are well dispersed among the other proteins in the dataset when plotted in one of the embedded spaces used in the top classifier. Red points indicate the proteins that were not successfully made. Blue indicates that they were made. The hue of the remaining points indicates the predicted probability of synthesis success using the top classifier. 4,612 membrane proteins. D All 10 paired classifiers with an accuracy >83%, show strong prediction agreement for proteins that are predicted to have a high likelihood of successful synthesis. The mean of the predictions is plotted versus the standard deviation of predictions. Hue indicates the average predicted label for each protein. Red points indicate the proteins that were not successfully made. Blue indicates that they were made. Purple indicates 3 additional proteins that were selected based on the predicted outcome, and all 3 passed the threshold to be considered successfully produced. 4612 membrane proteins were included in the full predicted set shown in this plot. Source data are provided as a Source Data file.

References

    1. Hedin, L. E., Illergård, K. & Elofsson, A. An introduction to membrane proteins. J. Proteome Res.10, 3324–3331 (2011). - PubMed
    1. Yang, Y., Hong, Y., Cho, E., Kim, G. B. & Kim, I.-S. Extracellular vesicles as a platform for membrane-associated therapeutic protein delivery. J. Extracell. Vesicles7, 1440131 (2018). - PMC - PubMed
    1. Love, J. et al. The New York consortium on membrane protein structure (NYCOMPS): a high-throughput platform for structural genomics of integral membrane proteins. J. Struct. Funct. Genomics11, 191–199 (2010). - PMC - PubMed
    1. Gessesse, B., Nagaike, T., Nagata, K., Shimizu, Y. & Ueda, T. G-Protein coupled receptor protein synthesis on a lipid bilayer using a reconstituted cell-free protein synthesis system. Life8, 54 (2018). - PMC - PubMed
    1. Henrich, E., Hein, C., Dötsch, V. & Bernhard, F. Membrane protein production in Escherichia coli cell-free lysates. FEBS Lett.589, 1713–1722 (2015). - PubMed

MeSH terms

Substances

LinkOut - more resources