. 2025 May 10;15(1):16341.
doi: 10.1038/s41598-025-01087-y.

NLRP3 inflammasome inhibits mitophagy during the progression of temporal lobe epilepsy

Affiliations

NLRP3 inflammasome inhibits mitophagy during the progression of temporal lobe epilepsy

Mengqian Wu et al. Sci Rep. .

Abstract

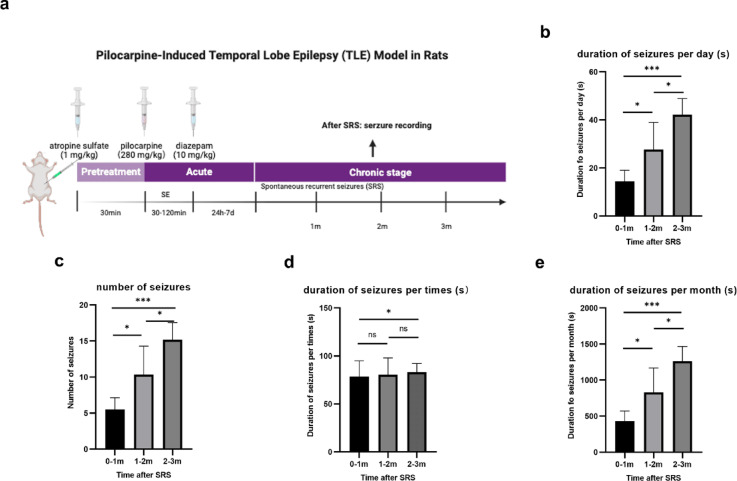
Epilepsy is a neurological disorder involving mitochondrial dysfunction and neuroinflammation. This study examines the relationship between NLRP3 inflammasome activation and mitophagy in the temporal lobe epilepsy, which has not been reported before. A pilocarpine-induced epileptic rat model was used to assess seizure activity and neuronal loss. Pyroptosis markers (NLRP3, cleaved Gasdermin D, IL-1β/IL-18), and autophagy/mitophagy activity (LC3B-II/I, BNIP3, TOMM20/LC3B colocalization) were analyzed via immunofluorescence, Western blot, and transmission electron microscopy. NLRP3 inhibitors and anti-IL-1β antibodies were administered to evaluate therapeutic effects. Epileptic rats exhibited progressive neuronal loss and seizure aggravation, correlating with NLRP3 inflammasome activation and pyroptosis. While general autophagy was upregulated, mitophagy was selectively impaired in the hippocampus. NLRP3 activation promoted IL-1β release, which suppressed mitophagy via PPTC7 upregulation. NLRP3 activation inhibitor (MCC950) and anti-IL-1β treatment restored mitophagy and reduced seizures. NLRP3 inflammasome-driven pyroptosis exacerbates epilepsy by impairing mitophagy activity via IL-1β/PPTC7. Targeted NLRP3 inhibition mitigates this cascade, offering a promising strategy for refractory epilepsy.

Keywords: Autophagy; Mitophagy; NLRP3 inflammasome; Pyroptosis; Temporal lobe epilepsy.


Conflict of interest statement

Declarations. Ethics approval: The animal study was approved by the Animal Ethics Committee of Fujian Provincial Hospital, and all experimental procedures were performed according to the National Institutes of Health Guide for the Care and Use of Laboratory Animals. The authors complied with the ARRIVE guidelines. Competing interests: The authors declare no competing interests.

Figures

Fig. 1
Fig. 1
Establishment of the pilocarpine-induced temporal lobe epilepsy rat model and comparison of rat epileptic behavioral results in different groups. (a) Pilocarpine-kindling progress. Following kindling, spontaneous recurrent seizures (SRS) were monitored for 3 months. Seizure activity was recorded and analyzed at three time points: 1, 2, and 3 months after SRS onset. Created on BioRender.com and licensed for publication. (b) Statistical results show that duration of seizures per day progressively increased (n = 6). (c) Statistical results show that total number of seizures per month progressively increased (n = 6). (d) Statistical results show that the duration of each seizure increased from the 0–1 month period to the 2–3 month period, while no significant difference was observed between the 1–2 month and 0–1 month periods, nor between the 1–2 month and 2–3 month periods (n = 6). (e) Statistical results show that total duration of seizures per month progressively increased (n = 6). Data are presented as means ± SEM (error bar) and compared using the two-sided Student’s t test; *P < 0.05; **P < 0.01; and ***P < 0.001; ns, no significance.
Fig. 2
Fig. 2
Activation of pyroptosis in the epileptic rat model and the effect of NLRP3 inflammasome inhibition on seizure activity. (a) Representative Hematoxylin and Eosin staining images of hippocampus and cortex in control group and EP group; Scale bar: 100 μm. (b) Representative immunofluorescence images of necroptosis marker (pMLKL, red), apoptosis marker (cleaved caspase3, green), pyroptosis markers (NLRP3, red; cleaved Gasdermin D, yellow; cleaved IL-1β, purple) and DAPI (blue) in the hippocampus of rats; Scale bar: 100 μm. (c) Fluorescence intensity of pMLKL, cleaved caspase-3, NLRP3, cleaved Gasdermin D and cleaved IL-1β in the hippocampus of rats (n = 3). (d,e) Total duration of seizures per month and total number of seizures per month in EP group and treatment groups (n = 3). The inhibitors MCC950 (1 mg/kg, iv, twice a week for 3 month, a NLRP3 activation inhibitor), GW806742X (0.2 mg/kg, iv, three times a week for 3 month, a necroptosis inhibitor), and zVAD-FMK (3 mg/kg, iv, twice a week for 3 month, a apoptosis inhibitor) were applied. (f,g) The level of IL-1β and IL-18 in the hippocampus of rats detected by ELISA (n = 3). EP group: the epileptic model rat group; 1 m, 2 m, and 3 m represent at 1, 2, and 3 months after the onset of spontaneous recurrent seizures, respectively. Unless specified otherwise, the data are presented as means ± SEM (error bar) and compared using the two-sided Student’s t test; *P < 0.05; **P < 0.01; and ***P < 0.001; ns, no significance.
Fig. 3
Fig. 3
NLRP3 inflammasome-induced pyroptosis activation in pilocarpine-induced epileptic rats. (a) Western blot analysis of NLRP3, cleaved IL-1β, pro IL-1β, Gasdermin D-NT, cleaved caspase-1 in the hippocampus and temporal lobe cortex of the control group and epileptic (EP) rat group. The gels of different group (Hippocampus group and cortex group) were not cropped in the same gel. (b) Immunofluorescence staining of NLRP3 and IL-1β in the hippocampus and temporal lobe cortex showed increased fluorescence intensity in the EP group. Scale bar for fluorescence images: 100 μm. Unless specified otherwise, the data are presented as means ± SEM (error bar) and compared using the two-sided Student’s t test; * p < 0.05, ** p < 0.01, *** p < 0.001, **** p < 0.0001.
Fig. 4
Fig. 4
Activation of general autophagy in the pilocarpine-induced epileptic rat model. (a) Western blot analysis of LC3B-II/I and p62 proteins in the hippocampus and temporal lobe cortex of the control group and epileptic (EP) rat group. The gels of different group (Hippocampus group and cortex group) were not cropped in the same gel. (b) Ralative RNA level of Beclin1, ATG5, ATG7, ATG12 in the hippocampus and temporal lobe cortex of the control group and epileptic (EP) rat group group (n = 3). (c) Immunofluorescence staining of LC3B and p62 in the hippocampus and temporal lobe cortex. Scale bar for fluorescence images: 100 μm. Unless specified otherwise, the data are presented as means ± SEM (error bar) and compared using the two-sided Student’s t test; * p < 0.05, ** p < 0.01, *** p < 0.001, **** p < 0.0001.
Fig. 5
Fig. 5
NLRP3 inflammasome activation inhibits mitophagy and modulates seizure activity in pilocarpine-induced epileptic rats. (a) The hippocampus and temporal lobe cortex of rats were double immunofluorescence stained for TOMM20-labeled mitochondria (green) and LC3B-labeled autophagosomes (red). Nuclei were stained with DAPI (blue). Enlarged views of areas within the white boxes are shown on the right. Scale bar: 50 μm. (b) Fluorescence intensity of LC3B in the hippocampus and temporal lobe cortex of rats (n = 3). (c) Colocalization fluorescence intensity of TOMM20 and LC3B in the hippocampus and temporal lobe cortex of rats (n = 3). (d) Representative transmission electron microscopy image of the temporal cortex and hippocampus showing varying degrees of mitochondrial damage (yellow arrows) in the rat. Green arrows indicate the occurrence of mitophagy in the epileptic (EP) group. Quantitative analysis revealed that damaged mitochondria in the hippocampus of the EP group were significantly higher than in the control group. (e) Number of seizures per month in EP group and treatment groups (n = 3). The inhibitors MCC950, anti-IL -1β were applied. (f) Western blot analysis of Gasdermin D-NT, BNIP3, TOMM20, and COX IV in the hippocampal mitochondria of the control group, EP group, and treatment group. (g) Relative RNA level of the mitophagy-inhibiting molecule PPTC7 in the control group, EP group, and treatment group (n = 3). Protein levels were quantified using Image J software. Unless specified otherwise, the data are presented as means ± SEM (error bar) and compared using the two-sided Student’s t test; *P < 0.05; **P < 0.01; and ***P < 0.001; ns, no significance.

Similar articles

Cited by

References

    1. Bejarano, E. & Rodriguez-Navarro, J. A. Autophagy and amino acid metabolism in the brain: implications for epilepsy. Amino Acids. 47, 2113–2126 (2015). - PubMed
    1. Giorgi, F. S., Biagioni, F., Lenzi, P., Frati, A. & Fornai, F. The role of autophagy in epileptogenesis and in epilepsy-induced neuronal alterations. J. Neural Transm (Vienna). 122, 849–862 (2015). - PubMed
    1. Cao, L. et al. Vitamin E inhibits activated chaperone-mediated autophagy in rats with status epilepticus. Neuroscience161, 73–77 (2009). - PubMed
    1. Dong, Y. et al. Ascorbic acid ameliorates seizures and brain damage in rats through inhibiting autophagy. - PubMed
    1. Ni, H., Gong, Y., Yan, J. Z. & Zhang, L. L. Autophagy inhibitor 3-methyladenine regulates the expression of LC3, Beclin-1 and ZnTs in rat cerebral cortex following recurrent neonatal seizures. World J. Emerg. Med.1, 216–223 (2010). - PMC - PubMed

MeSH terms

LinkOut - more resources