. 2025 May 10;8(1):728.
doi: 10.1038/s42003-025-08149-x.

Ubiquitin-activating enzyme1 (TgUAE1) acts as a key regulator of Toxoplasma gondii lytic cycle and homeostasis

Affiliations

Ubiquitin-activating enzyme1 (TgUAE1) acts as a key regulator of Toxoplasma gondii lytic cycle and homeostasis

Qi-Xin Zhou et al. Commun Biol. .

Abstract

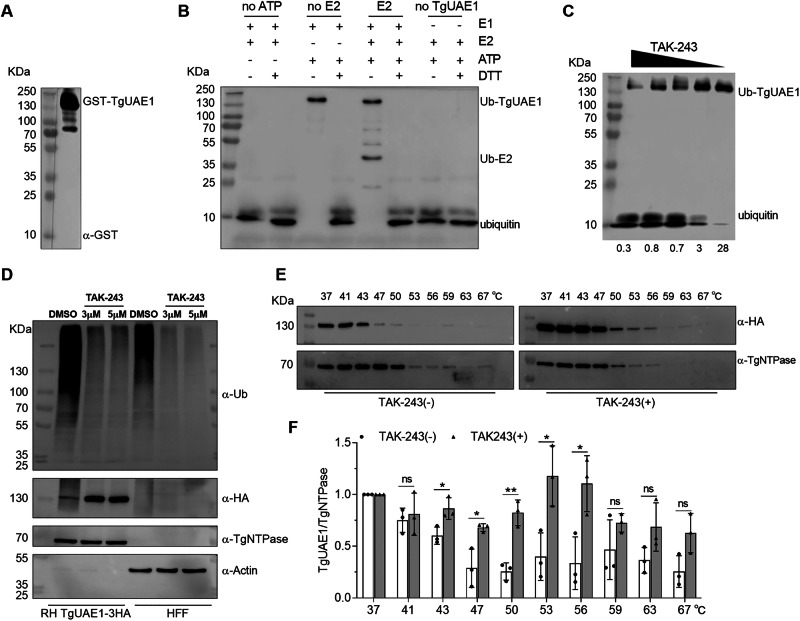
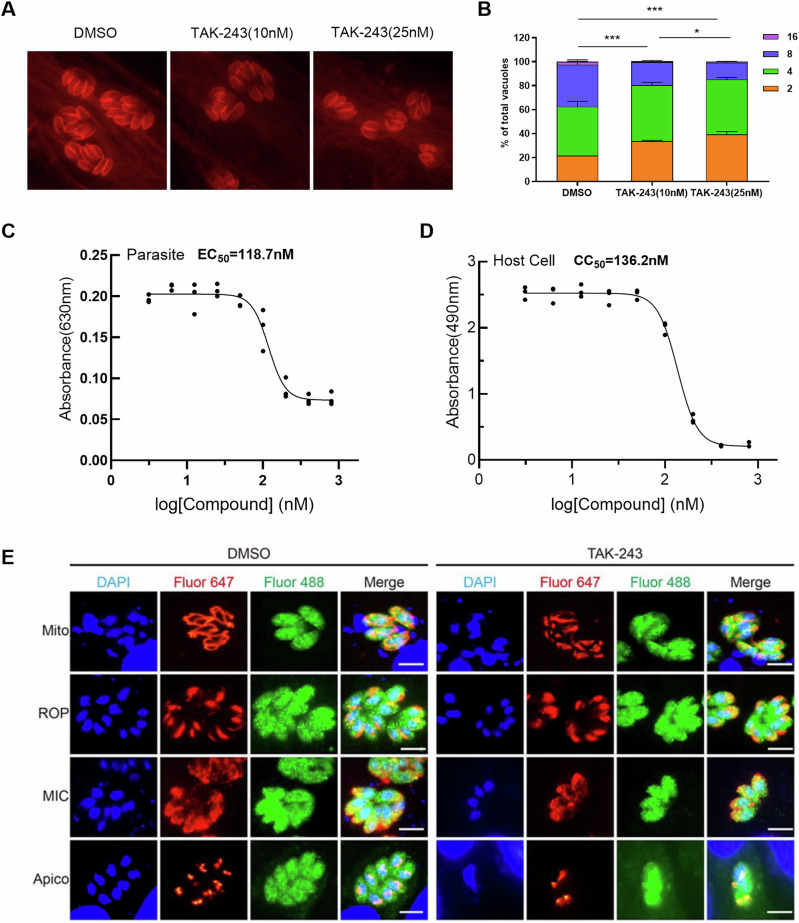
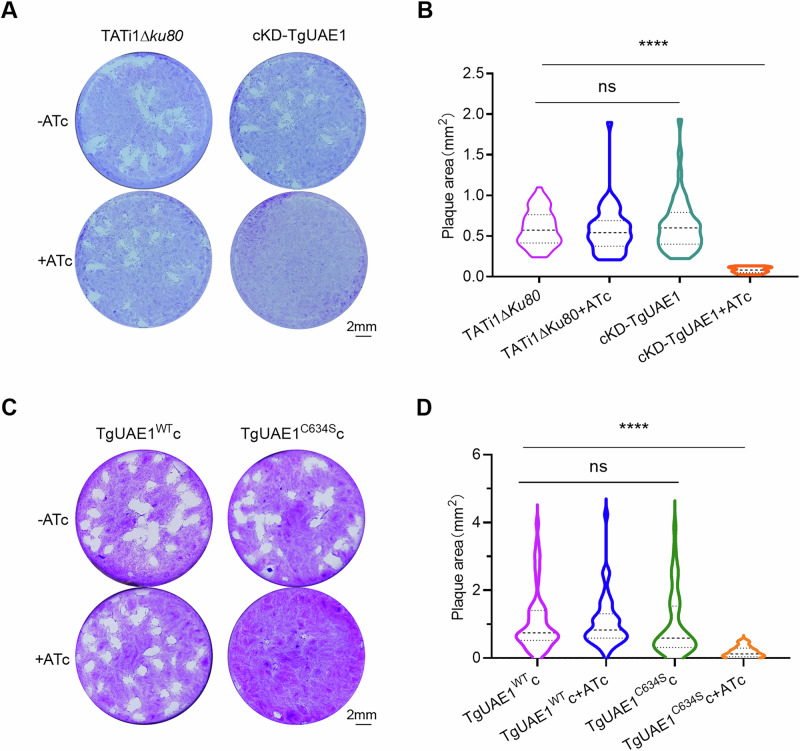
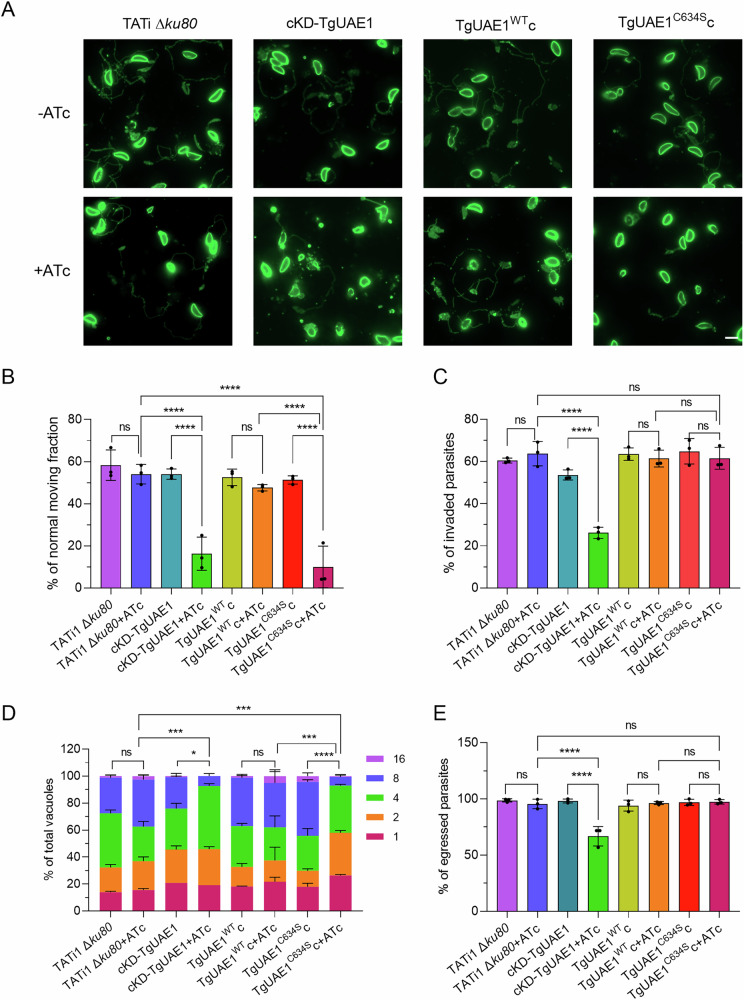
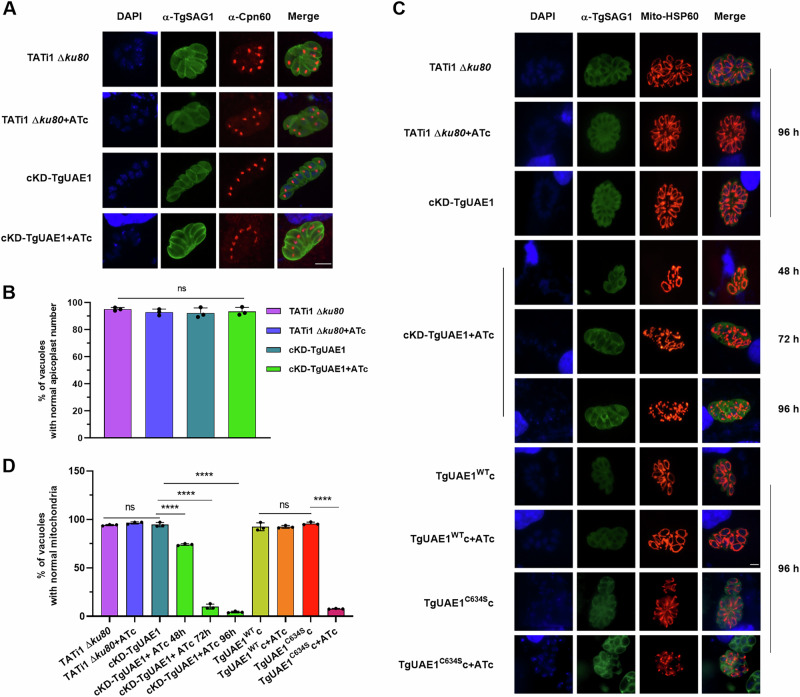
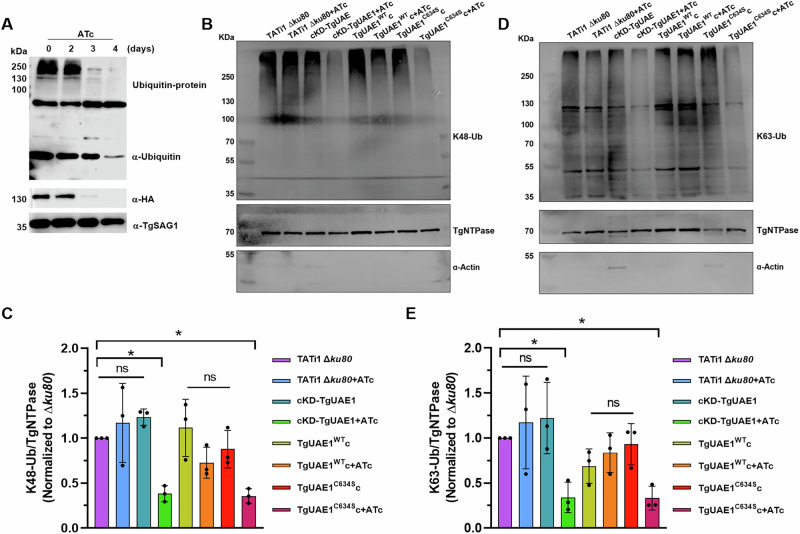
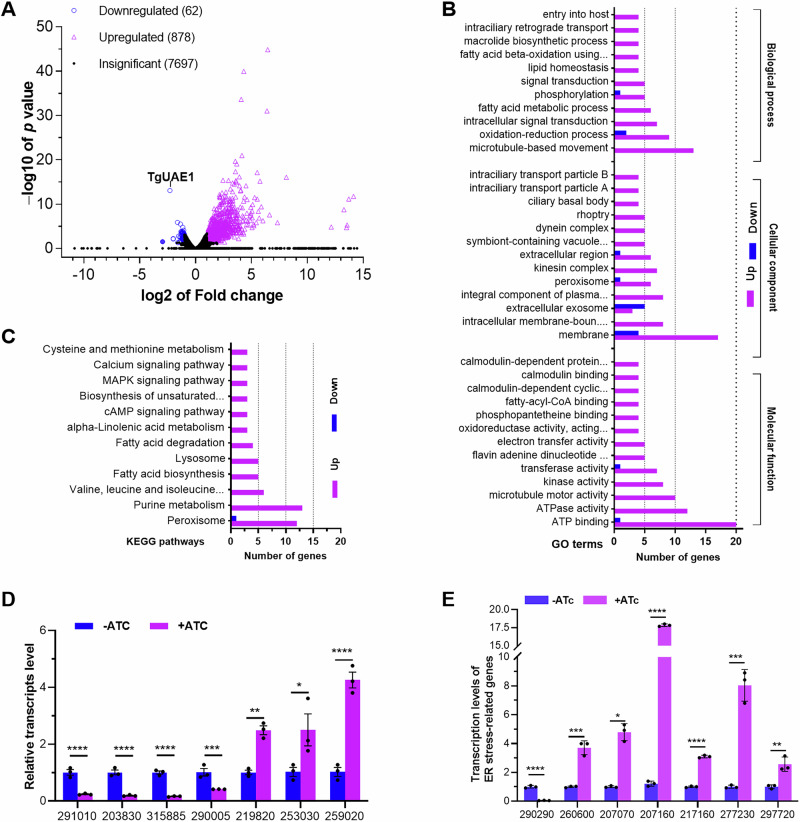
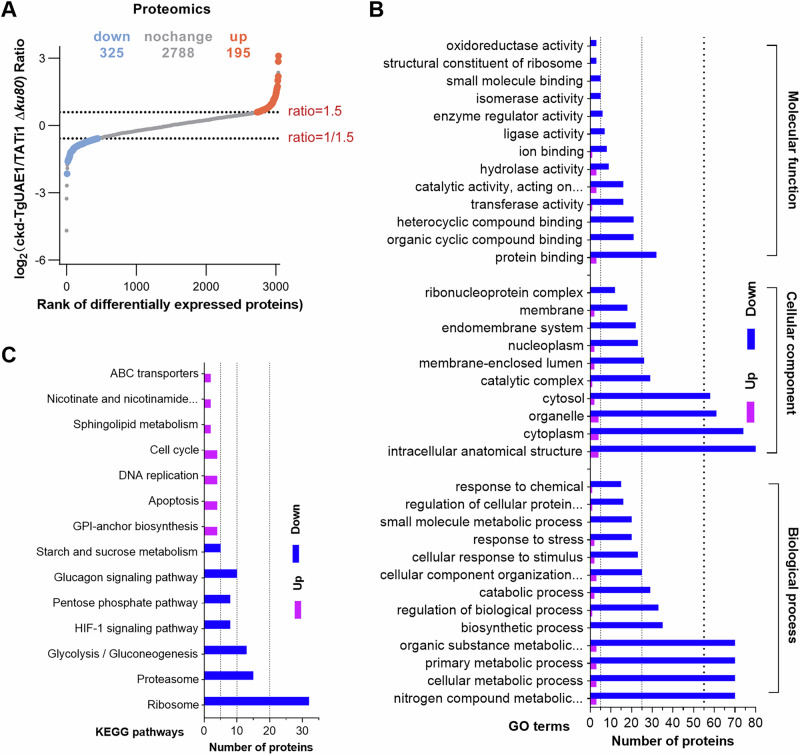
Ubiquitylation, regulated by the ubiquitin-proteasome system (UPS), is crucial for cell division and cycle transitions in Toxoplasma gondii. However, the primary E1 ubiquitin-activating enzyme (UAE1) in this process has been unclear. This study identified and characterized TGGT1_290290 (TgUAE1) as the canonical E1 enzyme in T. gondii. Through a combination of bioinformatics, biochemical, pharmacological, and genetic approaches, TgUAE1 was shown to exhibit typical E1 activity, particularly in forming K48- and K63-linked polyubiquitin chains. TAK-243, a UAE1 inhibitor, can effectively inhibit the ubiquitin pathway in T. gondii, as thermal stabilization experiments identified TgUAE1 as its intracellular target. Disruption of TgUAE1 severely impaired parasite homeostasis and suppressed the lytic cycle, highlighting its critical role in T. gondii fitness. Mutation of C634 in TgUAE1 confirmed that its enzymatic activity is essential for function. Transcriptomics and quantitative ubiquitin proteomics revealed TgUAE1 as a key regulator of the ubiquitination process and the broader gene expression network in T. gondii. These findings not only underscore the indispensable role of TgUAE1 in the life cycle of T. gondii but also offer valuable data that could inform future studies on parasite biology and the development of novel therapeutic strategies.


Conflict of interest statement

Competing interests: The authors declared no competing interests.

Figures

Fig. 1
Fig. 1. Protein sequence alignment and structural analysis of TgUAE1.
A The phylogenetic relationships of TgUAE1 homologs found in Homo sapiens, Saccharomyces cerevisiae, and Danio rerio. The T. gondii_TgUAE1 was bolded in the present study. The branch lengths are proportional to genetic distances, assessed using the neighbor-joining method in MEGA7 (http://www.megasoftware.net/). B The amino acid sequence of T. gondii UAE1 (TgUAE1) is compared to that of H. sapiens UAE1 (HsUba1) and S. cerevisiae UAE1 (ScUba1). The conserved cysteine catalytic site is marked by a red arrow, while the ubiquitin adenylation site is marked by a black arrow. The functional domain associated with the ubiquitin-activating enzyme E1 is indicated as FCCH.IAD.AAD.SCCH. C The structural conformation of the TgUAE1 protein was predicted using RaptorX software, which also generated a comprehensive binding diagram illustrating potential interactions with ubiquitin (Ub). Additionally, the presence of a ubiquitin fold domain (UFD) was identified. D PyMOL software was utilized to superimpose the structures of TgUAE1 and ScUba1 proteins for comparative analysis. Cys600 represents the cysteine catalytic site in ScUba1, whereas Cys634 corresponds to the cysteine catalytic site in TgUAE1.
Fig. 2
Fig. 2. Validation of ubiquitin-activating enzyme activity of TgUAE1 in vitro and in vivo.
A The purified GST-TgUAE1 protein was verified by WB using an anti-GST antibody. B The thioesterification activity of TgUAE1 was assessed using FLAG-labeled ubiquitin (Ub) and the transthioesterification to E2 (CDC34) in vitro. Thioesterification of E1 by Ub occurs in the absence of E2; in the presence of E2 (CDC34), further transthioesterification to E2 is observed. No thioester formation occurs without ATP or after treatment with DTT. C The covalent addition of ubiquitin to TgUAE1 in vitro is reduced with increasing concentrations of TAK-243. The concentrations of TAK-243 used were 0.3125 μM, 0.625 μM, 1.25 μM, 2.5 μM, and 5 μM (from left to right), the corresponding grayscale values for the Ub-TgUAE1 bands are shown beneath each lane. D The level of tachyzoite ubiquitylation in vivo was assessed in both TgUAE1-3HA strain and HFF cells treated with DMSO or TAK-243 (3 μM and 5 μM). WB was performed using anti-ubiquitin (α-Ub) antibody to detect global ubiquitylation. Anti-HA (α-HA) was used to detect TgUAE1-3HA, while α-TgNTPase and α-Actin were used as loading controls. E Thermal stability assays indicate that TgUAE1 stability is temperature-sensitive. In the absence of TAK-243, TgUAE1 protein stability decreases progressively with increasing temperatures (37 °C to 67 °C). In the presence of TAK-243, TgUAE1 stability is maintained at temperatures between 37 °C and 56 °C, but decreases at higher temperatures. TgNTPase was used as a loading control. F Quantification of the thermal stability of TgUAE1 using grayscale analysis. The ratio of TgUAE1 to TgNTPase intensity was plotted for each temperature condition. In the presence of TAK-243, TgUAE1 shows significantly higher stability compared to the absence of TAK-243 at temperatures between 43 °C and 56 °C (*p < 0.05, **p < 0.01). Statistical significance was determined using a t-test. Data represent mean ± SD from three independent experiments.
Fig. 3
Fig. 3. Impact of the UAE1-specific inhibitor TAK-243 on T.gondii.
A The presence of tachyzoites in host cells following a 24 h treatment with DMSO or TAK-243 (10 nM or 25 nM) was observed by IFA using an anti-TgSAG1 antibody. B The proportion of vacuoles containing different numbers of parasites relative to the total number of vacuoles was assessed following treatment with DMSO or TAK-243 (10 nM or 25 nM) for 24 h. Data are presented as means ± SD, and statistical significance was determined using a one-way ANOVA (*p < 0.05, ***p < 0.001). C The EC50 represents the concentration of TAK-243 required to achieve 50% inhibition of T. gondii proliferation. D Cytotoxicity of TAK-243 on HFFs, shown as a dose-response curve with a CC₅₀ value of 136.2 nM, measured by absorbance. E The impact of TAK-243 on the morphology of subcellular organelles in T. gondii was observed by IFA using specific antibodies against F1 beta ATPase (mitochondria), ROP1 (rhoptry), MIC3 (microneme), and Cpn60 (apicoplast). Alexa Fluor 647-labeled secondary antibodies indicated subcellular organelles in red fluorescence. Additionally, the localization of TgUAE1-3HA transgenic parasites was visualized using an anti-HA antibody and Alexa Fluor 488-labeled secondary antibody in green fluorescence (scale: 5 μm).
Fig. 4
Fig. 4. Effect of TgUAE1 on the growth of T. gondii.
A The plaque assay was performed by inoculating HFFs infected with the cKD-TgUAE1, compared to TATi1 ΔKu80, with or without ATc treatment for 7 d. Scale bar = 2 mm. B The statistical results of the plaque assay are presented as violin plots showing the distribution of plaque areas from three biological replicates. Statistical significance was analyzed using the Kruskal-Wallis test (ns p > 0.05, **** p < 0.0001). C The plaque assay was conducted by inoculating HFFs infected with the TgUAE1C634Sc mutant strain, compared to the TgUAE1WTc strain, with or without ATc treatment for 7 d. Scale bar = 2 mm. D The statistical results of the plaque assay are presented as violin plots showing the distribution of plaque areas from three biological replicates. Statistical significance was analyzed using the Kruskal-Wallis test (ns p > 0.05, ****p < 0.0001).
Fig. 5
Fig. 5. The effect of TgUAE1 on the lytic cycle in cKD-TgUAE1, TgUAE1WTc, and TgUAE1C634Sc lines compared to TATi1 ΔKu80 with or without ATc treatment.
A The effect of TgUAE1 on the gliding ability of T. gondii was examined using a fluorescence microscope with TgSAG1 antibody staining. Scale bar = 5 μm. B The gliding ability was determined by calculating the ratio of tachyzoites exhibiting slippage to the total number of parasites. Data are presented as means ± SD from three biological replicates, with at least 100 parasites per line counted. C The invasion percentage was determined by calculating the ratio of intracellular tachyzoites to the total number of parasites. Data are presented as means ± SD from three biological replicates, with at least 100 parasites per line counted. D The intracellular proliferation ability was assessed by determining the proportion of vacuoles containing different numbers of parasites relative to the total number of vacuoles. Data are presented as means ± SD from three biological replicates, with at least 100 vacuoles per line counted. E The egression percentage was determined by calculating the ratio of ruptured vacuoles to the at least 100 vacuoles. Data are presented as means ± SD from three biological replicates. Statistical significance was determined using a one-way ANOVA (ns p > 0.05, *p < 0.05, ***p < 0.001, ****p < 0.0001).
Fig. 6
Fig. 6. The effect of TgUAE1 on the morphology of subcellular organelle in T.gondii tachyzoites.
A The morphological changes of the apicoplast were observed by IFA using an antibody against α-Cpn60 (red) in TATi1 ΔKu80 and cKD-TgUAE1 parasites with or without ATc treatment for 96 h (scale: 5 μm). Parasites were also labeled with DAPI (blue) and α-TgSAG1 (green). B Statistical analysis showing the percentage of vacuoles with normal apicoplasts within parasitophorous vacuoles (PVs). Data are presented as means ± SD from three biological replicates, and statistical significance was determined using a one-way ANOVA (ns p > 0.05). C Mitochondrial morphological changes were observed by IFA in TATi1 ΔKu80, cKD-TgUAE1, TgUAE1WTc and TgUAE1C634Sc strains, with or without ATc treatment. A transiently transfected Mito-Hsp60-RFP plasmid (red) was used to label mitochondria, and parasites were stained with DAPI (blue) and an antibody against α-TgSAG1 (green). ATc treatment was applied for 48, 72, or 96 h, as indicated (scale: 5 μm). D Statistical analysis showing the proportion of vacuoles with normal mitochondria within PVs. Data are presented as means ± SD from three biological replicates, and statistical significance was determined using a one-way ANOVA (ns p > 0.05, ****p < 0.0001).
Fig. 7
Fig. 7. Effect of TgUAE1 on the ubiquitination modification in T. gondii.
A The ubiquitination level in the cKD-TgUAE1 strain under 0, 2, 3, or 4 days of ATc treatment was assessed by WB using an α-ubiquitin antibody. The expression of TgUAE1 protein was evaluated using an α-HA antibody, with an α-TgSAG1 antibody employed as an internal control. B The level of K48-linked ubiquitination in TATi1 ΔKu80, cKD-TgUAE1, TgUAE1WTc, and TgUAE1C634Sc parasite lines with or without ATc treatment were detected by WB using a K48-specific anti-ubiquitin antibody. TgNTPase served as the T. gondii internal control, and α-actin was used as the host HFF cell internal control. C Quantification of K48-linked ubiquitination relative to TgNTPase levels, normalized to the TATi1 ΔKu80 group. Data are presented as mean ± SD from three independent experiments. Statistical significance was determined using a one-way ANOVA (*p < 0.05, ns p > 0.05). D The level of K63-linked ubiquitination in TATi1 ΔKu80, cKD-TgUAE1, TgUAE1WTc, and TgUAE1C634Sc parasite lines with or without ATc treatment were detected by WB using a K63-specific anti-ubiquitin antibody. TgNTPase served as the T. gondii internal control, and α-actin was used as the host HFF cell internal control. E Quantification of K63-linked ubiquitination relative to TgNTPase levels, normalized to the TATi1 ΔKu80 group. Data are presented as mean ± SD from three independent experiments. Statistical significance was determined using a one-way ANOVA (*p < 0.05, ns p > 0.05).
Fig. 8
Fig. 8. Profound effect of TgUAE1 conditional knockdown on the genomic expression of T. gondii.
A Distributions of log2 R and q values for all genes identified in the transcriptomes generated from cKD-TgUAE1 strains treated with ATc or DMSO. Differentially expressed genes (DEGs) are those significantly downregulated (log2 R ≤ 1) or upregulated ((log2 R ≥ 1) with a level of q value < 0.05. Genes with –1 ≤ log2 R ≤ 1 or q ≥ 0.05 when log2 R ≤ –1 or ≥1 are considered insignificantly affected. B, C Counts of DEGs significantly enriched (p < 0.05) in three function classes (main GO terms shown) and the top 12 KEGG pathways. D RT-qPCR validation of seven randomly selected genes from the 940 DEGs. E The transcription levels of TgUAE1 (TGGT1_290290) and six genes with significant changes during ER stress were validated by RT-qPCR under treatment with ATc or DMSO. Data are presented as means ± SD from three biological replicates, and statistical significance was determined using a t test (*p < 0.05; ***p < 0.001; ****p < 0.0001).
Fig. 9
Fig. 9. Proteomic analysis of TgUAE1 conditional knockdown in T. gondii.
A The log2(cKD-TgUAE1/TATi1 Δku80) ratio for differentially expressed proteins. The plot shows 325 downregulated, 2788 unchanged, and 195 upregulated proteins. The dotted lines indicate the thresholds for proteins with a fold change greater than 1.5 (upregulated, red) or less than 1/1.5 (downregulated, blue). B GO term enrichment analysis of differentially expressed proteins, categorized into Molecular Function, Cellular Component, and Biological Process. The number of proteins enriched in each term is shown on the x-axis. C KEGG pathway enrichment analysis showing the significant pathways associated with the differentially expressed proteins.
Fig. 10
Fig. 10. Profound effect of TgUAE1 conditional knockdown on ubiquitination quantitative proteomics of T. gondii.
A The numbers of total proteins, ubiquitinated proteins, and ubiquitinated sites were determined and quantified in cKD-TgUAE1 compared with TATi1 ΔKu80 strain under ATc treatment. B The numbers of differentially ubiquitinated proteins and protein sites quantified between cKD-TgUAE1 and TATi1 ΔKu80 strain under ATc treatment. C GO term enrichment analysis showing the biological processes and molecular functions associated with differentially expressed ubiquitinated proteins. The bar chart displays the number of proteins enriched in the respective GO terms, where blue indicates downregulated proteins and purple indicates upregulated protein. D The counts of differentially ubiquitinated proteins significantly enriched in KEGG pathways.

References

    1. Dubey, J. P. Toxoplasmosis of Animals and Humans. (Toxoplasmosis of Animals and Humans, 2016).
    1. Gao, J. M. et al. Genetic analyses of Chinese isolates of Toxoplasma gondii reveal a new genotype with high virulence to murine hosts. Vet. Parasitol.241, 52–60 (2017). - PubMed
    1. Dubey, J. P. Toxoplasmosis in pigs-The last 20 years. Vet. Parasitol.164, 89–103 (2009). - PubMed
    1. Neville, A. J. et al. Clinically available medicines demonstrating anti-Toxoplasma activity. Antimicrob. Agents Ch59, 7161–7169 (2015). - PMC - PubMed
    1. Ben-Harari, R. R., Goodwin, E. & Casoy, J. Adverse event profile of pyrimethamine-based therapy in Toxoplasmosis: A Systematic Review. Drugs RD17, 523–544 (2017). - PMC - PubMed

LinkOut - more resources