. 2025 May 10;8(1):141.
doi: 10.1038/s42004-025-01531-0.

Recombinant Protein Spectral Library (rPSL) DIA-MS method improves identification and quantification of low-abundance cancer-associated and kynurenine pathway proteins

Affiliations

Recombinant Protein Spectral Library (rPSL) DIA-MS method improves identification and quantification of low-abundance cancer-associated and kynurenine pathway proteins

Shivani Krishnamurthy et al. Commun Chem. .

Abstract

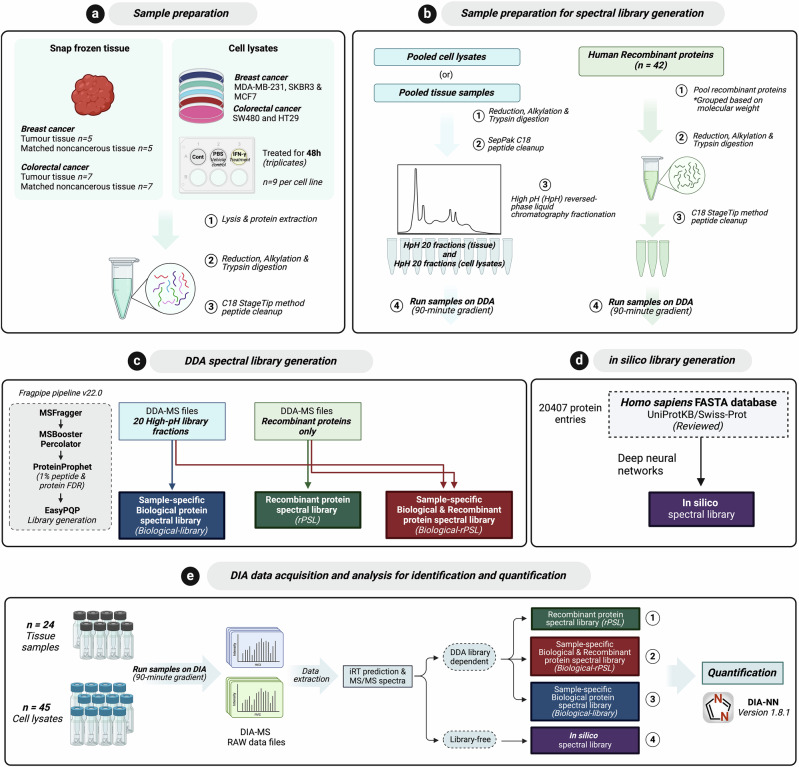
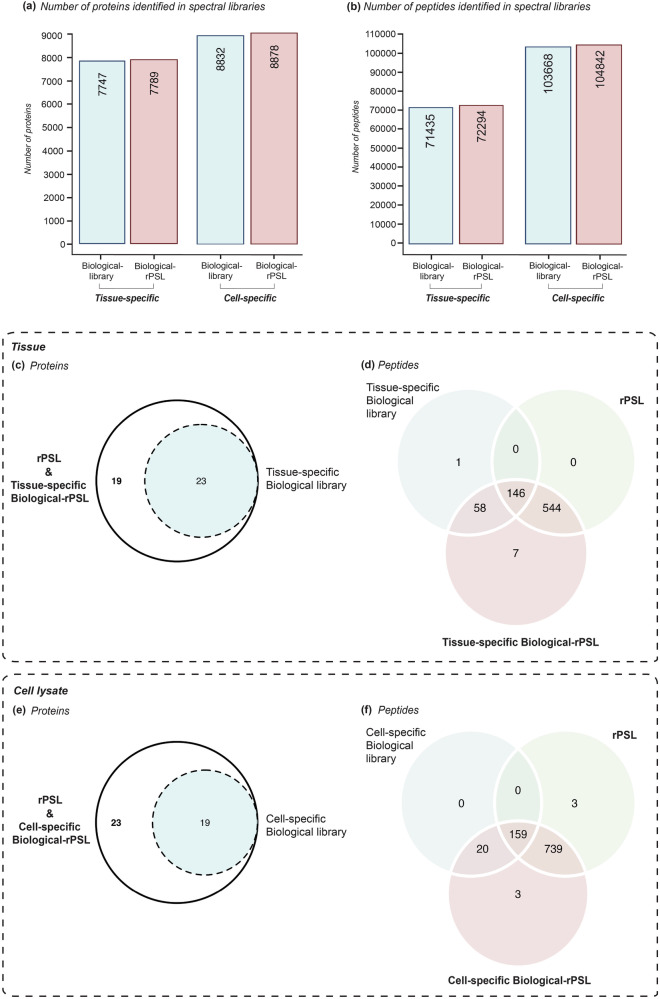
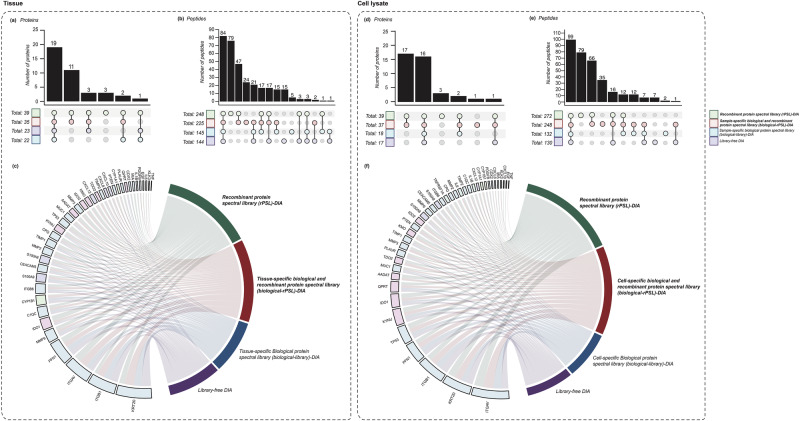
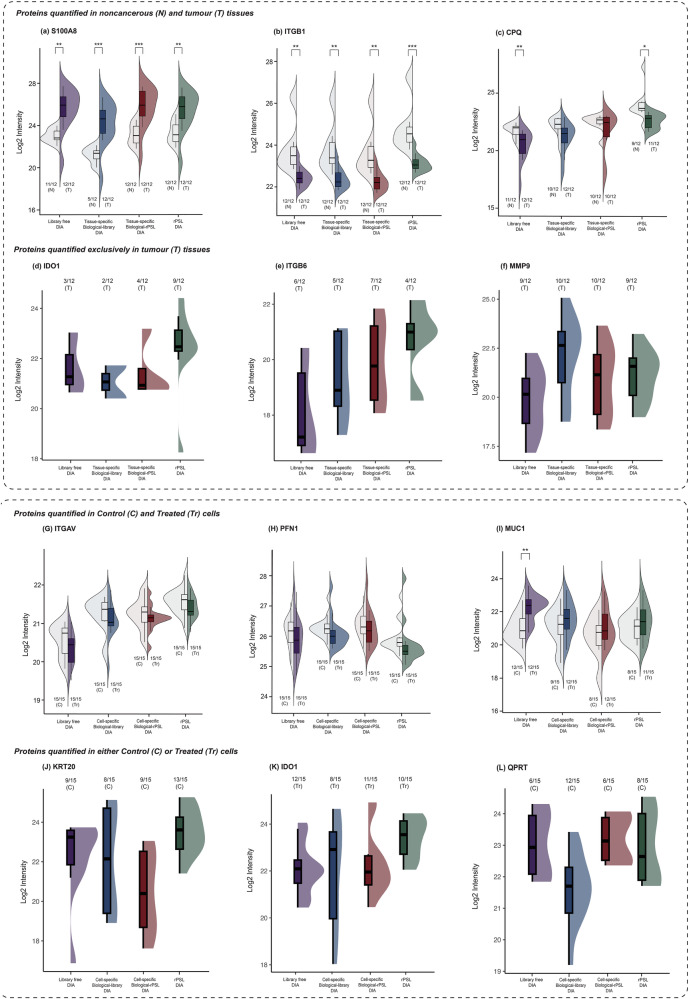
Data-independent acquisition mass spectrometry (DIA-MS) is a powerful tool for quantitative proteomics, but a well-constructed reference spectral library is crucial to optimize DIA analysis, particularly for low-abundance proteins. In this study, we evaluate the efficacy of a recombinant protein spectral library (rPSL), generated from tryptic digestion of 42 human recombinant proteins, in enhancing the detection and quantification of lower-abundance cancer-associated proteins. Additionally, we generated a combined sample-specific biological-rPSL by integrating the rPSL with a spectral library derived from pooled biological samples. We compared the performance of these libraries for DIA data extraction with standard methods, including sample-specific biological spectral library and library-free DIA methods. Our specific focus was on quantifying cancer-associated proteins, including key enzymes involved in kynurenine pathway, across patient-derived tissues and cell lines. Both rPSL and biological-rPSL-DIA approaches provided significantly improved coverage of lower-abundance proteins, enhancing sensitivity and more consistent protein quantification across matched tumour and adjacent noncancerous tissues from breast and colorectal cancer patients and in cancer cell lines. Overall, our study demonstrates that rPSL and biological-rPSL coupled with DIA-MS workflows, can address the limitations of both biological library-based and library-free DIA methods, offering a robust approach for quantifying low-abundance cancer-associated proteins in complex biological samples.


Conflict of interest statement

Competing interests: The authors declare no competing interests.

Figures

Fig. 1
Fig. 1. Experimental workflow.
a Sample preparation: Frozen human breast (n = 5) and colorectal cancer tissues (n = 7), along with matched noncancerous tissues, were used for tissue experiments. For the cell lysate experiments, five cancer cell lines were included, and cells were treated with IFN-γ and PBS (Vehicle control) in triplicates and lysates were collected after 48 h. Proteins were reduced, alkylated, trypsin-digested, and peptides were cleaned using C18 StageTips. b Sample preparation for spectral library generation: Pooled cell lysates or tissues were fractionated into 20 fractions using high-pH reversed-phase chromatography. Human Recombinant proteins (n = 42) were grouped based on molecular weight and digested with trypsin. All samples were acquired via DDA for spectral library generation. c DDA spectral library generation: Fragpipe v22.0 was used to generate three spectral libraries 1.sample-specific biological protein spectral library (biological-library) from 20 fractions 2. recombinant protein spectral library (rPSL) from 42 recombinant proteins, and 3. sample-specific biological and recombinant spectral library (biological-rPSL) combining both datasets. d In silico library generation: An in silico spectral library was generated from the Homo sapiens FASTA database (UP000005640, UniProtKB/Swiss-Prot) using deep learning (e) DIA-MS data acquisition and analysis: DIA-MS was performed on 24 tissue samples and 45 cell lysates. DIA-NN software (version 1.8.1) was used for DIA-MS data extraction across four workflows: library-dependent analysis using rPSL, sample-specific biological-rPSL and sample-specific biological-library and library-free analysis using an in silico spectral library.
Fig. 2
Fig. 2. Overview of proteins and peptides identified in recombinant protein spectral library (rPSL), sample-specific biological and recombinant protein spectral library (biological-rPSL), and sample-specific biological protein spectral library (biological-library).
Total number of (a) proteins and (b) peptides identified across three DDA spectral libraries. Venn diagrams illustrate the identifications and overlap of proteins and peptides between the three DDA spectral libraries. Number of identified proteins (c) and peptides (d) in tissue samples. 19 proteins were exclusively identified in the rPSL and biological-rPSL, while 23 proteins were shared between the biological library and rPSL/biological-rPSL. The number of peptides improved by 544 in the rPSL, with an additional 7 peptides unique to the biological-rPSL, resulting in a total improvement of 551 peptides in this biological-rPSL. Number of identified proteins (e) and peptides (f) in cell lysates. 23 proteins were uniquely identified by the rPSL/biological-rPSL, while 19 proteins were shared between the biological library and rPSL/biological-rPSL. For peptides, an additional 742 peptides were identified in the rPSL and biological-rPSL, with an overlap of 159 peptides identified in all three spectral libraries.
Fig. 3
Fig. 3. Comparison of quantified proteins and peptides (for the 42 proteins) across recombinant protein spectral library (rPSL), sample-specific biological and recombinant spectral library (biological-rPSL), sample-specific biological protein spectral library (biological-library) and library-free DIA-MS analysis in human tissues and cell lysates.
Number of detected proteins (a) and (d) and peptides (b) and (e) in tissues and cell lysates across the four DIA-MS approaches, with overlaps visualized in UpSet plots. A total of 19 proteins and 84 peptides were consistently quantified across all four approaches, with a significant increase in peptide detection using the rPSL and biological-rPSL methods for the tissue experiment. 16 proteins and 99 peptides were consistently quantified using all four methods, with rPSL and biological-rPSL again demonstrating enhanced peptide detection compared to biological-library and library-free DIA approaches. c and f Circos plot shows proteins detected by each method in tissues and cell lysates, with links schematically representing the number of peptides identified per protein. The rPSL and biological-rPSL based DIA-MS analysis yielded enhanced peptide quantification compared to the other methods for lower-abundance proteins.
Fig. 4
Fig. 4. Quantitative performance comparison across library-free DIA, biological-library DIA, biological-recombinant spectral library (biological-rPSL) DIA, and recombinant PSL (rPSL) DIA methods.
ac and (GI) The split violin with overlaid box plots represent the distribution of log2 transformed protein intensities between two experiment groups, with statistical significance of the differences indicated by asterisks (Welch’s t-test; *p < 0.05, **p < 0.01, ***p < 0.001, ****p < 0.0001) in tissues and cell lysates. In the box plots, the center line represents the median, the box limits indicate the upper and lower quartiles. Proteins (a) S100A8, (b) ITGB1 and (c) CPQ were quantified in both noncancerous (N) and tumour tissues (T), with (n = 12) per group. Proteins (G) ITGAV, (H) PFN1 and (I) MUC1 were quantified in control (C) and treated (Tr) cells with (n = 15) per group. The numbers at the bottom indicate number of samples out of the total n per group, in which the protein was detected. df and (JL) highlight proteins exclusively quantified in tumour tissues and either control or treated cells, with half violins with overlaid box plots representing the protein intensities and distribution of the data for proteins (d) IDO1, (e) ITGB6, and (f) MMP9 across tumour samples only and (J) KRT20, (K) IDO1, and (L) QPRT across either control or treated cells only.
Fig. 5
Fig. 5. Differential protein expression analysis in matched breast and colorectal cancer tissue samples using the tissue-specific biological and recombinant spectral library (biological-rPSL) DIA-MS approach.
The dot plot illustrates the log2 transformed fold change ratio measured for each protein in tumour tissues as compared to its adjacent noncancerous tissue in (A) breast cancer and (B) colorectal cancer. Each row represents an individual paired sample. Breast cancer tissue samples were categorized by subtype: triple-negative (sample 1–2), HER+ (sample 3–4) and luminal B breast cancer (sample 5). Colorectal cancer tissue samples were grouped by disease stage: early-stage (samples 1–4) and late-stage (samples 5–7). The size and colour of the dots reflect the magnitude of change, where red indicates upregulation, blue indicates downregulation, grey denotes no change, and blank cells correspond to proteins not detected (ND). Fold change ratios for proteins exclusively expressed or absent in tumour tissues were calculated using a pseudo count of +1.
Fig. 6
Fig. 6. Differential protein expression analysis in breast and colorectal cancer cell lines treated with interferon-gamma (IFN-γ) using the cell-specific biological and recombinant spectral library (biological-rPSL) DIA-MS approach.
The heatmap visualizes the log2 transformed protein quantities measured in breast cancer cell lines (MDA-MB-231, SKBR3, MCF7) and colorectal cancer cell lines (HT-29, SW480). Protein abundance is compared between untreated control and IFN-γ-treated conditions. Each row represents the expression level of an individual protein, with values expressed as the mean log2 protein quantities calculated from triplicate experiments (n = 3). Blank cells represent proteins that were not detected (ND). Statistical significance of the differences in protein expression between control and IFN-γ-treated conditions was assessed using Welch’s t-test, with significance levels indicated by asterisks (*p < 0.05, **p < 0.01, ***p < 0.001, ****p < 0.0001).

Similar articles

References

    1. Ludwig, C. et al. Data-independent acquisition-based SWATH-MS for quantitative proteomics: a tutorial. Mol. Syst. Biol.14, e8126 (2018). - PMC - PubMed
    1. Searle, B. C. et al. Chromatogram libraries improve peptide detection and quantification by data independent acquisition mass spectrometry. Nat. Commun.9, 5128 (2018). - PMC - PubMed
    1. Tsou, C. C. et al. DIA-Umpire: comprehensive computational framework for data-independent acquisition proteomics. Nat. Methods12, 258–264 (2015). - PMC - PubMed
    1. Gessulat, S. et al. Prosit: proteome-wide prediction of peptide tandem mass spectra by deep learning. Nat. Methods16, 509–518 (2019). - PubMed
    1. Staes, A. et al. Benefit of in silico predicted spectral libraries in data-independent acquisition data analysis workflows. J. Proteome Res.23, 2078–2089 (2024). - PubMed

LinkOut - more resources