

The cost of the diagnostic odyssey of patients with suspected rare diseases
- PMID: 40349051
- PMCID: PMC12065212
- DOI: 10.1186/s13023-025-03751-y
The cost of the diagnostic odyssey of patients with suspected rare diseases
Abstract
Purpose: Patients with rare diseases often undergo a long diagnostic odyssey. However, there is little empirical evidence on the cost incurred during the diagnostic pathway for patients with suspected rare diseases. This study provides a comprehensive analysis of healthcare costs and utilization during the diagnostic pathway for a heterogeneous sample of patients with suspected rare diseases but unclear diagnosis.
Methods: Using claims data from five German statutory health insurance organizations for the years 2014-2019, we analyzed costs and healthcare utilization of 1,243 patients (aged 0 to 82 years) with suspected rare diseases referred to a rare disease center. A control cohort was assigned using 1:75 exact matching on age, sex and place of residence.
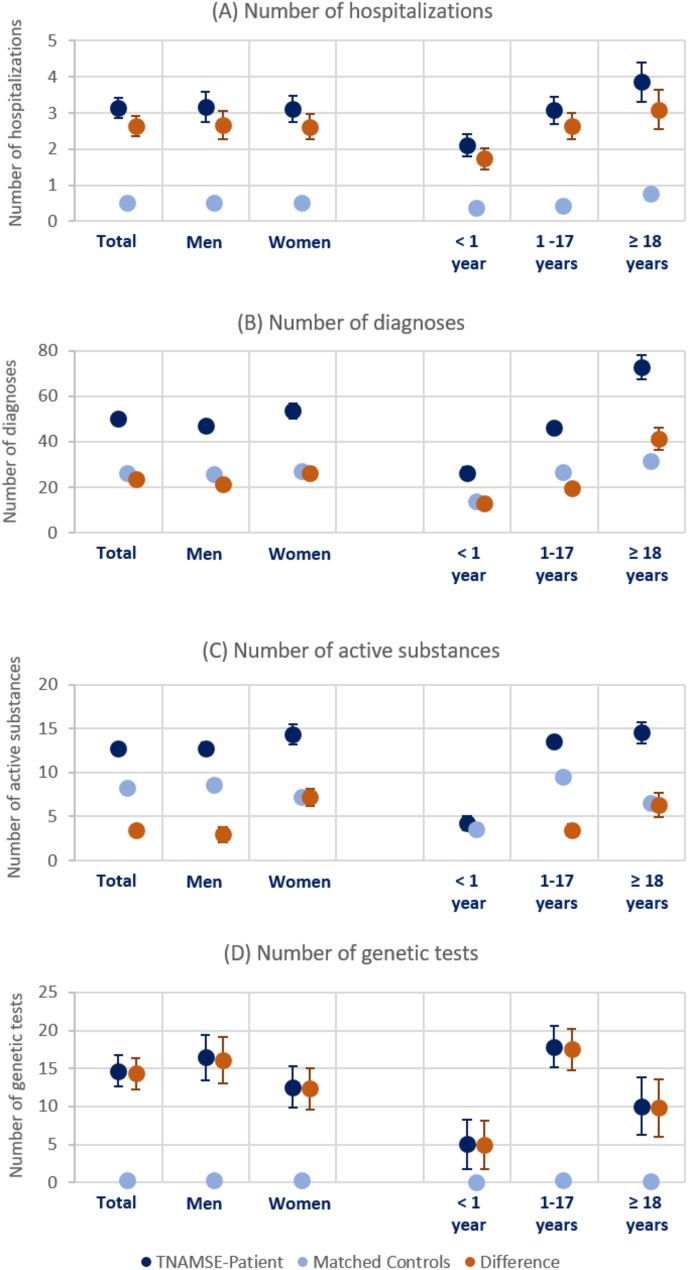
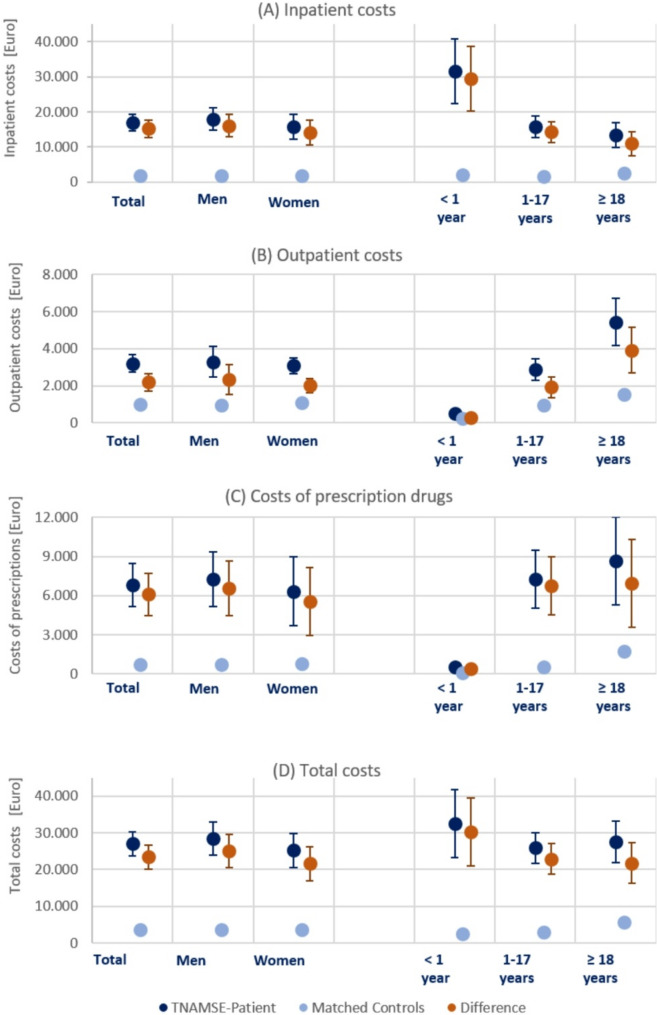
Results: In the years prior to referral to an expert center, healthcare utilization of patients with suspected rare diseases was, on average, substantially and significantly higher compared to a matched control cohort during the same observation period - e.g. in terms of the number of hospitalizations (3.1 (95%CI: 2.9-3.4) vs. 0.5 (95%CI: 0.5-0.5)), different diagnoses (50.0 (95%CI: 48.1-51.9) vs. 26.4 (95%CI: 26.2-26.5)), different active substances prescribed (12.7 (95%CI: 12.2-13.3) vs. 8.2 (95%CI: 8.2-8.3)) and the number of genetic tests (14.7 (95%CI: 12.6-16.7) vs. 0.3 (95%CI: 0.3-0.3)). We found evidence of heterogeneity in utilization by age and sex. On average, direct costs (inpatient, outpatient and prescription drug costs) of patients with suspected rare diseases during the diagnostic pathway were 7.6-fold higher than the costs of matched controls (€26,999 (95%CI: €23,751 - 30,247) vs. €3,561 (95% CI: € 3,455-3,667)). Inpatient costs were the main cost component, accounting for 62.5% of total costs.
Conclusions: The diagnostic odyssey of patients with suspected rare diseases is associated with extensive healthcare utilization and high cost. Against this background, new ways to shorten the diagnostic journey have a high potential to decrease the financial burden related to rare diseases.
Keywords: Diagnostic costs; Diagnostic pathway; Rare diseases; Utilization.
© 2025. The Author(s).
Conflict of interest statement
Declarations. Ethics approval and consent to participate: The study has been approved by the Ethics Committee of the Charite, Berlin (Lead Ethics Committee # EA2/140/17) and by the Ethics Committees of all participating university hospitals. All patients gave their written consent to participate in the study. Consent for publication: Not applicable. Declaration of competing interests: Jochen Schmitt reports institutional grants for investigator-initiated research from the German GBA, BMG, BMBF, EU, Federal State of Saxony, Novartis, Sanofi, ALK, and Pfizer. He also participated in advisory board meetings as a paid consultant for Sanofi, Lilly, and ALK. JS is a member of the Expert Council on Health and Care at the Federal Ministry of Health and a member of the government commission for modern and needs-based hospital care of the current German Coalition. All other authors report no conflicts of interest regarding the submitted work.
Figures
References
-
- Ferreira CR. The burden of rare diseases. Am J Med Genet Part A. 2019;179:885–92. - PubMed
-
- Eurordis. Survey of the delay in diagnosis for 8 rare diseases in Europe (‘EURORDISCARE 2’). Fact Sheet EurordisCare 2 2007.
-
- Michaels-Igbokwe C, McInnes B, MacDonald KV, Currie GR, Omar F, Shewchuk B, et al. (Un) standardized testing: the diagnostic odyssey of children with rare genetic disorders in Alberta, Canada. Genet Sci. 2021;23:272–9. - PubMed
MeSH terms
LinkOut - more resources
Full Text Sources
Medical
