. 2025 May 10;26(1):180.
doi: 10.1186/s12931-025-03263-0.

Intrapleural dual blockade of IL-6 and PD-L1 reprograms CAF dynamics and the tumor microenvironment in lung cancer-associated malignant pleural effusion

Affiliations

Intrapleural dual blockade of IL-6 and PD-L1 reprograms CAF dynamics and the tumor microenvironment in lung cancer-associated malignant pleural effusion

Qinpei Cheng et al. Respir Res. .

Abstract

Background: Malignant pleural effusion (MPE) is a severe complication in lung cancer, characterized by an immunosuppressive tumor microenvironment (TME) and limited therapeutic options. This study investigates the role of IL-6 in regulating immune suppression and tumor progression in MPE and evaluates the efficacy of dual IL-6 and PD-L1 blockade.

Methods: IL-6 levels were measured in MPE and paired serum samples from lung cancer patients, and correlations with PD-L1 expression and clinical outcomes were analyzed using publicly available datasets. RNA sequencing and immune deconvolution were used to assess immune cell infiltration. CAFs and immune cell infiltration were further evaluated using flow cytometry, immunohistochemistry, and multiplex immunofluorescence. In vitro co-culture systems were employed to simulate the MPE microenvironment and explore IL-6 interactions with CAFs, as well as its regulatory effect on tumor cell PD-L1 expression.

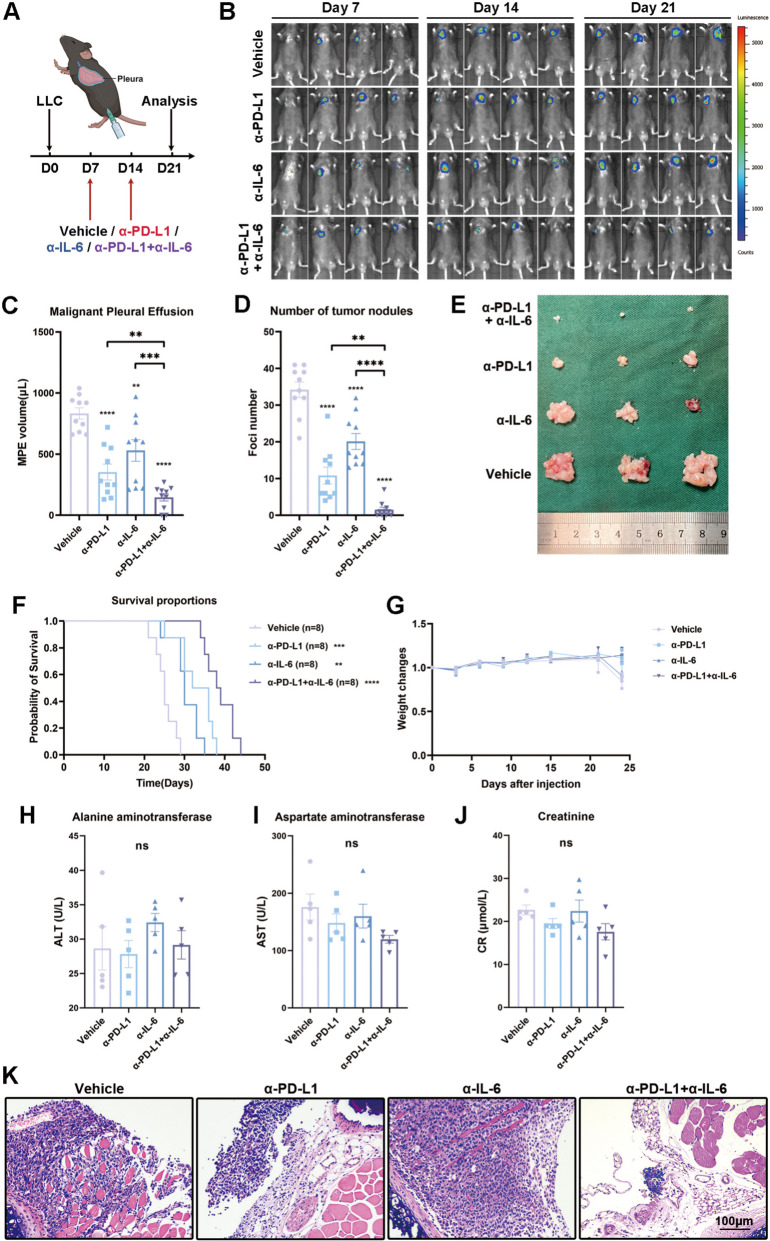
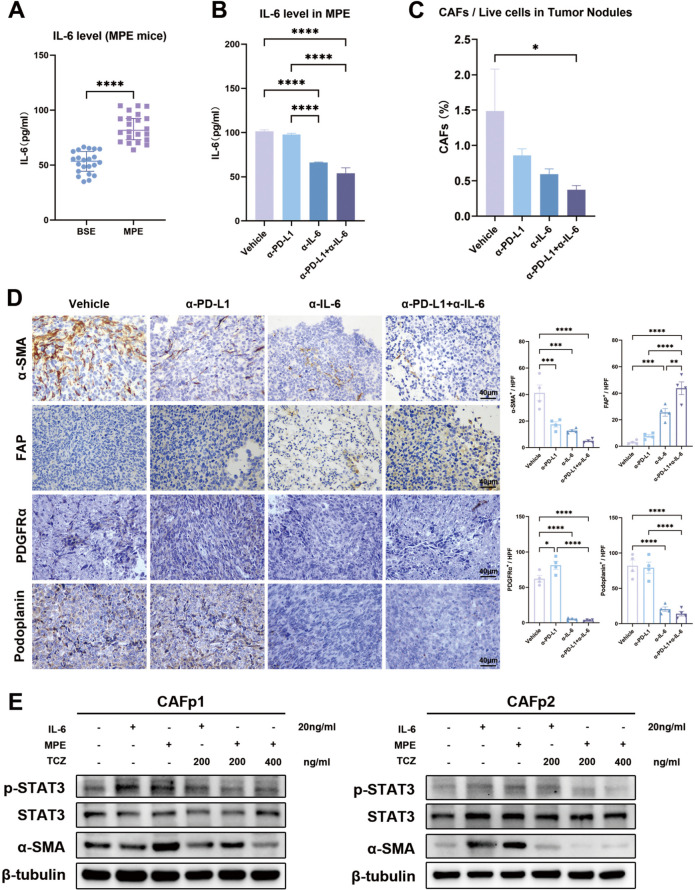
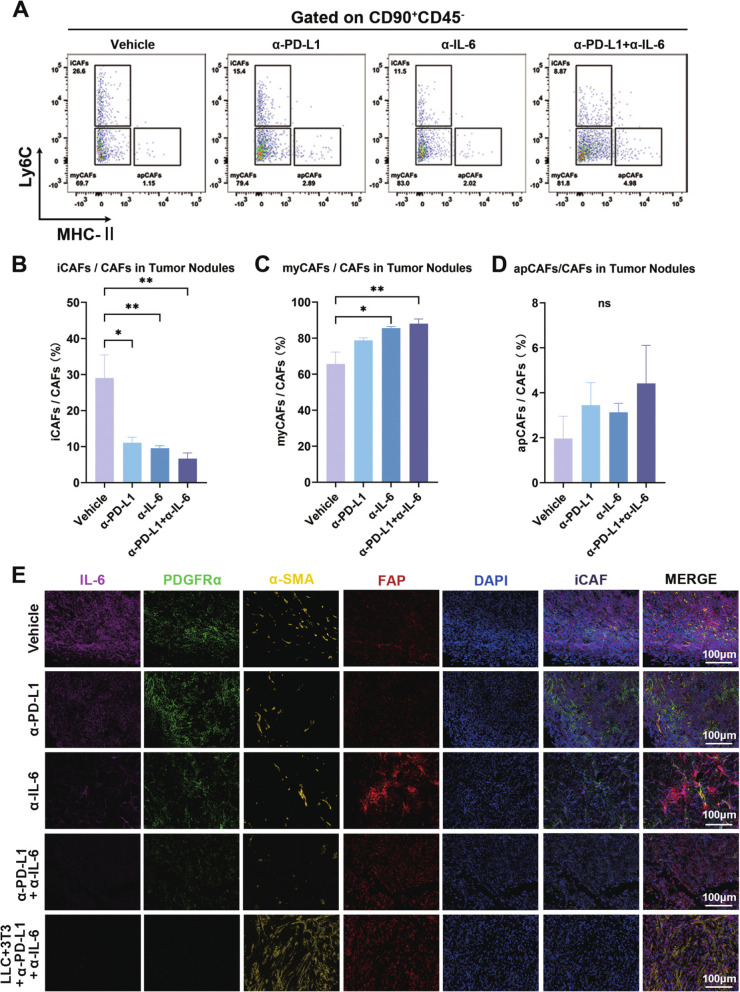
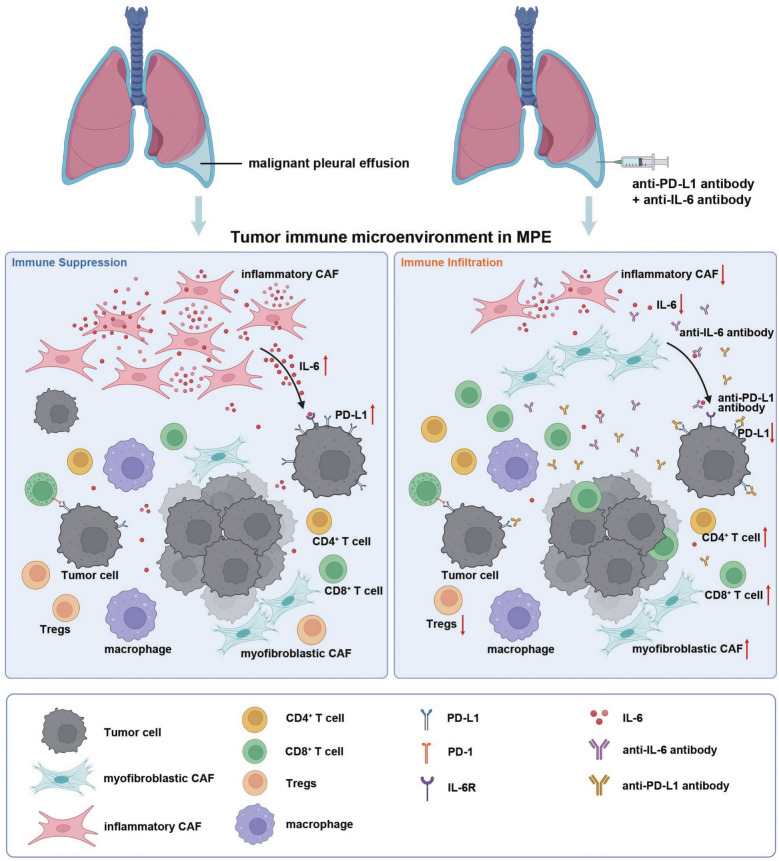
Results: IL-6 levels were significantly elevated in MPE compared to paired serum and correlated with higher PD-L1 expression and poor survival outcomes in lung cancer patients. In the MPE mouse model, combination therapy with IL-6 and PD-L1 blockade reduced MPE volume, tumor burden, and PD-L1 expression, while enhancing T cell infiltration and alleviating TME immunosuppression. IL-6 was found to drive a positive feedback loop with iCAFs, promoting an immunosuppressive environment. In vitro, IL-6 from the MPE upregulated tumor cell PD-L1 expression the IL-6/STAT3 pathway.

Conclusion: This study identifies IL-6 as a critical contributor of immune suppression and tumor progression in MPE. The combination of IL-6 and PD-L1 blockade effectively alleviated immunosuppression and reduced tumor burden, offering a potential therapeutic approach for MPE management.

Keywords: Cancer-associated fibroblast; IL-6; Immunotherapy; Lung cancer; Malignant pleural effusion; PD-L1.


Conflict of interest statement

Declarations. Ethics approval and consent to participate: The studies using human specimens were approved by the Ethical Committee and Institutional Review Board of the Jinling Hospital (#2021DZGZR-YBB-063). The participants provided their informed consent to participate in the study. All animal experiments were approved by the Ethical Committee and Institutional Review Board of the Jinling Hospital (#2021DZGKJDWLS-0089). Consent for publication: Not applicable. Competing interests: The authors declare no competing interests.

Figures

Fig. 1
Fig. 1
Synergistic effects of IL-6 inhibition combined with PD-L1 blockade in the MPE mouse model. A Schematic representation of the treatment protocol, including the timing of administration and duration of treatments for the anti-IL-6 mAb (200 μg), anti-PD-L1 mAb (200 μg), their combination, and the vehicle solution in the MPE mouse model. The MPE mice were randomly assigned to four treatment groups. Created with BioRender. B Representative in vivo bioluminescence images of the growth of mice MPE. C MPE volume, D tumor nodules numbers, E representative images of tumors, F Kaplan–Meier survival plot, G body weight, levels of H ALT, I AST, J Cre in the blood was observed. K Representative H&E staining images of pleural tissue sections Scale bar = 100 µm. All experiments were performed with ≥ 3 biological replicates. *P < 0.05, **p < 0.01, ***p < 0.001, ****p < 0.0001, ns: not statistically significant. LLC, Lewis lung cancer cells; PD-L1, programmed cell death-ligand 1
Fig. 2
Fig. 2
IL-6 inhibition and PD-L1 blockade alleviates immunosuppression in MPE. A Representative flow cytometry images of CD8+ T cells (CD45+CD3+CD8+) and CD4+ T cells (CD45+CD3+CD4+) in MPE mice tumor nodules. The percentage of B CD8+ T cells and C CD4+ T cells in MPE mice tumor nodules were quantified by flow cytometry. The percentage of D IFN-γ⁺ CD8⁺ T cells (CD45+CD3+CD8+IFN-γ+) and E Granzyme B+ CD8+ T cells (CD45+CD3+CD8+Granzyme B+) in tumor nodules were evaluated by flow cytometry. F The percentage of CD8+ Tem (CD45+CD3+CD8+CD44+CD62L), CD8+ Tcm (CD45+CD3+CD8+CD44+CD62L+) and CD8+ naïve T cells (CD45+CD3+CD8+CD44CD62L+) in MPE mice tumor nodules were quantified by flow cytometry. G The percentage of CD4+ Tem (CD45+CD3+CD4+CD44+CD62L), CD4+ Tcm (CD45+CD3+CD4+CD44+CD62L+) and CD4+ naïve T cells (CD45+CD3+CD4+CD44CD62L.+) in MPE mice tumor nodules were quantified by flow cytometry. H Representative images of IHC staining of CD8, CD4, FOXP3, and F4/80 in MPE mice tumor nodules. Scale bar = 100 µm. All experiments were performed with ≥ 3 biological replicates. *p < 0.05, **p < 0.01, ***p < 0.001, ****p < 0.0001, ns: not statistically significant. Tem, effector memory T cells; Tcm, central memory T cells; FOXP3, forkhead box protein 3
Fig. 3
Fig. 3
IL-6 inhibitor and PD-L1 blockade synergistically counteract tumorigenesis by mediating CAFs. A Transcriptomic sequencing and immune deconvolution analysis were used to identify significant changes in specific immune cell populations within the TME of pleural tissue with tumor nodules. B Schematic representation of the establishment of the MPE mouse model with or without NIH/3T3, and the treatment protocol with the vehicle solution, and anti-IL-6 mAb combined with anti-PD-L1 mAb. The MPE mice were randomly assigned to three groups. Created with BioRender. C Western blot analysis of α-SMA expression in NIH/3T3 co-cultured LLC at different ratios. GAPDH was used as the equal loading control. D Representative in vivo bioluminescence images of the growth of mice MPE. E Tumor nodule numbers and F MPE volume were observed. G Representative images of tumors nodules of the MPE mice. H A heatmap represented the differentially expressed genes related to CAFs. I KEGG pathway enrichment of the differentially expressed mRNA between the combined therapy group and the PD-L1 blockade group. All experiments were performed with ≥ 3 biological replicates. *P < 0.05, ***p < 0.001, ***p < 0.001, ****p < 0.0001, ns: not statistically significant. V, mice treated with the vehicle solution; L, mice treated with anti-IL-6 antibody; P, mice treated with anti-PD-L1 antibody; PL, mice treated with anti-IL-6 antibody and anti-PD-L1 antibody; KEGG, Kyoto Encyclopedia of Genes and Genomes
Fig. 4
Fig. 4
IL-6 increased CAF infiltration in the MPE mouse model. Comparison of IL-6 levels in mice MPE A with serum and B between groups. C The percentage of the overall CAFs (CD45CD90+) in mice tumor nodules were quantified by flow cytometry. D Representative images of IHC staining of α-SMA, PDGFRα, podoplanin, and FAP in MPE mice tumor nodules. Scale bar = 40 µm. E Western blot analysis of p-STAT3, STAT3, and α-SMA expression in CAFs treated with IL-6, MPE, MPE and tocilizumab. β-tubulin was used as the equal loading control. All experiments were performed with ≥ 3 biological replicates. *p < 0.05, **p < 0.01, ***p < 0.001, ****p < 0.0001, ns: not statistically significant. BSE: blood serum; MPE: malignant pleural effusion; FAP, fibroblast activation protein-α; α-SMA, α-smooth muscle actin; PDGFRα, platelet derived growth factor receptor α; CAFp1, CAFs isolated from patient 1; CAFp2, CAFs isolated from patient 2; TCZ, tocilizumab
Fig. 5
Fig. 5
IL-6 regulates CAFs and their subtype alterations to promote tumor growth. A Representative flow cytometry images of iCAFs (CD45CD90+Ly6C+MHCII), myCAFs (CD45CD90+Ly6CMHCII) and apCAFs (CD45CD90+Ly6CMHCII+) in MPE mice tumor nodules. The percentage of B iCAFs, C myCAFs and D apCAFs in mice tumor nodules were quantified by flow cytometry. E Representative images of multiplex immunofluorescence of iCAFs (marked by PDGFRα and IL-6) in MPE mice tumor nodules. Scale bar = 100 µm. All experiments were performed with ≥ 3 biological replicates. *p < 0.05, **p < 0.01, ***p < 0.001, ns: not statistically significant. Ly6C, lymphocyte antigen 6 family member C; MHC, major histocompatibility complex; FAP, fibroblast activation protein-α; α-SMA, α-smooth muscle actin; PDGFRα, platelet derived growth factor receptor α; iCAF, inflammatory CAF; myCAF, myofibroblastic CAF; apCAF, antigen-presenting CAF
Fig. 6
Fig. 6
IL-6 in the MPE regulates CAFs and their subtype dynamics. A The mRNA expression of genes including Fap, Pdpn, Pdgfra, Lif and Il6 of pleural tumor nodules of MPE mice treated with anti-PD-L1 and -IL-6 antibody, relative to Actb. B Schematic representation of the co-culture system of CAFs and PBMC. Created with BioRender. CAFs were serum-starved for 12 h and then treated with IL-6 and MPE, respectively, and tocilizumab was added to antagonize IL-6 in MPE. C The percentage of iCAFs (CD90+PDGFRα+HLA-DR) and myCAFs (CD90+PDGFRαHLA-DR) of CAFp1, which was co-cultured with PBMC after MPE only and MPE and tocilizumab together, were quantified by flow cytometry. D The percentage of iCAFs (CD90+PDGFRα+HLA-DR) and myCAFs (CD90+PDGFRαHLA-DR) of CAFp2, which was co-cultured with PBMC after MPE only and MPE and tocilizumab together, were quantified by flow cytometry. F IL-6 levels were assayed in the culture medium of CAFs treated with MPE only and MPE and tocilizumab. G The mRNA expression of genes such as ACTA2, FAP, TAGLN, PDGFRA, IL6 and LIF of CAFs after co-culture with PBMC after MPE only and tocilizumab together, relative to ACTB. PBMC, peripheral blood mononuclear cell; CAFp1, CAFs isolated from patient 1; CAFp2, CAFs isolated from patient 2; TCZ, tocilizumab; NC, negative control
Fig. 7
Fig. 7
IL-6 regulated tumor PD-L1 expression via the IL-6/STAT3 pathway. A Western blot analysis of p-STAT3, STAT3 and PD-L1 in A549 cells serum-starved for 12 h and then treated with IL-6, IL-6 and tocilizumab, IL-6 and S3I-201 (a STAT3 inhibitor). β-actin was used as the equal loading control. B Western blot analysis of p-STAT3, STAT3 and PD-L1 in A549 cells serum-starved for 12 h and then treated with MPE, MPE and tocilizumab, MPE and S3I-201. β-actin was used as the equal loading control. C Quantification of PD-L1 expression in tumor cells (CD45CD90) in MPE mice tumor nodules by MFI analysis through flow cytometry. D Western blot analysis of PD-L1 in mice tumor nodules. β-actin was used as the equal loading control. E Representative images of IHC staining of IL-6 and p-STAT3 in the MPE mice tumor nodules. Scale bar = 100 µm. F Schematic representation of the co-culture system of CAFs and A549. A549 was serum-starved for 12 h and then co-cultured with CAFs and tocilizumab. G Western blot analysis of p-STAT3, STAT3, and PD-L1 in A549 cells co-cultured with CAFs and treated with tocilizumab. β-actin was used as the equal loading control. All experiments were performed with ≥ 3 biological replicates. *p < 0.05, **p < 0.01, ***p < 0.001, ****p < 0.0001, ns: not statistically significant. MFI, mean fluorescence intensity; tPD-L1, tumor PD-L1; CAFp1, CAFs isolated from patient 1; CAFp2, CAFs isolated from patient 2; TCZ, tocilizumab
Fig. 8
Fig. 8
A schematic diagram of the mechanism of IL-6 and PD-L1 dual blockade therapy for the intrapleural treatment of MPE. Elevated IL-6 in MPE contribute to an immunosuppressive microenvironment with low infiltration of CD8+ T cells and high infiltration of iCAFs. IL-6 upregulates PD-L1 in tumor cells, thereby enhancing immunosuppression. Dual blockade of IL-6 and PD-L1 effectively reprograms the TME, reduces tumor burden, and enhances anti-tumor immunity. Created with BioRender

Similar articles

Cited by

References

    1. Zamboni MM, da Silva CT, Baretta R, Cunha ET, Cardoso GP. Important prognostic factors for survival in patients with malignant pleural effusion. BMC Pulm Med. 2015;28(15):29. - PMC - PubMed
    1. Antony VB, Loddenkemper R, Astoul P, Boutin C, Goldstraw P, Hott J, et al. Management of malignant pleural effusions. Eur Respir J. 2001;18(2):402–19. - PubMed
    1. Gonnelli F, Hassan W, Bonifazi M, Pinelli V, Bedawi EO, Porcel JM, et al. Malignant pleural effusion: current understanding and therapeutic approach. Respir Res. 2024;25(1):47. - PMC - PubMed
    1. Psallidas I, Kalomenidis I, Porcel JM, Robinson BW, Stathopoulos GT. Malignant pleural effusion: from bench to bedside. Eur Respir Rev. 2016;25(140):189–98. - PMC - PubMed
    1. Asciak R, Rahman NM. Malignant Pleural Effusion: From Diagnostics to Therapeutics. Clin Chest Med. 2018;39(1):181–93. - PubMed

MeSH terms