. 2025 Jul;12(28):e2506746.
doi: 10.1002/advs.202506746. Epub 2025 May 11.

Development of a DNA Aptamer-Based Approach to Noninvasively Image CAR-T Cells In Vivo and Traceless Enrichment In Vitro

Affiliations

Development of a DNA Aptamer-Based Approach to Noninvasively Image CAR-T Cells In Vivo and Traceless Enrichment In Vitro

Minghui Chen et al. Adv Sci (Weinh). 2025 Jul.

Abstract

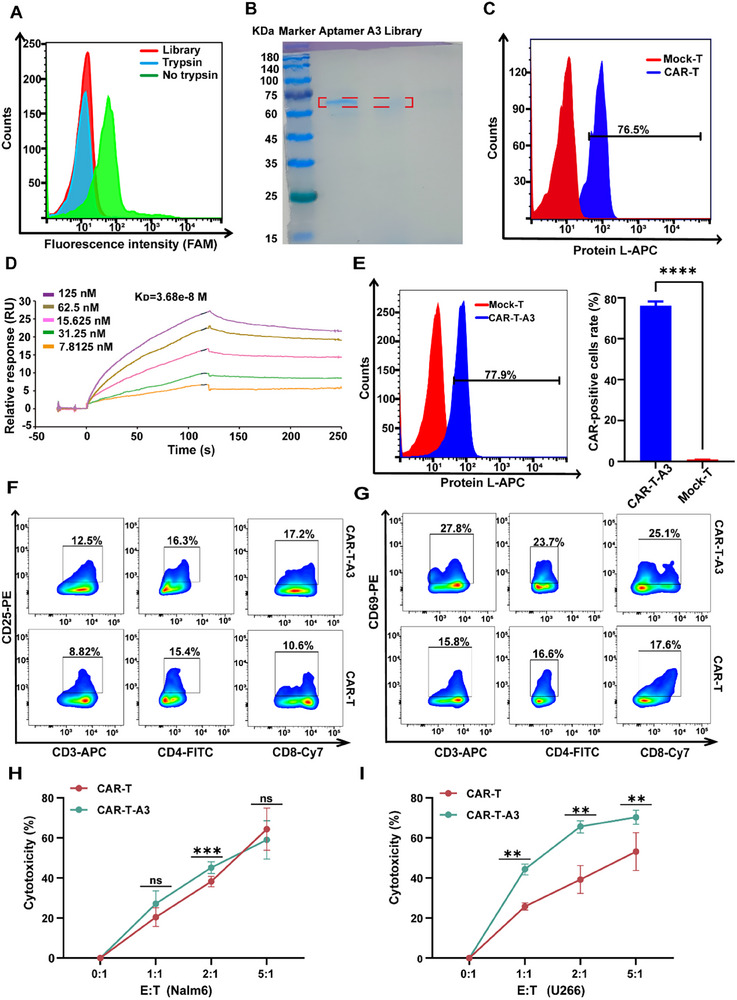
Chimeric antigen receptor (CAR) T cells offered a potential cure for malignancies, however, their outcomes and dynamics across different anatomical sites remained inadequately characterized. Monitoring the bio-distribution and tumor-homing of CAR-T cells in vivo is crucial, as it provides patient-specific data that might inform on treatment success, potential failure, and off-target toxicities. Herein, an Aptamer A3 by Cell-SELEX (systematic evolution of ligands by exponential enrichment) is generated, which can bind with CAR-T cells with nanomolar affinity. After CAR-T cells are injected into Nalm6 xenograft tumor model mice through tail vein, Cy5-labeled A3 is injected into mice for fluorescence time-delay imaging in vivo. The fluorescence signal produced by the Cy5-labeled A3 is accumulated in the tumor area and reached its maximum at day 14. Moreover, A3 could enrich CAR-T cells in mixed cell populations in a traceless way. A3 is screened for CAR-T cells imaging and CAR-T cells enrichment, which may provide assistance for the evaluation of CAR-T cells efficacy and the manufacture of CAR-T cells. Overall, this research shows that A3 enabled repeated, sensitive, and specific assessment of the infused CAR-T cells in vivo. The screened aptamer will have broad applications for tracking CAR-T cells in patients, providing insights into treatment success, potential failure, and off-target toxicities.

Keywords: CAR‐T cells; DNA aptamers; enrichment; fluorescence imaging; tracking.


Conflict of interest statement

The authors declare no conflict of interest.

Figures

Figure 1
Figure 1
Aptamer screening process for CAR‐T cells. A) Schematic illustration of Cell‐SELEX using CAR‐T cells for positive selection and Mock‐T cells for negative selection. B) AC (upper panel) and MC (lower panel) of the elution solution from different rounds of the ssDNA pool during CAR‐T cells aptamers selection. Reaction volumes (20 µL) containing 300 nmol primers, 2×SYBR GREEN qPCRmix, and DNA template on Light Cycler Real‐Time PCR System (Roche 480). C) The binding performance of aptamers, ssDNA library, 5th pool, 7th pool, 9th pool, and 11th pool to CAR‐T cells and Mock‐T cells by flow cytometry. D) Quantitative analysis of fluorescence intensity in enriched DNA pools during different selection rounds for CAR‐T cells and Mock‐T cells, data were obtained from flow cytometry. Error bars represented the standard deviation (n=3).
Figure 2
Figure 2
Characterization of candidate aptamers. A) Flow cytometry assessment of the binding efficiency of eight candidate sequences (250 nmol L−1) with to target CAR‐T cells and control Mock‐T cells. B) Binding curve of Aptamer A3 to CAR‐T cells by flow cytometry. C) Confocal images of CAR‐T cells and Mock‐T cells stained with DAPI (blue) and co‐cultured with Aptamer A3 (green). Blue and green signals indicate DAPI and FAM‐labeled Aptamer A3, respectively. Scale bar: 20 µm. D) Quantitative analysis of average fluorescence intensities in Confocal images of CAR‐T cells and Mock‐T cells after incubation with the Aptamer A3. E) Flow cytometry analysis of the binding ability of Aptamer A3 with target CAR‐T cells and control Mock‐T cells at 4 °C and 37 °C. F) Confocal images of CAR‐T cells after incubation with Aptamer A3 at 4 °C and 37 °C. Blue and green signals indicate DAPI and FAM‐labeled Aptamer A3, respectively. Scale bar: 20 µm. Error bars represented the standard deviation (n=3). * p < 0.05 and ** p < 0.01.
Figure 3
Figure 3
Confirmation of the Aptamer A3 target protein and characterization of CAR‐T cells in vitro after incubation with Aptamers A3. A) After trypsin treatment, the binding of Aptamer A3 to CAR‐T cells was analyzed by flow cytometry. B) Coomassie Brilliant Blue stained 10% SDS‐PAGE was used to evaluate the protein binding to Aptamer A3 (Full‐size image of gel was shown in Figure S11, Supporting Information). C) Flow cytometry analysis of CAR expression on CAR‐T cells incubation without Aptamer A3. D) SPR results of Aptamer A3 for BCMA‐CD19 His protein affinity. E) Flow cytometry analysis of CAR expression on CAR‐T cells‐Aptamer A3 and a statistical graph of the CAR‐positive rate, defined as the percentage of T cells that were positive for protein L binding. F,G) The expression of activation markers CD25 and CD69 in gated CD3+, CD4+, and CD8+ T cell populations from CAR‐T cells and CAR‐T cells‐Aptamer A3. H,I) Cytotoxicity of CAR‐T cells and CAR‐T cells‐Aptamer A3 against Nalm6 and U266 tumor cells. Error bars represented the standard deviation (n=3). * p < 0.05, ** p < 0.01, *** p < 0.001, and **** p < 0.0001.
Figure 4
Figure 4
Whole‐body fluorescence in vivo images of mouse xenogeneic tumor model bearing Nalm6 tumor injected by CAR‐T cells taking direct labeling strategies (n = 3 per group). Agarose gel electrophoresis to confirmed its residual products of Aptamer A3 incubated A) in human serum with different concentrations (0%, 20%, 50%, 100%) for 2h and B) in 20% human serum at the indicated time points (0, 2, 4, 8, 12, and 24 h). (Full‐size images of gel are shown in Figure S13A,B, Supporting Information). C) Images of tail vein injection of Cy5‐labeled Aptamer A3 into mice without CAR T cells and into mice with CAR‐T cells. D) Ex vivo organ fluorescent images of Cy5‐labeled Aptamer A3 into mice without CAR‐T cells and into mice with CAR‐T cells. E) Quantitative analysis of average fluorescence intensities in major organs and tumor tissues. F) Immunofluorescence‐staining images of tumor tissues after Cy5‐labeled Aptamer A3 injection. Blue channel: DAPI; Red channel: Aptamer A3, Green channel: Anti‐CD8‐FITC. The scale bar indicates 100 µm. G) In vivo fluorescence imaging of mice injected CAR‐T cells was performed for one month using Aptamer A3. Fluorescence image acquisition for each time period was carried out half an hour after the Cy5‐labeled Aptamer A3 injection. H) Quantified of average fluorescence intensities in tumor area based on the fluorescence images in different time. Error bars represented the standard deviation (n=3). * p < 0.05 and ** p < 0.01.
Figure 5
Figure 5
Traceless sorting of CAR‐T cells utilizing an Aptamer A3 ‐based approach. A) Schematic representation of the traceless sorting method for CAR‐T cells using Aptamer A3. Biotinylated Aptamer A3 preloaded onto Streptavidin‐magnetic beads to form Aptamer A3 microbeads. B) Predicted minimum free energy (MFE) secondary structure of the modified Aptamer A3, as determined by NUPACK. The orange line indicates the 23‐nt region that a complementary reversal agent (RA) was designed to anneal. Flow cytometry assay to detect C) the CAR‐positive rate of the CAR‐T cells before and after Aptamer A3 sorting, D) the expression rate of CAR in mixed cell populations before Aptamer A3 sorting, and E) the expression rate of CAR in mixed cell populations after Aptamer A3 sorting.

Similar articles

References

    1. a) Lim S. J. S., Grupp S. A., DiNofia A. M., Pediatr. Blood Cancer 2021, 68, 29123; - PubMed
    2. b) Riedell P. A., Bishop M. R., Ther. Adv. Hematol. 2020, 11, 1; - PMC - PubMed
    3. c) Mullard A., Nat. Rev. Drug Discovery 2021, 20, 166. - PubMed
    1. Davila M. L., Riviere I., Wang X., Bartido S., Park J., Curran K., Chung S. S., Stefanski J., Borquez‐Ojeda O., Olszewska M., Qu J., Wasielewska T., He Q., Fink M., Shinglot H., Youssif M., Satter M., Wang Y., Hosey J., Quintanilla H., Halton E., Bernal Y., Bouhassira D. C., Arcila M. E., Gonen M., Roboz G. J., Maslak P., Douer D., Frattini M. G., Giralt S., et al., Sci. Transl. Med. 2014, 6, 224ra25. - PMC - PubMed
    1. Chakravarti D., Wong W. W., Trends Biotechnol. 2015, 33, 449. - PMC - PubMed
    1. Larson R. C., Maus M. V., Nat. Rev. Cancer 2021, 21, 145. - PMC - PubMed
    1. Flugel C. L., Majzner R. G., Krenciute G., Dotti G., Riddell S. R., Wagner D. L., Abou‐el‐Enein M., Nat. Rev. Clin. Oncol. 2023, 20, 49. - PMC - PubMed

Substances

LinkOut - more resources