. 2025 Jun;12(22):e2417733.
doi: 10.1002/advs.202417733. Epub 2025 May 11.

Microglial MS4A4A Protects against Epileptic Seizures in Alzheimer's Disease

Affiliations

Microglial MS4A4A Protects against Epileptic Seizures in Alzheimer's Disease

Meng Jiang et al. Adv Sci (Weinh). 2025 Jun.

Abstract

Alzheimer's disease (AD) is a predominant neurodegenerative disorder worldwide, with epileptic seizures being a common comorbidity that can exacerbate cognitive deterioration in affected individuals, thus highlighting the importance of early therapeutic intervention. It is determined that deletion of Ms4a4a, an AD-associated gene, exacerbates seizures in amyloid β (Aβ)-driven AD mouse model. MS4A4A is significantly upregulated in brain lesions in patients with epilepsy. Single-cell sequencing reveals that MS4A4A is highly expressed in microglia within these lesions, linked to enhanced phagocytic activity. Mechanistic investigation delineates that deletion of Ms4a4a impairs microglial phagocytosis, accompanied by diminished calcium influx and disruptions in mitochondrial metabolic fitness. The cytosolic fragment of Ms4a4a is anchored to the cytoskeletal components, supporting its critical role in mediating phagocytosis. Induction of Ms4a4a through central delivery of LNP-Il4 alleviates seizure conditions. Collectively, these findings identify Ms4a4a as a potential therapeutic target for managing seizures in AD treatment.

Keywords: Alzheimer's disease; MS4A4A; epilepsy; microglia; phagocytosis.


Conflict of interest statement

The authors declare no conflict of interest.

Figures

Figure 1
Figure 1
Loss of Ms4a4a exacerbates epileptic death in Aβ‐driven AD mouse model. A) Relative transcript levels of Ms4a4a in cerebral cortex, hippocampus, thalamus, and hypothalamus of 21 days and 7 months in WT and APP/PS1 mice determined by RT‐qPCR. n ≥ 3. B,C) Percent survival of mouse populations of the indicated genotypes as a function of age (postnatal day) for females and males. n = 11–48. D) WT and KO mice showing normal EEG activity (left), APP/PS1 and APP/PS1;KO mice exhibiting generalized epileptiform (interictal) spike discharges in the frequency ranges of 0–7, 7–14, and 14–49 Hz (right). n = 2. E) Expression levels of Ms4a4a mRNA in cultured primary microglia and astrocytes from WT mice determined by RT‐qPCR. n ≥ 4. F) The timeline showing the experimental design of the KA injection. G) The proportion of stage IV–V seizures of WT and CKO mice injected by KA within 150 min. n ≥ 9. H) The timeline showing the experimental design of the PTZ injection. I) The grayscale table showing behavioral seizures score of WT and CKO group. J) Quantitative analysis showing reduced total injection numbers to death in CKO. K) Quantitative analysis showing reduced time to the onset of RS 3 seizure in CKO. n ≥ 10. Data are presented as mean ± SEM. p‐values were calculated by two‐way ANOVA (A), log‐rank test (B and C) and two‐tailed, unpaired Student's t‐test (E, J, and K), ns p > 0.05, *p ≤ 0.05, **p ≤ 0.01, ***p ≤ 0.001, ****p ≤ 0.0001.
Figure 2
Figure 2
Expression of MS4A4A is upregulated in lesions of epilepsy patients. The heatmaps displaying the expression levels of MS4A family in the bulk RNA‐seq of A) FCD_2b seizure patients and B) TSC seizure patients. n = 4. The heatmaps displaying the expression levels of the genes related to phagocytosis and other processes in the bulk RNA‐seq of C) FCD_2b seizure patients and D) TSC seizure patients. n = 4. E) Relative transcript levels of MS4A family genes in lesions and perilesional tissues of LEAT, FCD_2b, and TSC patients verified by RT‐qPCR. n ≥ 8. F) Scheme for injecting AAV9‐hSyn‐EGFP‐2A‐Cre‐WPRE (AAV9‐hSyn‐EGFP‐3×FLAG‐WPRE as control) into Tsc1fl/fl mice. G) Relative transcript levels of Tsc1 and Ms4a4a around injection site determined by RT‐qPCR. Parenchymal stereotaxic injection was conducted two weeks before RT‐qPCR. n = 4. Data are presented as mean ± SEM. p‐values were calculated by two‐tailed, paired Student's t‐test (A–E and G), #p > 0.05, *p ≤ 0.05, **p ≤ 0.01, ***p ≤ 0.001.
Figure 3
Figure 3
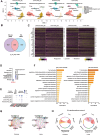
High expression of the MS4A family is associated with enhanced phagocytic capacity. A) t‐distributed stochastic neighbor embedding (t‐SNE) plot of seven clusters. B) Venn diagram showing the number of significantly differentially expressed genes between lesional and perilesional tissues in FCD_2b and TSC patients. p_val_adj < 0.05. C) Heatmap depicting the relative expression of selective inflammatory genes, phagocytosis genes, and metabolic genes in microglia of FCD_2b and TSC patients. The star on the right indicates the p‐values between lesional and perilesional microglia in FCD_2b and TSC patients. D) Dotplot showing the expression of MS4A4A across seven clusters and E) the expression profile of the MS4A family in microglia. F) Bar chart showing selectively enriched GO terms of lesional and perilesional tissues in FCD_2b and TSC. G) Network diagram displaying the intercellular communication between cell types in TSC. Each line representing the ligands expressed by the cell population, then the line connected to the cell types expressing the cognate receptors. The loops indicating autocrine circuits. The line thickness representing the number of ligand–receptor pairs. H) Circos plot showing the IL4 signaling pathway network of lesional and perilesional tissues in TSC. p‐values were calculated by Wilcoxon rank sum test (B, C), *p ≤ 0.05, **p ≤ 0.01, ***p ≤ 0.001, ****p ≤ 0.0001.
Figure 4
Figure 4
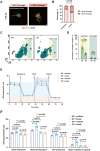
Ms4a4a deficiency in microglia leads to impaired phagocytosis. Representative immunofluorescence images showing Iba1 with varying coverage of NeuN in brain tissues of A) FCD_2b patients and B) the percentage of Iba1 with different NeuN coverage. Scale bars, 10 µm. Survey of over 180 microglia from 8 to 10 subfields and n = 4 patients/group. C) Representative flow cytometry plots of cultured primary microglia (WT and KO) after co‐culture with 6 µm fluorescent beads for 2 h. D) Phagocytic ability indicated by the proportion of 6 µm fluorescent beads inside the cultured primary microglia declined. n ≥ 4. E,F) Representative OCR measurements obtained from Seahorse assays, normalized to microglia intensity, for WT, WT+beads, KO, and KO+ beads groups. Arrows indicating addition of oligomycin, FCCP, and rotenone+antimycin A (Rot/AA) (E). Quantification of basal respiration, maximal respiration, ATP production, and spare respiratory capacity from Seahorse experiments depicted in (E) with four group cultured primary microglia (F). n ≥ 6. Data are presented as mean ± SEM. p‐values were calculated by two‐tailed, paired Student's t‐test (B), two‐tailed, unpaired Student's t‐test (D), and two‐way ANOVA (F), ns p > 0.05, *p ≤ 0.05, **p ≤ 0.01, ***p ≤ 0.001, ****p ≤ 0.0001.
Figure 5
Figure 5
Ms4a4a deficiency in microglia leads to altered calcium signaling. A) Representative immunofluorescence images and B) calcium activity (ΔF/F) in the process of touching and engulfing 6 µm beads by P2ry12CreERT2;Ai95 microglia in vitro. Scale bars, 25 µm. Calcium activity (ΔF/F) of WT and KO microglia indicated by calcium flux indicator Rhod2 after adding C) 6 µm beads and D) HiLyte Fluor 488 Aβ1‐42 separately. n ≥ 10. E) Calcium activity (ΔF/F) of live P2ry12CreERT2;Ai95 brain slices after adding aCSF, 100 × 10−3 m PTZ and 100 × 10−3 m KA separately. n ≥ 10. F) Calcium activity (ΔF/F) of WT and KO microglia indicated by calcium flux indicator Rhod2 after adding supernatant collected from live brain slices stimulated with 100 × 10−3 m PTZ or aCSF. n ≥ 30. Data are presented as mean ± SEM. p‐values were calculated by two‐way ANOVA (C–F), ns p > 0.05, *p ≤ 0.05, ****p ≤ 0.0001.
Figure 6
Figure 6
MS4A4A mediates phagocytosis and is possibly through interacting with cytoskeleton. A) Strategy of Ms4a4aHA/HA mouse. B) The ranking list of proteins interacting with MS4A4A as identified by mass spectrometry. C) GO analysis of mass spectrum results listed potential proteins interacted with MS4A4A. D) Verification of interaction between MS4A4A and Actin by co‐immunoprecipitation assay in BMDMs. E) Western blot and F) representative immunofluorescence captures showing MS4A4A expression of WT and KO microglia. Scale bar, 5 µm. G) Representative immunofluorescence captures showing the spatial position of MS4A4A and Actin stained by phalloidin in microglia. H) The histogram shows that MS4A4A colocalized with phalloidin. Scale bar, 10 µm.
Figure 7
Figure 7
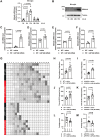
Administering Il4 mRNA encapsulated in lipid nanoparticles (LNPs) to the CNS enhances the tolerance to epileptic onset. A) Relative transcript levels of Ms4a4a in microglia treated with IL‐4 for the indicated time determined by RT‐qPCR. n ≥ 3. B) Western blot showing MS4A4A expression in cultured primary microglia treated with IL‐4 for the indicated time. n = 3. C–F) Relative transcript levels of Il4, Ms4a4a, Ms4a6b, Ms4a6c in cerebral cortex of WT+saline and WT+LNP groups determined by RT‐qPCR. n = 5. G–M) The grayscale table showing behavioral seizure scores of the four groups (WT+saline, WT+LNP, APP/PS1+saline, and APP/PS1+LNP) after the drug‐induced seizure model was performed (G). The total injection number to death of WT groups (H) and APP/PS1 groups (I). Time to the onset of RS 3 seizure of WT groups (J) and APP/PS1 groups (K). Average score of WT groups (L) and APP/PS1 groups (M). n ≥ 6. Data are presented as mean ± SEM. p‐values were calculated by one‐way ANOVA (A) and two‐tailed, unpaired Student's t‐test (C–F and H–M), *p ≤ 0.05, **p ≤ 0.01, ***p ≤ 0.001, ****p ≤ 0.0001.

References

    1. Scheltens P., De Strooper B., Kivipelto M., Holstege H., Chételat G., Teunissen C. E., Cummings J., van der Flier W. M., Lancet 2021, 397, 1577. - PMC - PubMed
    1. Gilbert M. A. G., Fatima N., Jenkins J., Nature 2024, 631, 913. - PMC - PubMed
    1. Palop J. J., Mucke L., Nat. Rev. Neurosci. 2016, 17, 777. - PMC - PubMed
    1. Anastacio T. D., Matosin N., Ooi L., Transl. Psychiatry 2022, 12, 257. - PMC - PubMed
    1. Pease M., Gupta K., Moshé S. L., Correa D. J., Galanopoulou A. S., Okonkwo D. O., Gonzalez‐Martinez J., Shutter L., Diaz‐Arrastia R., Castellano J. F., Nat. Rev. Neurol. 2024, 20, 298. - PubMed

Substances