. 2025 Aug;12(30):e2503247.
doi: 10.1002/advs.202503247. Epub 2025 May 11.

AI-Driven Defecation Analysis by Smart Healthcare Toilet: Exploring Biometric Patterns and Eu-Tenesmus

Affiliations

AI-Driven Defecation Analysis by Smart Healthcare Toilet: Exploring Biometric Patterns and Eu-Tenesmus

Zhiquan Song et al. Adv Sci (Weinh). 2025 Aug.

Abstract

Defecation, a fundamental physiological process, remains underexplored despite its importance in human health. To address this gap, a smart toilet system is developed that enables real-time monitoring of defecation behaviors. Analyzing 45 defecation events from 11 participants, key defecation parameters are identified, including stool dropping duration, stool thickness, and eu-tenesmus interval. Stool dropping duration follows a log-normal distribution, with longer durations (>5 s) linked to lower Bristol Stool Form Scale (BSFS) scores, suggesting constipation (p = 0.008 for BSFS1/2/3 vs BSFS5/6/7). Stool thickness decreases with increasing BSFS scores (p = 5 × 10⁻⁶ for BSFS1/2/3 vs BSFS5/6/7), validating its role as an objective marker for bowel function. Eu-tenesmus is introduced, defined as the interval between the last stool drop and cleansing, averaging 74.8 s. It shows significant gender differences (p = 0.014) but no correlation with stool consistency, suggesting its potential as an independent biomarker for gut health. Defecation behaviors between humans and animals is also compared in detail. Longitudinal monitoring demonstrates the potential for personalized health tracking and dietary recommendations. Furthermore, the feasibility of biometric identification is established using 11 defecation-related parameters, including stool properties and cleansing behavior. These features enable high participant differentiation, supporting non-invasive identity verification.

Keywords: biometrics; defecation; digital biomarker; smart toilet; tenesmus.


Conflict of interest statement

S.‐m.P. and D.D.W. are co‐founders of a stealth mode start‐up (Kanaria Health) specializing in the implemented of a similar technology developed in the manuscript.

Figures

Figure 1
Figure 1
Schematic illustration of the smart toilet's working mechanism. a) The mountable smart toilet system comprises an optical sensor, a pressure sensor, a light‐emitting diode (LED) strip, and a single‐board computer, all connected via a printed circuit board (PCB). This configuration enables real‐time monitoring of defecation conditions and behaviors. b) The optical sensor supports three analytical models for defecation assessment. 1) Stool thickness model: the stool is detected in the captured image, and its thickness is calculated by converting pixel counts to millimeters, applying a transformation coefficient based on the distance between the stool and the sensor. 2) Stool dropping duration model: Two filters, “stool dropping” and “stool dropped,” track the stool while it is being passed and after it has fallen into the toilet, respectively. By computing the time difference between these detections, it is possible to determine the stool dropping duration and to pinpoint both the first and last stool events. 3) Bristol stool form scale (BSFS) model: A convolutional neural network (CNN) classifies the stool into seven categories. BSFS1 and BSFS2 for constipation, BSFS3 to BSFS5 for normal stool, and BSFS6 and BSFS7 for diarrhea. c) By integrating temporal data from the optical sensor and pressure sensor, the system can further derive key parameters such as the first and last stool drop times, active defecation duration, eu‐tenesmus, and other defecation‐related behaviors.
Figure 2
Figure 2
Comprehensive analysis of defecation dynamics and comparative zoological patterns (n = 45; statistical significance was assessed using either a two‐sided Welch's t‐test or Mann–Whitney U test depending on normality; differences with p < 0.05 were considered statistically significant). a) Distribution of stool dropping duration among study participants, highlighting significant variability and potential indicators of gastrointestinal health. b) Stool‐dropping duration comparison between BSFS scores. There is no significant difference in stool‐dropping duration between adjacent BSFS scores, but there is a statistically significant difference between constipation and diarrhea. c) Stool thickness comparison between male and female. There is no significant difference between males and females. d) Stool thickness comparison between BSFS scores. Stool thickness increases as the BSFS score gets lower. e) The relationship between stool dropping duration and the stool thickness. f) Eu‐tenesmus comparison between male and female. There is a significant difference between males and females. g) Eu‐tenesmus comparison between BSFS scores. There is no significant difference between BSFS scores. h) A comparative analysis of human and zoological defecation patterns shows that the total defecation duration in humans is significantly longer than in animals, but the active defecation duration is similar.
Figure 3
Figure 3
Longitudinal analysis of participant defecation patterns over a three‐week period using the smart toilet system. Each participant's defecation events are characterized by BSFS scores, with varied patterns indicating different gastrointestinal health statuses. Notably, the yellow square denotes a participant with consistently lower BSFS scores suggestive of constipation, while a couple indicated by light and dark blue triangles exhibit patterns consistent with diarrhea. The green dot represents an individual with stable and ideal stool consistency, potentially reflecting optimal gut health. In contrast, the red rhombus demonstrates fluctuating patterns, which could be indicative of an irregular bowel condition such as IBS, necessitating further medical evaluation. These visualizations aid in the potential identification of gastrointestinal health needs, informing personalized treatment recommendations.
Figure 4
Figure 4
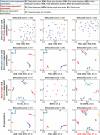
t‐SNE Clustering of Participants’ Defecation Characteristics (n = 45). Eleven defecation‐related parameters were classified into three categories (defecation time‐dependent parameters, stool shape‐dependent parameters, and behavior‐dependent parameters). For each pair of combined categories, the three highest silhouette scores for parameter combinations are shown. Additionally, the overall highest silhouette score based on all eleven parameters is also presented.

References

    1. Park S.‐m., Ge T. J., Won D. D., Lee J. K., Liao J. C., Nat. Rev. Gastroenterol. Hepatol. 2021, 18, 521. - PMC - PubMed
    1. a) "Break the Taboo with Poo" , Nat. Rev. Gastroenterol. Hepatol. 2021, 18, 743; - PMC - PubMed
    2. b) "We Need to Talk About Crapping ", Nat. Microbiol. 2018, 3, 1189; - PubMed
    3. c) Park S.‐m., Nat. Rev. Gastroenterol. Hepatol. 2024, 21, 217. - PubMed
    1. a) Drossman D. A., Whitehead W. E., Camilleri M., Gastroenterology 1997, 112, 2120; - PubMed
    2. b) Camilleri M., Boeckxstaens G., Gut 2023, 72, 590. - PMC - PubMed
    1. Koppen I. J., Vriesman M. H., Saps M., Rajindrajith S., Shi X., van Etten‐Jamaludin F. S., Di Lorenzo C., Benninga M. A., Tabbers M. M., J. Pediatr. 2018, 198, 121. - PubMed
    1. a) Gambhir S. S., Ge T. J., Vermesh O., Spitler R., Sci. Transl. Med. 2018, 10; - PMC - PubMed
    2. b) Gambhir S. S., Ge T. J., Vermesh O., Spitler R., Gold G. E., Sci. Transl. Med. 2021, 13; - PubMed
    3. c) Ge T. J., Rahimzadeh V. N., Mintz K., Park W. G., Martinez‐Martin N., Liao J. C., Park S.‐m., Sci. Transl. Med. 2023, 15, abk3489. - PMC - PubMed

LinkOut - more resources