. 2025 Jul;12(28):e2504066.
doi: 10.1002/advs.202504066. Epub 2025 May 11.

Intermediate Filament Protein BFSP1 Maintains Oocyte Asymmetric Division by Modulating Spindle Length

Affiliations

Intermediate Filament Protein BFSP1 Maintains Oocyte Asymmetric Division by Modulating Spindle Length

Yu Li et al. Adv Sci (Weinh). 2025 Jul.

Abstract

The cytoskeleton is composed of microtubules, microfilaments, and intermediate filaments in cells. While the functions of microtubules and microfilaments have been well elucidated, the roles of intermediate filaments and associated proteins remain largely unknown, especially in meiosis. BFSP1 is an intermediate filament protein mainly expressed in the eye lens to play important roles in the development of congenital cataract. Here, we document that BFSP1 functions as a spindle regulator to drive the oocyte asymmetric division. Specifically, we found that BFSP1 distributed on the spindle apparatus during oocyte meiotic maturation. Depletion of BFSP1 resulted in symmetric division of oocytes, accompanied by the formation of elongated spindles at metaphase I and anaphase/telophase I stages. In addition, immunoprecipitation combined with mass spectrometry analysis identified MAP1B, a microtubule-associated protein, as an interacting partner of BFSP1. Depletion or mutation of MAP1B phenocopied the meiotic defects observed in BFSP1-depleted oocytes, and expression of exogenous MAP1B-EGFP in BFSP1-depleted oocytes recovered the spindle length and asymmetric division. We further determined that BFSP1 recruited molecular chaperone HSP90α on the spindle to stabilize MAP1B, thereby controlling the spindle length. To sum up, our findings reveal a unique meiotic role for BFSP1 in the regulation of spindle dynamics and oocyte asymmetric division.

Keywords: BFSP1; asymmetric division; intermediate filament protein; oocyte meiosis; spindle length.


Conflict of interest statement

The authors declare no conflict of interest.

Figures

Figure 1
Figure 1
Protein expression and subcellular localization of BFSP1 during mouse oocyte meiosis. A) Protein levels of BFSP1 in oocytes at different developmental stages corresponding to GV (germinal vesicle), GVBD (germinal vesicle breakdown), M I (metaphase I), and M II (metaphase II) were examined by immunoblotting analysis. B) The band intensity of BFSP1 in the blots was normalized with that of GAPDH. C) Representative images of BFSP1 localization during oocyte maturation. Scale bar, 20 µm. D) Representative images of BFSP1‐6×HA localization during oocyte maturation. Scale bar, 20 µm. Data in (B) were expressed as mean ± SEM of at least three independent experiments. ** P < 0.01; ns, no significance.
Figure 2
Figure 2
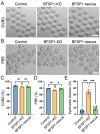
BFSP1 depletion leads to the defective oocyte meiotic maturation. A) Representative images of oocytes at GVBD stage in control, BFSP1‐KD (knockdown), and BFSP1‐rescue groups. Scale bar, 80 µm. B) Representative images of oocytes at M II stage in control, BFSP1‐KD, and BFSP1‐rescue groups. Yellow asterisks indicate oocytes that failed to extrude the first polar body, and red asterisks indicate oocytes with symmetric division. Scale bar, 80 µm. C) The GVBD rate was quantified in control (n = 96), BFSP1‐KD (n = 110), and BFSP1‐rescue (n = 110) oocytes. D) The PBE (polar body extrusion) rate was quantified in control (n = 96), BFSP1‐KD (n = 110), and BFSP1‐rescue (n = 110) oocytes. E) The rate of symmetric division was quantified in control (n = 96), BFSP1‐KD (n = 110), and BFSP1‐rescue (n = 110) oocytes. Data in (C), (D), and (E) were expressed as mean ± SEM of at least three independent experiments. * P < 0.05; ** P < 0.01; *** P < 0.001; ns, no significance.
Figure 3
Figure 3
BFSP1 depletion compromises the spindle dynamics in oocytes. A) Schematic representation of spindle migration and asymmetric division during mouse oocyte meiosis. B) Schematic representation of spindle migration coefficient. L indicates the distance from the proximal spindle pole to the cortex, and D indicates the diameter of the oocyte. L/D indicates the spindle migration coefficient. C) Representative images of spindle migration in control, BFSP1‐KD, and BFSP1 rescue oocytes at 9 h post‐GV. White line indicates the distance from the proximal spindle pole to the cortex, and yellow line indicates the diameter of the oocyte. Scale bar, 20 µm. D) Spindle migration coefficient was calculated in control (n = 21), BFSP1‐KD (n = 15), and BFSP1‐rescue (n = 18) oocytes. E) Representative images of spindle length in control, BFSP1‐KD, and BFSP1‐rescue oocytes at M I stage. Oocytes were immunostained for α‐tubulin and γ‐tubulin. Scale bar, 15 µm. F) Spindle length was measured between two spindle poles in control (n = 28), BFSP1‐KD (n = 23), and BFSP1‐rescue (n = 23) oocytes at M I stage. G) Representative images of spindle length in control, BFSP1‐KD, and BFSP1‐rescue oocytes at AT I (anaphase/telophase I) stage (in vitro culture for 9 h 45 min post‐GV). Oocytes were immunostained for α‐tubulin and γ‐tubulin. Scale bar, 15 µm. H) Spindle length was measured between two spindle poles in control (n = 14), BFSP1‐KD (n = 12), and BFSP1‐rescue (n = 15) oocytes at AT I stage. Data in (D), (F), and (H) were expressed as mean ± SD of at least three independent experiments. ** P < 0.01; *** P < 0.001; ns, no significance.
Figure 4
Figure 4
BFSP1 interacts with MAP1B and affects its protein stability. A) Identification of BFSP1 binding proteins by IP/MS analysis. Protein name, coverage percentage, the number of identified peptides, and molecular weight were shown in the table. B) Representation of the 3D structure and predicted interaction of mouse BFSP1 and MAP1B using AlphaFold databank by HDOCK server. C) Co‐IP using anti‐BFSP1 antibody followed by immunoblotting analysis with anti‐MAP1B and anti‐BFSP1 antibodies. D) Co‐IP using anti‐MAP1B antibody followed by immunoblotting analysis with anti‐BFSP1 and anti‐MAP1B antibodies. E) Representative images of MAP1B in control and BFSP1‐KD oocytes. Scale bar, 10 µm. F) The ratio of MAP1B fluorescence intensity in the spindle region to the cytoplasmic region was measured in control and BFSP1‐KD oocytes. G) Protein levels of MAP1B in control, BFSP1‐KD, and BFSP1‐rescue oocytes as assessed by immunoblotting analysis. The band intensity of BFSP1 and MAP1B was normalized with that of GAPDH. H) The band intensities of BFSP1 and MAP1B in the blots were normalized with that of GAPDH. Data in (F) were expressed as mean ± SD, and (H) were expressed as mean ± SEM of at least three independent experiments. *** P < 0.001; ns, no significance.
Figure 5
Figure 5
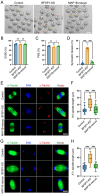
MAP1B depletion impairs the oocyte meiotic maturation and spindle length control. A) Representative images of oocytes at M II stage in control and MAP1B‐KD groups. Yellow asterisks indicate oocytes that failed to extrude the first polar body, and red asterisks indicate oocytes with symmetric division. Scale bar, 80 µm. B) The GVBD rate was quantified in control (n = 202) and MAP1B‐KD (n = 189) oocytes. C) The PBE rate was quantified in control (n = 202) and MAP1B‐KD (n = 189) oocytes. D) The rate of symmetric division was quantified in control (n = 202) and MAP1B‐KD (n = 189) oocytes. E) Representative images of spindle length in control and MAP1B‐KD oocytes at M I stage. Oocytes were immunostained for α‐tubulin and γ‐tubulin. Scale bar, 15 µm. F) Spindle length was measured between two spindle poles in control (n = 23) and MAP1B‐KD (n = 26) oocytes at M I stage. G) Representative images of spindle length in control and MAP1B‐KD oocytes at AT I stage. Oocytes were immunostained for α‐tubulin and γ‐tubulin. Scale bar, 15 µm. H) Spindle length was measured between two spindle poles in control (n = 15) and MAP1B‐KD (n = 19) oocytes at AT I stage. Data in (B), (C), and (D) were expressed as mean ± SEM, and (F) and (H) were expressed as mean ± SD of at least three independent experiments. * P < 0.05; ** P < 0.01; *** P < 0.001.
Figure 6
Figure 6
Restored MAP1B protein levels mitigate the meiotic defects induced in BFSP1 depleted‐oocytes. A) Representative images of oocytes at M II stage in control, BFSP1‐KD, and MAP1B‐rescue groups. For the rescue experiment, MAP1B‐EGFP mRNA was microinjected to GV oocytes 20 h after microinjection of BFSP1 siRNAs. Yellow asterisks indicate oocytes that failed to extrude the first polar body, and red asterisks indicate oocytes with symmetric division. Scale bar, 80 µm. B) The GVBD rate was quantified in control (n = 180), BFSP1‐KD (n = 174), and MAP1B‐rescue (n = 185) oocytes. C) The PBE rate was quantified in control (n = 180), BFSP1‐KD (n = 174), and MAP1B‐rescue (n = 185) oocytes. D) The rate of symmetric division was quantified in control (n = 180), BFSP1‐KD (n = 174), and MAP1B‐rescue (n = 185) oocytes. E) Representative images of spindle length in control, BFSP1‐KD, and MAP1B‐rescue oocytes at M I stage. Oocytes were immunostained for α‐tubulin and γ‐tubulin. Scale bar, 15 µm. F) Spindle length was measured between two spindle poles in control (n = 19), BFSP1‐KD (n = 19), and MAP1B‐rescue (n = 14) oocytes at M I stage. G) Representative images of spindle length in control, BFSP1‐KD, and MAP1B‐rescue oocytes at AT I stage. Oocytes were immunostained for α‐tubulin and γ‐tubulin. Scale bar, 15 µm. H) Spindle length was measured between two spindle poles in control (n = 18), BFSP1‐KD (n = 17), and MAP1B‐rescue (n = 13) oocytes at AT I stage. Data in (B), (C), and (D) were expressed as mean ± SEM, and (F) and (H) were expressed as mean ± SD of at least three independent experiments. * P < 0.05; ** P < 0.01; *** P < 0.001; ns, no significance.
Figure 7
Figure 7
BFSP1 maintains MAP1B protein levels by recruiting HSP90α. A) Co‐IP using anti‐BFSP1 antibody followed by immunoblotting analysis with anti‐HSP90α and anti‐BFSP1 antibodies. B) Protein levels of MAP1B in control and 17‐AAG‐treated oocytes as assessed by immunoblotting analysis. C) The band intensity of MAP1B in the blots was normalized with that of β‐Actin. D) Protein levels of HSP90α in control and BFSP1‐KD oocytes as assessed by immunoblotting analysis. E) The band intensities of BFSP1 and HSP90α in the blots were normalized with that of β‐Actin. F) Representative images of HSP90α localization in the spindle region in control and BFSP1‐KD oocytes. Scale bars, 20 µm, 10 µm. Data in (C) and (E) were expressed as mean ± SEM of at least three independent experiments. *** P < 0.001; ns, no significance.

Similar articles

References

    1. Parekh S. H., Chaudhuri O., Theriot J. A., Fletcher D. A., Nat. Cell Biol. 2005, 7, 1219. - PubMed
    1. Gao J., Nakamura F., J. Biomed Res. 2024, 39, 20240193.
    1. Romet‐Lemonne G., Leduc C., Jegou A., Wioland H., Annu. Rev. Biophys. 2025. - PubMed
    1. Coelho‐Rato L. S., Parvanian S., Andrs Salajkova S., Medalia O., Eriksson J. E., J. Cell Sci. 2024, 137, jcs261386. - PubMed
    1. Kechagia Z., Eibauer M., Medalia O., Curr. Opin. Cell Biol. 2024, 89, 102375. - PubMed

MeSH terms

Substances

LinkOut - more resources