. 2025 May 27;44(5):115680.
doi: 10.1016/j.celrep.2025.115680. Epub 2025 May 9.

Temporally discordant chromatin accessibility and DNA demethylation define short- and long-term enhancer regulation during cell fate specification

Affiliations

Temporally discordant chromatin accessibility and DNA demethylation define short- and long-term enhancer regulation during cell fate specification

Lindsey N Guerin et al. Cell Rep. .

Abstract

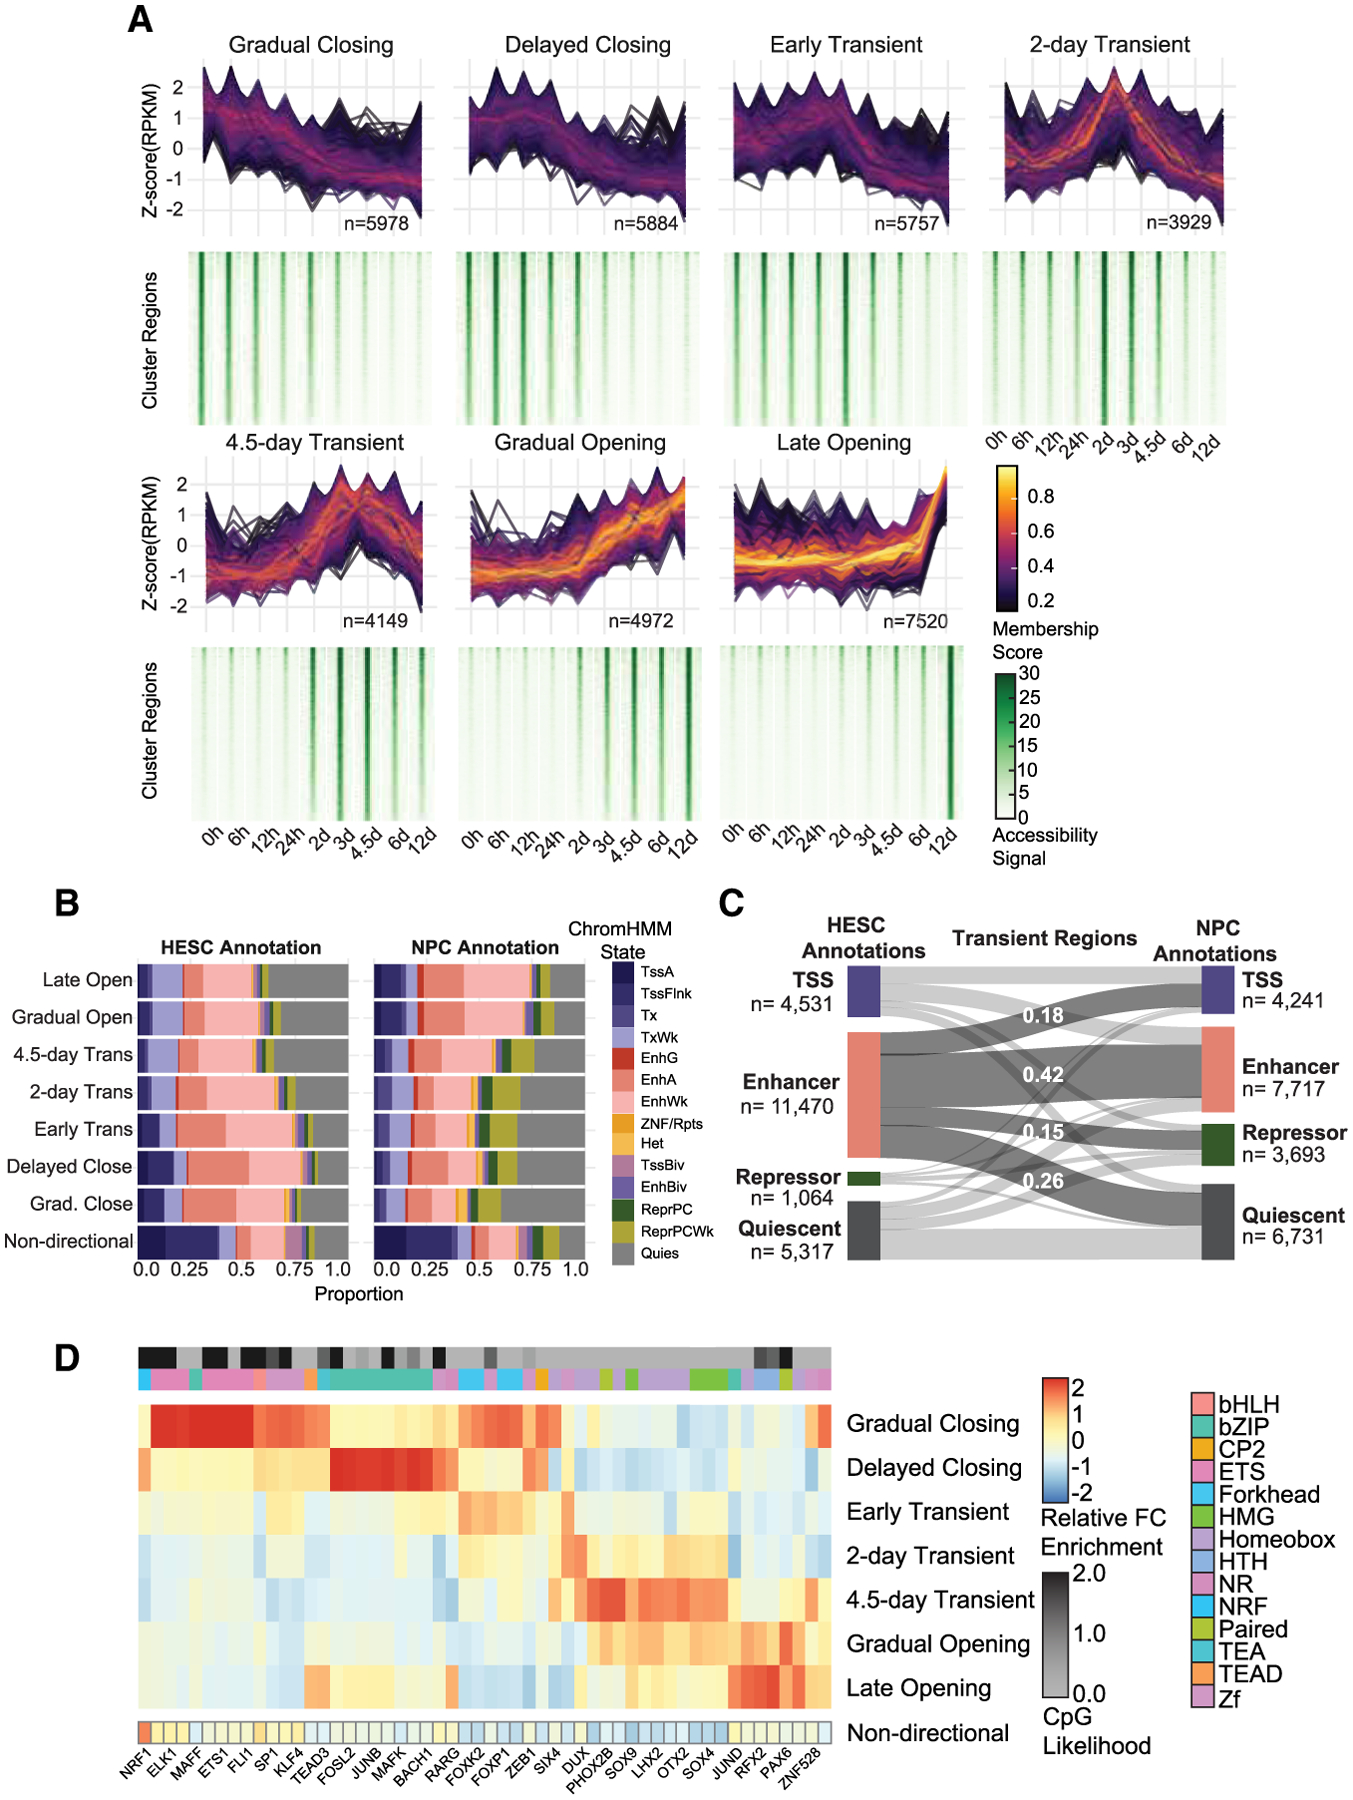
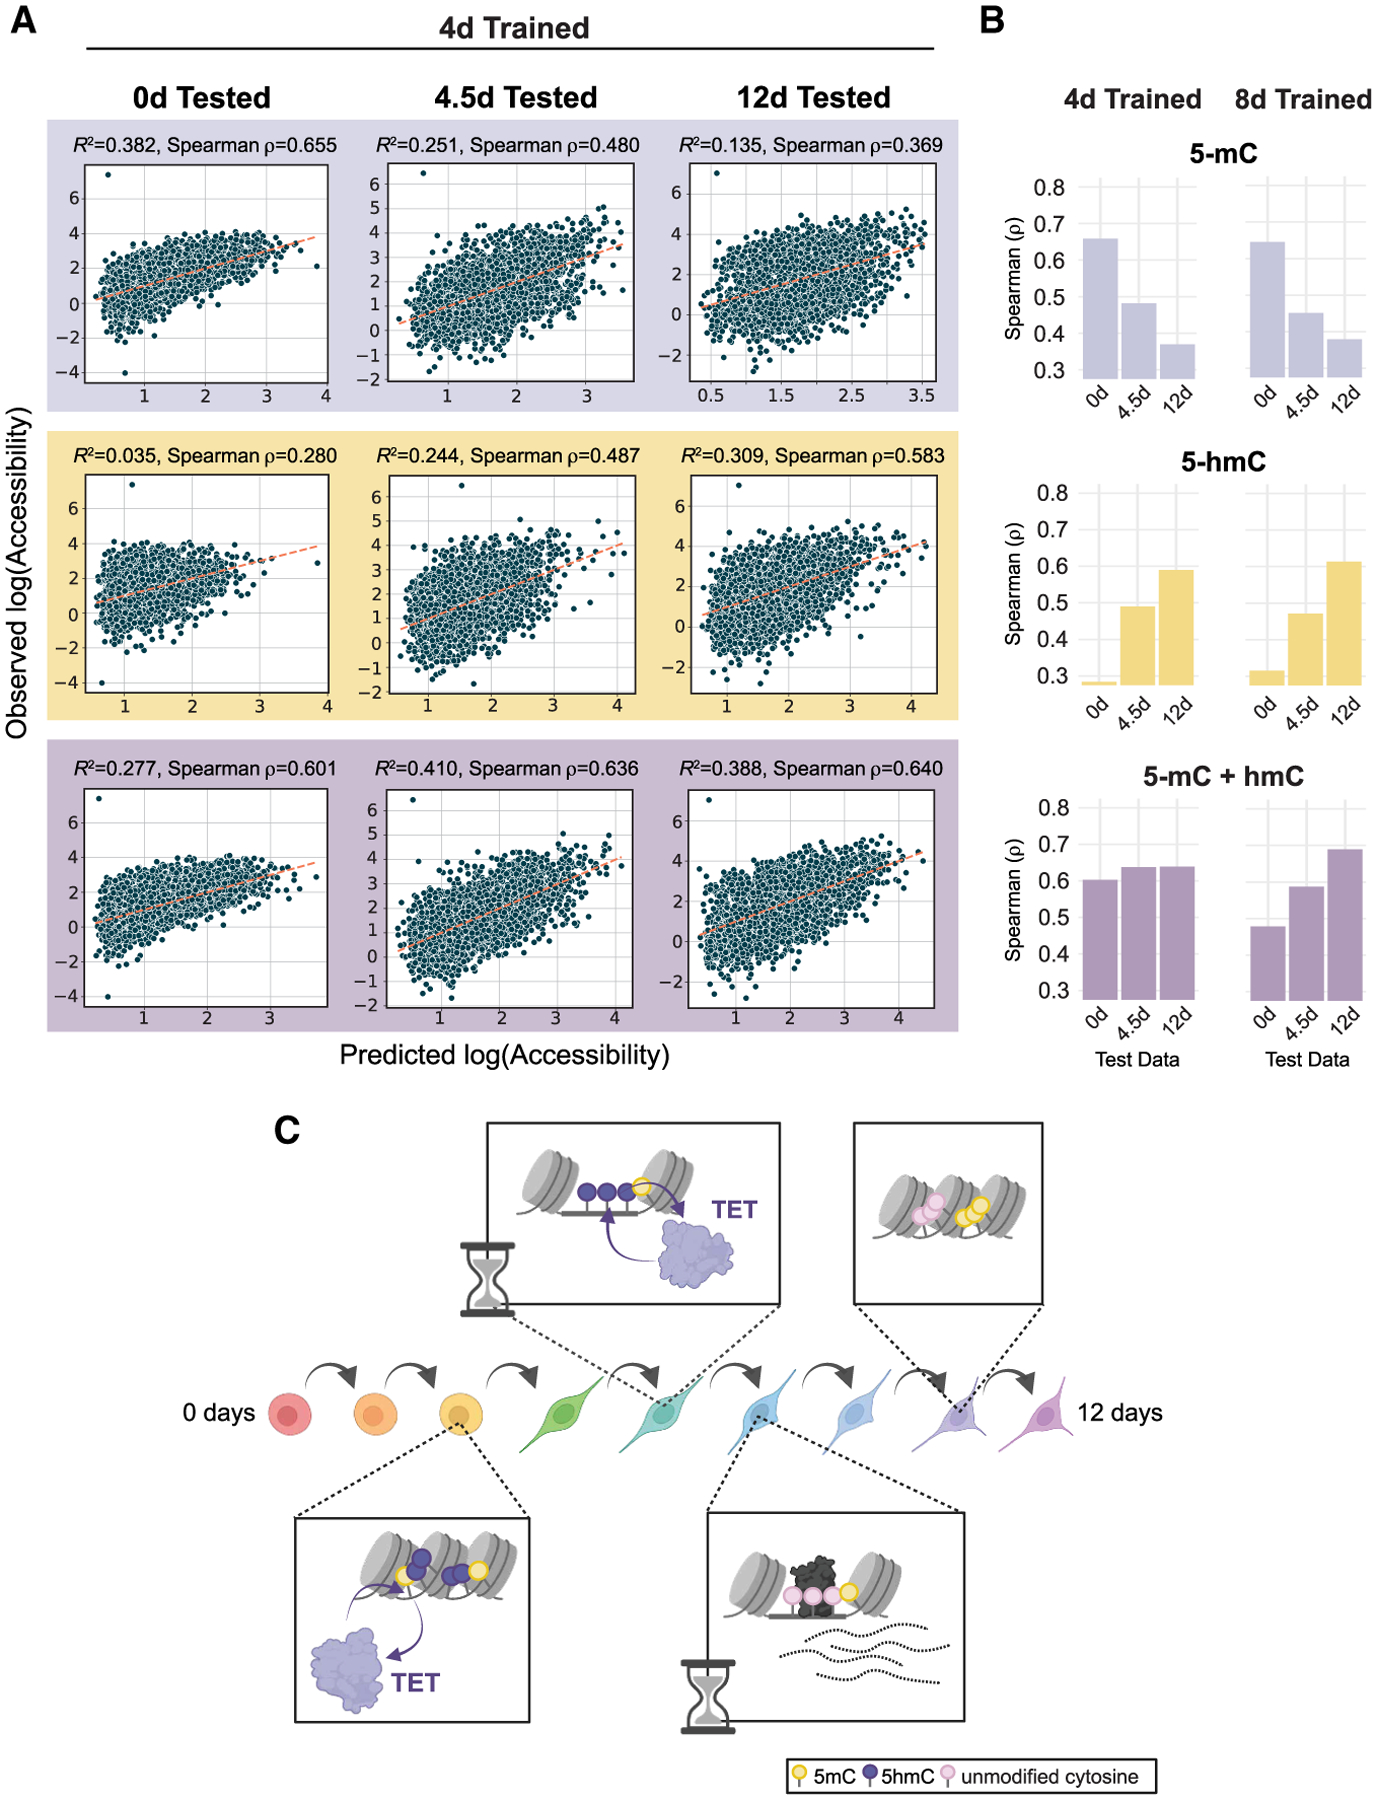
Chromatin and DNA modifications mediate the transcriptional activity of lineage-specifying enhancers, but recent work challenges the dogma that joint chromatin accessibility and DNA demethylation are prerequisites for transcription. To understand this paradox, we established a highly resolved timeline of their dynamics during neural progenitor cell differentiation. We discovered that, while complete demethylation appears delayed relative to shorter-lived chromatin changes for thousands of enhancers, DNA demethylation actually initiates with 5-hydroxymethylation before appreciable accessibility and transcription factor occupancy is observed. The extended timeline of DNA demethylation creates temporal discordance appearing as heterogeneity in enhancer regulatory states. Few regions ever gain methylation, and resulting enhancer hypomethylation persists long after chromatin activities have dissipated. We demonstrate that the temporal methylation status of CpGs (mC/hmC/C) predicts past, present, and future chromatin accessibility using machine learning models. Thus, chromatin and DNA methylation collaborate on different timescales to shape short- and long-term enhancer regulation during cell fate specification.

Keywords: 5-hydroxymethylation; 6-base sequencing; ATAC-Me; CP: Developmental biology; CP: Molecular biology; DNA methylation; chromatin accessibility; differentiation; enhancers; epigenetics; machine learning; neural progenitor cells.


Conflict of interest statement

Declaration of interests F.P., A.J., and T.C. are employees of biomodal, formerly Cambridge Epigenetix.

Figures

Figure 1.
Figure 1.. Directed differentiation of HESCs to NPCs displays extensive DNA demethylation within chromatin accessibility loci
(A) The experimental design consists of four main steps: HESCs are differentiated to NPCs for 12 days and samples are collected at nine time points. DNA fragments are isolated from Tn5-accessible chromatin followed by sodium bisulfite conversion to quantify the methylation state of open chromatin regions. (B) UMAPs (uniform manifold approximation and projection) of single-cell RNA-seq data for samples analyzed at 0, 2, and 6 days of differentiation. Groups (batches) segregate according to time point and homogeneously express markers of ESCs (OCT4), intermediate NPCs (LHX5), and differentiated NPCs (PAX6). Marker gene overlays are scaled by normalized and transformed read count values. (C) UCSC Genome Browser tracks display ATAC-Me-derived DNAme and ChrAcc measurements at the GLI3 locus. Gray boxes highlight two regions that gain accessibility and lose DNAme. The fraction methylated reads at each CpG site are represented by the height of the green bars. Accessibility is represented by normalized read counts shown in gray. Both tracks are merged signals of two replicates. (D) Heatmaps display the ChrAcc and ATAC-Me DNAme (5-mC + 5-hmC) signal, binned into 25- and 50-bp bins, respectively, of all dynamic ChrAcc peaks at each time point. Regions are scaled to 500 bp and sorted by decreasing normalized read count signal intensity at the 0-h time point, and the flanking distance is ±0.3 and 1 kb for ChrAcc and DNAme, respectively. (E) Proportion of dynamic (n = 38,189) and non-directional (n = 63,026) regions annotated to genomic region classes is shown. Annotation distance to the transcription start site (TSS) is as follows: promoter, ≤2 kb, and downstream (of gene end), ≤ 300 kb. Related to Figure S1.
Figure 2.
Figure 2.. Unsupervised clustering of chromatin accessibility reveals temporally distinct regulatory groups with divergent changes in enhancer states
(A) ChrAcc regions with differential accessibility over time (|log2-fold| > 2, adjusted p < 0.05) were clustered using fuzzy C-means clustering. The standard difference of normalized ATAC-Me signal intensity (Z score) over time for each region within a cluster is shown, with line color representing the membership score defined by that cluster. Heatmaps displaying the normalized accessibility signal across the cluster regions for each time point are shown below. Regions are scaled to 450 bp, with a flanking distance of ±0.6 kb, and signal is binned into 10-bp bins. (B) Chromatin state annotations of cluster regions using the chromHMM, 18-state annotations from HESCs and NPCs. The proportion of regions in each state for the cluster is displayed. (C) A Sankey plot displays the change in regions’ chromatin states from the HESC to the NPC stages for all “transient” regions. (D) Motif enrichment was performed for each dynamic ChrAcc group using HOMER. The relative enrichment (Z score of enrichment values across all dynamic clusters) of the topmost variable TFs is shown and is filtered for motif redundancy. For a comprehensive list, see Table S3. The TF family and CpG likelihood for each TF consensus motif as calculated by Motto are shown. Related to Figure S2.
Figure 3.
Figure 3.. DNAme dynamics are unidirectional and temporally discordant with chromatin accessibility
(A) Dual-axis boxplots of accessibility signal distribution (normalized read counts, blue) for each time point grouped by dynamic TC-seq clusters. The corresponding average proportion ATAC-Me DNAme (5-mC + 5-hmC) distribution across each region group and time point is shown in gold. The boxplots display the distribution of ATAC-Me DNAme and accessibility signal, and the line overlay represents the mean at each time point. (B) The proportion of regions within each accessibility cluster that experience a gain, loss, or no change in methylation over time. “Stable” regions represent <10% change and “lose” or “gain” regions represent at least 10% change between 0- and 12-day time points in either direction. (C) The temporal relationship between accessibility and methylation behaviors represented by a Sankey plot. Clusters were grouped by their dominant accessibility trend (i.e., opening, transient, and closing), while the methylation classification from (B) was maintained. (D) Regional ATAC-Me DNAme (5-mC + 5-hmC) and accessibility are displayed for all dynamic accessible regions. Heatmaps are grouped by accessibility subgroup and then methylation behavior; the methylation classification from (B) was maintained. Yellow boxes highlight regions that display discordant epigenetic states by the end of the time course. Regions are scaled to 450 ± 0.6 kb. Accessibility signal is binned into 10-bp bins, and DNAme is binned into 75-bp bins. (E) The boxplots display the distribution of proportion of 5-mC determined by whole-genome 6-base sequencing across regions contained in each ChrAcc cluster. Boxplots represent the distribution of proportion of 5-mC for all regions in the cluster. Data represent the combined average of two biological replicates. Individual replicates’ mean values are represented by colored dots. Related to Figure S3.
Figure 4.
Figure 4.. Enhancer demethylation appears prior to, and is maintained independent of, TF binding
(A) Heatmaps display cut-site signal, binned in 5-bp bins, centered around TF footprint sites containing POU family motifs ± 200 bp in reference-point mode. Footprint sites are defined by POU motif sequences ± 50 bp. Regions are grouped by previously defined accessibility clusters and organized within each cluster according to descending cut-site signal intensity. Horizontal bars indicate the larger subgroups defined by accessibility behavior over the time course. (B) The DNAme heatmap displays the corresponding proportion of methylation at each CpG site, binned into 50-bp bins, within the footprint site ± 1 kb in reference-point mode. Regions are sorted according to (A). (C) Heatmap displays TF expression determined by RNA-seq for all TFs expressed at any time point. Normalized read counts, fragments per kilobase of transcript per million mapped reads (FPKM), are scaled by row and ordered by hierarchical clustering. Vertical gray bars define six groups with specific temporal expression patterns. Select TFs are labeled to the right of their respective rows. (D and E) Line plots show regional methylation values (ATAC-Me DNAme [5-mC + 5-hmC]) averaged across binding sites over time, visualized by TF binding behavior. The dots represent the time point of the TF binding event or the time point at which a motif transitions from being bound to unbound (lose events, D) or vice versa (gain events, E). Standard deviations for the average proportion ATAC-Me DNAme displayed in the line plots are shown in Figures S4D and S4E. Data represent the combined average of two biological replicates. Related to Figure S4.
Figure 5.
Figure 5.. Early and sustained accumulation of 5-hmC demarcates demethylation timing at lineage-specifying enhancers
(A) Dotted line plot shows the average global %5-hmC of three biological replicates measured by ELISA at nine time points. Individual biological replicates are shown as black dots. (B) Boxplots display the distribution of 5-hmC signal for biological replicates (n = 6 for HESC and 4.5 days, n = 7 for 8 days) across cell-cycle stages for each time point measured by immunostaining and flow cytometry. Dots represent the transformed ratio of individual biological replicates. The transformed ratio was calculated by sample group (time point, see STAR Methods). Events were gated into cell-cycle stage using propidium iodide (PI)/BrdU staining, which is shown in Figure S5B. ANOVA and Tukey HSD were used to compare 5-hmC across cell-cycle stages (p < 2e–16 for all comparisons). (C) Boxplots show distribution of proportion of 5-hmC determined by 6-base sequencing at CpG sites within accessible peaks at 2, 4, and 8 days. Data represent two biological replicates. Individual replicates’ mean values are represented by colored dots (***p < 2.2 × 10⁻¹⁶, 0–4 days, Wilcoxon rank-sum test, and ***p = 9.108 × 10⁻⁸, 4–8 days, Wilcoxon rank-sum test). (D) Boxplots display the distribution of average proportion of 5-hmC of CpG sites across regions in each accessibility cluster. Thumbnail visualizations of accessibility signal for each cluster are displayed. Individual biological replicate means are displayed as points within the boxplot for (C) and (D). (E and F) Representative traces for (E) proportion of 5-hmC and (F) proportion of 5-mC at three genomic loci displaying different types of 5-hmC changes between the three time points. (G) The change in proportion of 5-hmC was calculated for ChrAcc regions in three representative dynamic ChrAcc clusters. Each value represents the mean change across all regions in the cluster. Data represent the combined average of two biological replicates. “Total” represents the difference between 8- and 0-day time points, “0–4 days” represents the difference between 4- and 0-day time points, and “4–8 days” represents the difference between 8- and 4-day time points. (H) The proportion of non-directional and dynamic ChrAcc regions with high or low 5-hmC within at each 6-base time point. Regions with an average regional 5-hmC ≥0.106 (top 25% of regional 5-hmC fractions) across replicates were termed “high,” and regions with an average regional 5-hmC <0.106 across replicates were termed “low.” Data represent the combined average of two biological replicates. (I) Heatmap displaying motif enrichment for 5-hmC high and 5-hmC low regions at each time point. Motif enrichment is displayed as the fold change over background and is scaled by TF across each row. Gray boxes represent values that were not significant (>0.05) at the respective time point. (J) Aggregate profiles display 5-hmC signal at TF footprints for the JASPAR root cluster containing BHLHA15 (shown to the left). TF footprinting and binding state designation was performed using 4.5-day data. Profiles display signal at footprint sites ± 1,000 bp in reference-point mode. Signal is binned into 25-bp bins. Related to Figure S5.
Figure 6.
Figure 6.. Chromatin accessibility prediction by machine learning
(A) Scatterplots display the observed accessibility vs. the predicted accessibility for machine learning models trained on 4-day 5-mC alone, 5-hmC alone, and 5-mC + 5-hmC data and tested on each time point. Spearman’s correlation coefficient is shown for each model. Dotted lines are defined by the slope between the points (minimum predicted value, minimum predicted value) and (maximum predicted value, maximum predicted value) in each scatterplot. (B) Bar plots of Spearman’s ρ values (predicted vs. observed accessibility) for dynamic accessibility region models trained on 4- or 8-day methylation data. Models were tested on all three time points. Plots are divided by which methylation states were used for fitting. (C) A representative schematic of the molecular timeline proposed in this study. Methylated CpGs in NPC enhancers initially become oxidized to 5-hmC (purple lollipops) during activation. This is accompanied by increases in accessibility and further oxidation, resulting in subsequent demethylation. Both the initial demethylation steps and the completion of the demethylation cycle are discretely timed events. Decommissioned enhancers lose TF binding and ChrAcc but remain hypomethylated. Related to Figure S6.

Update of

References

    1. Barnett KR, Decato BE, Scott TJ, Hansen TJ, Chen B, Attalla J, Smith AD, and Hodges E (2020). ATAC-Me Captures Prolonged DNA Methylation of Dynamic Chromatin Accessibility Loci during Cell Fate Transitions. Mol. Cell 77, 1350–1364.e6. 10.1016/j.molcel.2020.01.004. - DOI - PMC - PubMed
    1. Kreibich E, Kleinendorst R, Barzaghi G, Kaspar S, and Krebs AR (2023). Single-molecule footprinting identifies context-dependent regulation of enhancers by DNA methylation. Mol. Cell 83, 787–802.e9. 10.1016/j.molcel.2023.01.017. - DOI - PubMed
    1. Luo C, Hajkova P, and Ecker JR (2018). Dynamic DNA methylation: In the right place at the right time. Science 361, 1336–1340. 10.1126/science.aat6806. - DOI - PMC - PubMed
    1. Greenberg MVC, and Bourc’his D (2019). The diverse roles of DNA methylation in mammalian development and disease. Nat. Rev. Mol. Cell Biol 20, 590–607. 10.1038/s41580-019-0159-6. - DOI - PubMed
    1. Cusack M, King HW, Spingardi P, Kessler BM, Klose RJ, and Kriaucionis S (2020). Distinct contributions of DNA methylation and histone acetylation to the genomic occupancy of transcription factors. Genome Res. 30, 1393–1406. 10.1101/gr.257576.119. - DOI - PMC - PubMed

LinkOut - more resources