. 2025 Jun:83:103662.
doi: 10.1016/j.redox.2025.103662. Epub 2025 May 7.

Sex- and age-dependent neurovascular abnormalities linked to neuroinflammation lead to exacerbated post-ischemic brain injury in Marfan syndrome mice

Affiliations

Sex- and age-dependent neurovascular abnormalities linked to neuroinflammation lead to exacerbated post-ischemic brain injury in Marfan syndrome mice

Gemma Manich et al. Redox Biol. 2025 Jun.

Abstract

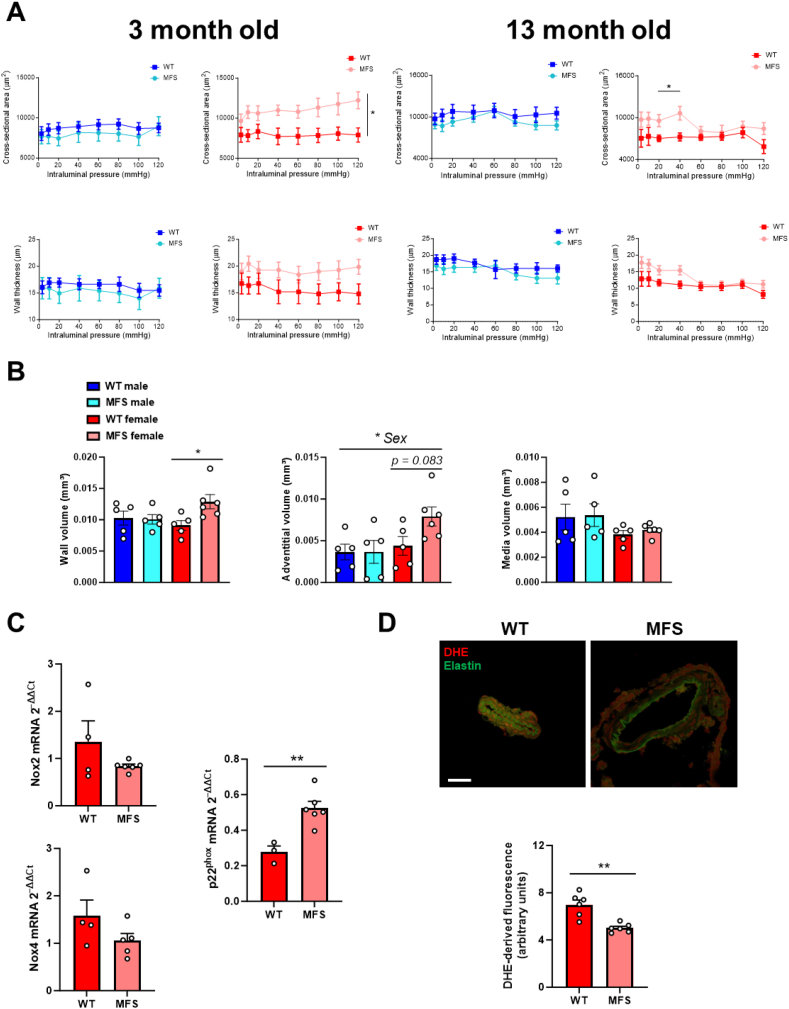
Fibrillin 1 gene (Fbn1) mutations cause Marfan syndrome (MFS), triggering life-threatening aortic complications and multi-organ effects. MFS is increasingly linked to neurovascular complications, amplified by aortic surgery risks. However, the impact of MFS on the brain remains unclear, including the roles of sex, aging, and their contribution to cerebral injury. This study examines brain alterations and their role in cerebral ischemic injury in an MFS mouse model. RNA-seq analysis of young (3-month-old) and aged (13-month-old) male and female wild-type and MFS (Fbn1C1041G/+) mice revealed disruptions in TGF-β and extracellular matrix (ECM) pathways in MFS brains, most pronounced in young males and aged females with reduced estrogen levels. Inflammatory pathways were upregulated across all MFS mice. Consequently, changes in TGF-β signaling, ECM turnover, redox stress and inflammatory pathways were assessed through RT-qPCR, immunostaining, Western blot, lucigenin chemiluminescence, spectrophotometry, HPLC, and synchrotron radiation-based microspectroscopy, while cerebrovascular properties were assessed by pressure myography and confocal microscopy in the basilar artery. Aged MFS mice showed decreased brain TGF-β1 levels, while dysregulated collagen turnover was only observed in female MFS mice. Despite increased NADPH oxidase activity and redox damage in the corpus callosum of male MFS mice, brain redox stress levels remain largely unchanged. Young female MFS mice exhibited hypertrophic remodeling of the basilar artery. Remarkably, neuroinflammation driven by reactive gliosis increased in MFS mice, regardless of sex and age. To determine the impact on ischemic vulnerability, young mice underwent bilateral common carotid artery occlusion (5 min)/reperfusion (3 days). MFS mice showed greater post-ischemic brain damage, evidenced by worsened behavioral impairments, hippocampal neurodegeneration, and neuroinflammation. This study identifies sex- and age-dependent disruptions in TGF-β1, ECM, and cerebrovascular integrity in MFS mice. Persistent neuroinflammation and increased vulnerability to post-ischemic brain injury suggests that MFS patients, alongside well-documented aortic complications, have an intrinsic predisposition to cerebral damage.

Keywords: Extracellular matrix; Ischemic brain injury; Marfan syndrome; Neuroinflammation; Neurovascular complications; fibrillin 1.


Conflict of interest statement

Declaration of competing interest The authors declare that the research was conducted in the absence of any commercial or financial relationships that could be interpreted as a potential conflict of interest.

Figures

Image 1
Graphical abstract
Fig. 1
Fig. 1
Gene set enrichment analysis (GSEA) in brains from 3- and 13-month-old male and female wild-type (WT) and Marfan syndrome (MFS) mice. (A) Bar plots showing selected statistically significant REACTOME pathways. GSEA normalized enrichment scores (NES) are represented on the x-axis and in a color gradient. (B) Dot plot of combined GSEA results illustrating selected REACTOME TGF-β-related pathways. The color gradient indicates the negative to positive NES change, dot size illustrates absolute NES values, and dot transparency indicates whether the result has an adjusted p-value (padj) below or equal 0.1. N = 4 per experimental group.
Fig. 2
Fig. 2
Expression of some representative transforming growth factor (TGF)-β signaling proteins and genes in brains from 3- and 13-month-old male and female wild-type (WT) and Marfan syndrome (MFS) mice. (A) Western blot analysis for phosphorylated SMAD2 (pSMAD2; above) and phosphorylated ERK1/2 (pERK 1/2; below) protein expression in the brain. Bar graphs show the results of densitometric analyses from pooled data. (B) Brain TGF-β1 mRNA expression levels. (C) Representative images of TGF-β1 immunostainings in brain hippocampus. Bar graphs show the results of the intensity of TGF-β1 immunostaining in brain hippocampus obtained by densitometry. Scale bar, 50 μm. Results are the mean ± SEM with each data point representing an animal. ∗p < 0.05 by three-way ANOVA with Tukey's post-hoc test.
Fig. 3
Fig. 3
Expression of some representative ECM turnover proteins in brains from 3- and 13-month-old male and female wild-type (WT) and Marfan syndrome (MFS) mice. (A) Western blot analysis for collagen I (COL-1) and (B) pro-matrix metalloproteinase (MMP) 9 (above) and active MMP9 (below) protein expression. Bar graphs show the results of densitometric analyses from pooled data. Results are the mean ± SEM with each data point representing an animal. ∗p < 0.05, ∗∗p < 0.01, ∗∗∗p < 0.001 by three-way ANOVA with Tukey's post-hoc test.
Fig. 4
Fig. 4
Levels and activity of some representative redox markers measured in brains from 3- and 13-month-old male and female wild-type (WT) and Marfan syndrome (MFS) mice. (A) NADPH oxidase isoforms Nox1, Nox2, and Nox4 mRNA expression levels. ∗p < 0.05 by three-way ANOVA with Tukey's post-hoc test. (B) Representative chemiluminescence tracing (left) and the areas under the curve (AUC) of NADPH-dependent O2 production in brains from 3-month-old male and female WT and MFS mice. RLU, relative light units. ∗∗p < 0.01, ∗∗∗p < 0.001 by two-way ANOVA with Tukey's post-hoc test. (C) Spermine concentrations measured by HPLC. Results are the mean ± SEM. Data points represent the number of animals. ∗p < 0.05 by three-way ANOVA with Tukey's post-hoc test.
Fig. 5
Fig. 5
Blood estradiol levels and estrus cycle duration in 3- and 13-month-old female wild-type (WT) and Marfan syndrome (MFS) mice. (A) Estradiol concentrations in plasma measured by spectrophotometry. (B) Duration of the estrous cycle. Results are the mean ± SEM with each data point representing an animal. ∗p < 0.05, ∗∗p < 0.01 by two-way ANOVA with Tukey's post-hoc test.
Fig. 6
Fig. 6
Representation of the aldehyde band (C═O) in the infrared spectra, normalized by the CH2 band (estimation of the total lipid content) as a measure of lipid oxidation using μSR-FTIR. The intensity of the bands was measured from the second derivative (d2A) of the spectra in (A) corpus callosum, (B) cortex, and (C) hippocampus from 3-, 7-, and 13-month-old male and female wild-type (WT) and Marfan syndrome (MFS) mice. Different colors identify male and female WT and MFS groups. On the right, data from all ages are combined and separated by sex and genotype (MFS). Results are median [Q1; Q3] with each data point representing an animal. ∗p < 0.05 by two-way ANOVA with Tukey's post-hoc test.
Fig. 7
Fig. 7
Glial reactivity in 3-, 7-, and 13-month-old female and male wild-type (WT) and Marfan syndrome (MFS) mice. (A) Representative images of astrocytic GFAP immunostainings of 3 and 13-month-old female and male WT and MFS mice in brain cortex and hippocampus. Bar graphs show the results of GFAP immunostaining obtained by densitometry in 3-, 7-, and 13-month-old female and male WT and MFS mice. Representative GFAP-positive astrocytes are indicated with arrowheads in the cortex. Scale bar, 50 μm. (B) C3 and S100A mRNA expression levels. (C) Representative images of microglial Iba-1 immunostaining of 3 and 13-month-old female and male WT and MFS mice in brain cortex and hippocampus. Bar graphs show the results of Iba-1 immunostaining obtained by densitometry in 3-, 7-, and 13-month-old female and male WT and MFS mice. Scale bar, 50 μm. Results are the mean ± SEM. Data points represent the number of animals. ∗p < 0.05, ∗∗p < 0.01, ∗∗∗p < 0.001 by three-way ANOVA with Tukey's post-hoc test.
Fig. 8
Fig. 8
Structural properties, cell nuclei distribution, mRNA expression levels of the NADPH oxidase isoforms Nox2 and Nox4, and NADPH oxidase subunit p22phox, and dihydroethidium (DHE)-derived fluorescence in cerebral arteries from 3- and 13-month-old male and female wild-type (WT) and Marfan syndrome (MFS) mice. (A) Basilar artery cross-sectional area (CSA)-intraluminal pressure and wall thickness-intraluminal pressure under passive conditions (0 Ca2+-Krebs-Henseleit solution). Results are the mean ± SEM of n = 7–8 (WT male), n = 5 (MFS male), n = 4–6 (WT female), and n = 5–8 (MFS female). ∗p < 0.05 (3-month-old) by repeated measures two-way ANOVA (genotype factor) or ∗p < 0.05 (13-month-old) by repeated measures two-way ANOVA with Bonferroni's post-hoc test. (B) Comparative analysis of cell nuclei distribution by confocal microscopy in basilar arteries of 3-month-old male and female WT and MFS mice. Results are the mean ± SEM with each data point representing an animal. ∗p < 0.05 by two-way ANOVA with Bonferroni's post-hoc test. (C) Nox2, Nox4, and p22phox mRNA expression levels in cerebral arteries of 3-month-old female WT and MFS mice. Results are the mean ± SEM with each data point representing an animal. ∗∗p < 0.01 by the unpaired Student's t-test. (D) Representative photomicrographs (top) and quantification (bottom) of fluorescence (red) intensity in confocal basilar artery sections from 3-month-old female WT and MFS mice labeled with the oxidative dye DHE. Natural autofluorescence of elastin (green) is also shown. Scale bar, 50 μm. Results are the mean ± SEM with each data point representing an animal. ∗∗p < 0.01 by the unpaired Student's t-test.
Fig. 9
Fig. 9
Behavioral assessment and functional correlations between behavior and systolic blood pressure (SBP) and body weight (W) variables in 3-month-old male and female wild-type (WT) and Marfan syndrome (MFS) mice submitted to transient bilateral common carotid artery occlusion. (A) The horizontal and vertical activity ratio in the corner test (CT). (B) Horizontal activity ethogram on the open field (OF) test. (C) Bizarre behavior episodes during OF. Different colors identify male and female WT and MFS groups. Results are the mean ± SEM of 7–8 animals. ∗p < 0.05 by the unpaired Student's t-test. (D) Heat map of correlations between behavioral variables and SBP and W variables in the CT. (E) Heat map of correlations between behavioral variables and SBP and W variables in the OF. The color scale shows the correlation intensity between +1 and −1, with positive correlations in blue and negative in red. Additional heat maps of correlations are shown for both behavioral tests separated by genotype, WT (F and G), and MFS (H and I).
Fig. 10
Fig. 10
Hippocampal neuronal degeneration and neuroinflammatory response in 3-month-old male and female wild-type (WT) and Marfan syndrome (MFS) mice subjected to transient bilateral common carotid artery occlusion. (A) On the right are representative coronal sections of the mouse brain at the level of the hippocampus (adapted from the Allen Mouse Brain Atlas https://mouse.brain-map.org/static/atlas). The violet-shaded areas indicate the granular layer of the dentate gyrus, where Fluoro-Jade B fluorescent staining was performed. On the left are representative images of Fluoro-Jade B-positive degenerating neurons (green fluorescence). Yellow dashed lines delineate the granular layer of the dentate gyrus. Bar graphs show the density results of Fluoro-Jade B-positive neurons in the dentate gyrus. (B) Representative images of astrocytic GFAP immunostaining in the dentate gyrus. Bar graphs show the results of GFAP immunostaining obtained by densitometry. (C) Representative images of microglial Iba-1 immunostaining in the dentate gyrus. Bar graphs show the results of Iba-1 immunostaining obtained by densitometry. Results are the mean ± SEM. Data points represent the number of animals. ∗p < 0.05, ∗∗p < 0.01, ∗∗∗p < 0.001 by two-way ANOVA with Tukey's post-hoc test. Scale bar, 50 μm.

References

    1. Writing Committee Members, Isselbacher E.M., Preventza O., Hamilton Black J., 3rd, Augoustides J.G., Beck A.W., Bolen M.A., Braverman A.C., Bray B.E., Brown-Zimmerman M.M., Chen E.P., Collins T.J., DeAnda A., Jr., Fanola C.L., Girardi L.N., Hicks C.W., Hui D.S., Schuyler Jones W., Kalahasti V., Kim K.M., Milewicz D.M., Oderich G.S., Ogbechie L., Promes S.B., Ross E.G., Schermerhorn M.L., Singleton Times S., Tseng E.E., Wang G.J., Woo Y.J., Peer Review Committee Members, Faxon D.P., Upchurch G.R., Jr., Aday A.W., Azizzadeh A., Boisen M., Hawkins B., Kramer C.M., Luc J.G.Y., MacGillivray T.E., Malaisrie S.C., Osteen K., Patel H.J., Patel P.J., Popescu W.M., Rodriguez E., Sorber R., Tsao P.S., Santos Volgman A., Aha/Acc Joint Committee Members, Beckman J.A., Otto C.M., O'Gara P.T., Armbruster A., Birtcher K.K., de Las Fuentes L., Deswal A., Dixon D.L., Gorenek B., Haynes N., Hernandez A.F., Joglar J.A., Jones W.S., Mark D., Mukherjee D., Palaniappan L., Piano M.R., Rab T., Spatz E.S., Tamis-Holland J.E., Woo Y.J. ACC/AHA guideline for the diagnosis and management of aortic disease: a report of the American heart association/American college of cardiology joint committee on clinical practice guidelines. J. Thorac. Cardiovasc. Surg. 2022;166(5):e182–e331. doi: 10.1016/j.jtcvs.2023.04.023. 2023. - DOI - PMC - PubMed
    1. Pyeritz R.E., Loeys B. The 8th international research symposium on the marfan syndrome and related conditions. Am. J. Med. Genet. 2012;158A(1):42–49. doi: 10.1002/ajmg.a.34386. - DOI - PubMed
    1. Parlapiano G., Di Lorenzo F., Salehi L.B., Ruvolo G., Novelli G., Sangiuolo F. Neurovascular manifestations in connective tissue diseases: the case of Marfan Syndrome. Mech. Ageing Dev. 2020;191 doi: 10.1016/j.mad.2020.111346. - DOI - PubMed
    1. Kim S.T., Brinjikji W., Kallmes D.F. Prevalence of intracranial aneurysms in patients with connective tissue diseases: a retrospective study. AJNR Am J Neuroradiol. 2016;37(8):1422–1426. doi: 10.3174/ajnr.A4718. - DOI - PMC - PubMed
    1. Domingo R.A., Perez-Vega C., Tripathi S., Santos J.M., Ramos-Fresnedo A., Erben Y.M., Freeman W.D., Sandhu S.S., Huynh T., Williams L., Bendok B.R., Brinjikji W., Tawk R.G., Fox W.C. Intracranial aneurysms in patients with marfan syndrome: a multicenter propensity-matched analysis. World Neurosurg. 2021;155:e345–e352. doi: 10.1016/j.wneu.2021.08.065. - DOI - PubMed

MeSH terms

LinkOut - more resources