. 2025 Jun;301(6):110221.
doi: 10.1016/j.jbc.2025.110221. Epub 2025 May 9.

UCHL1 regulates adiponectin receptors in Sertoli cells to maintain testicular homeostatic balance

Affiliations

UCHL1 regulates adiponectin receptors in Sertoli cells to maintain testicular homeostatic balance

Donghui Yang et al. J Biol Chem. 2025 Jun.

Abstract

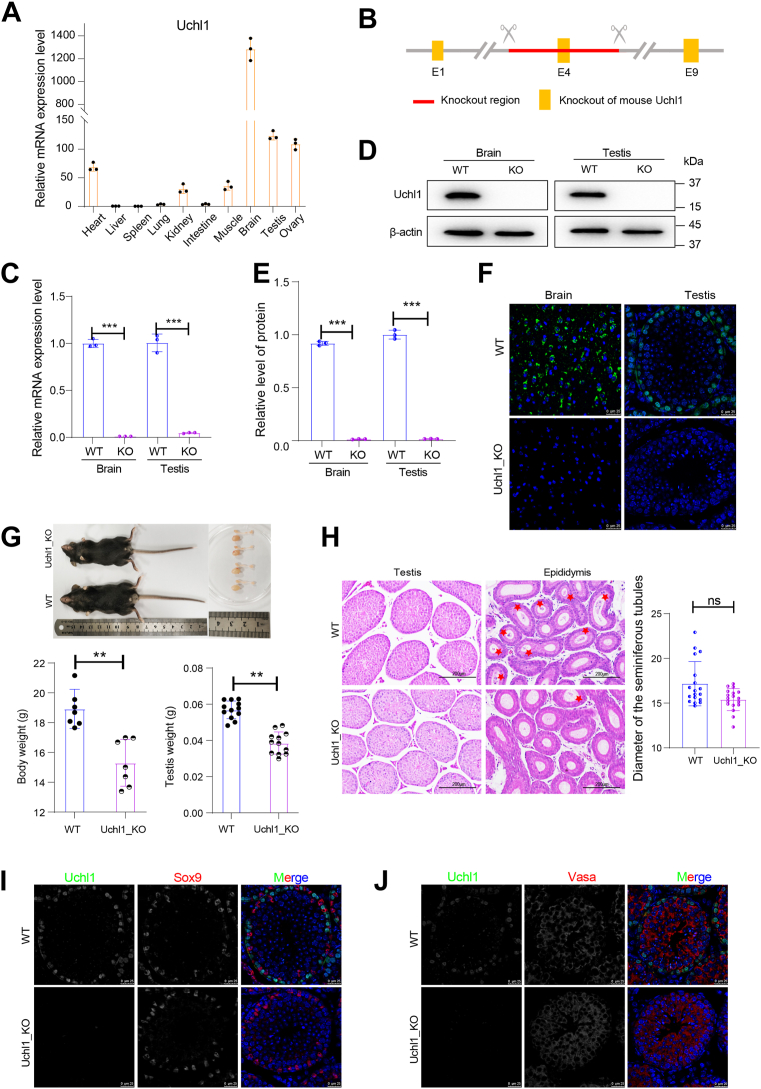
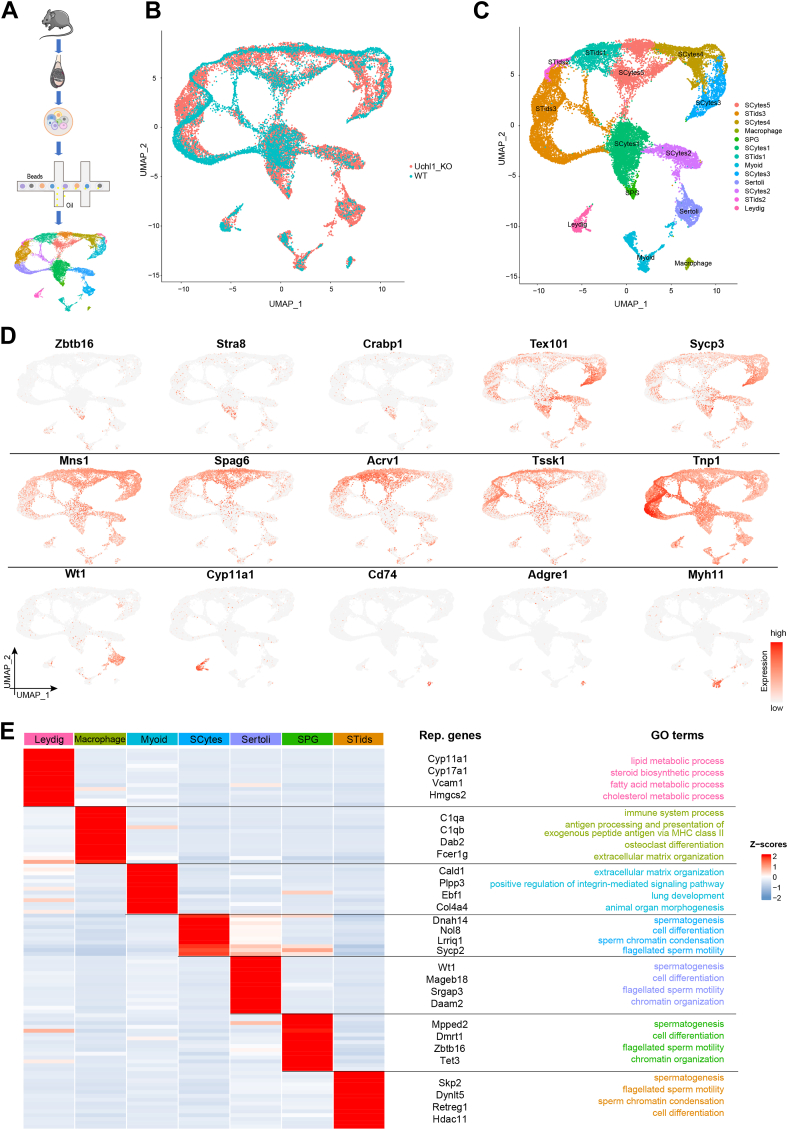
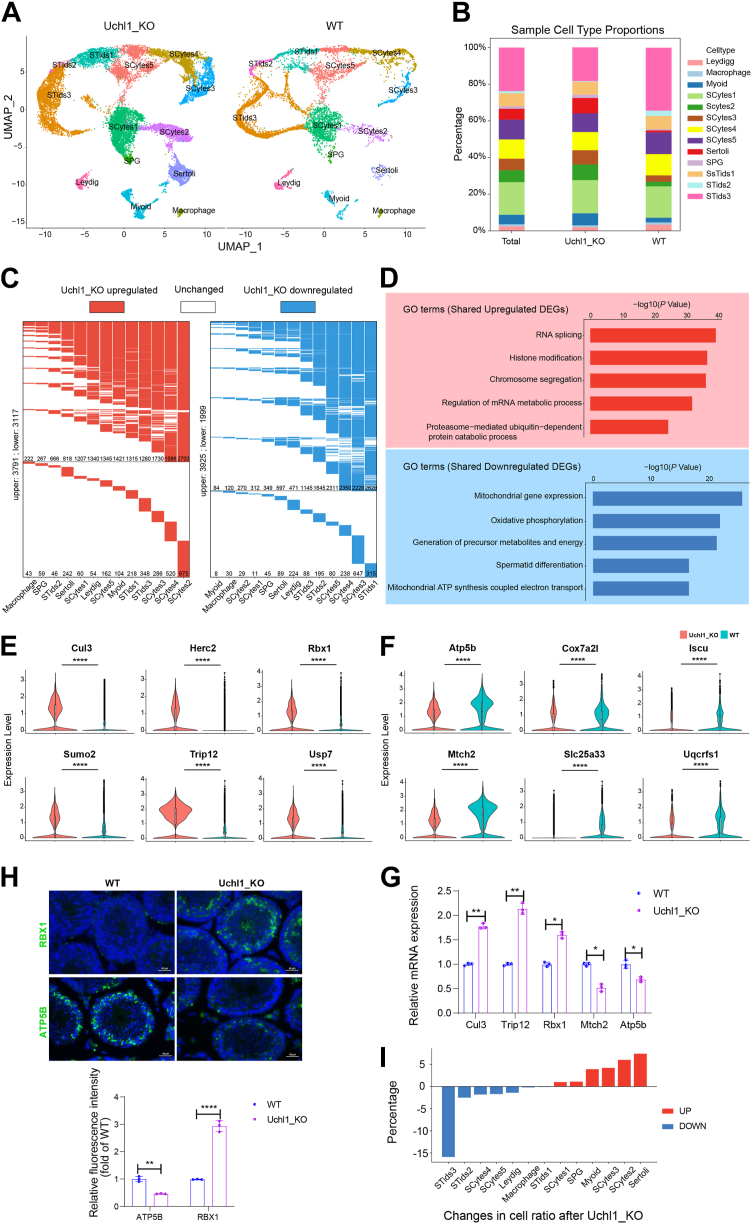
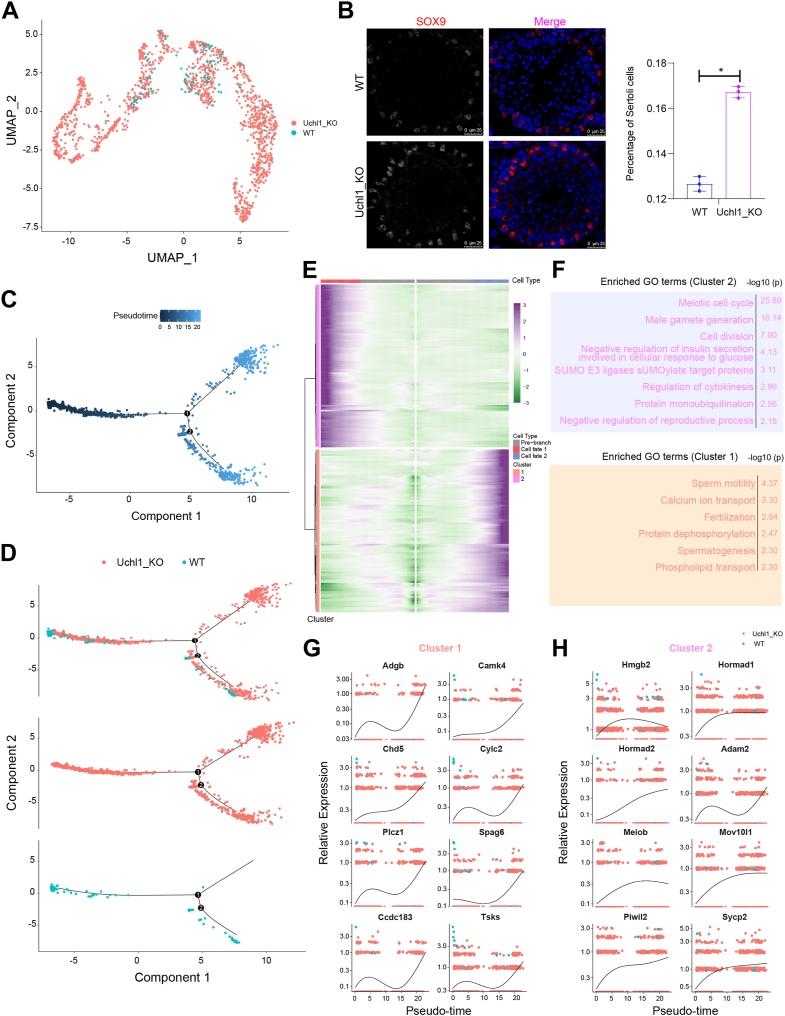
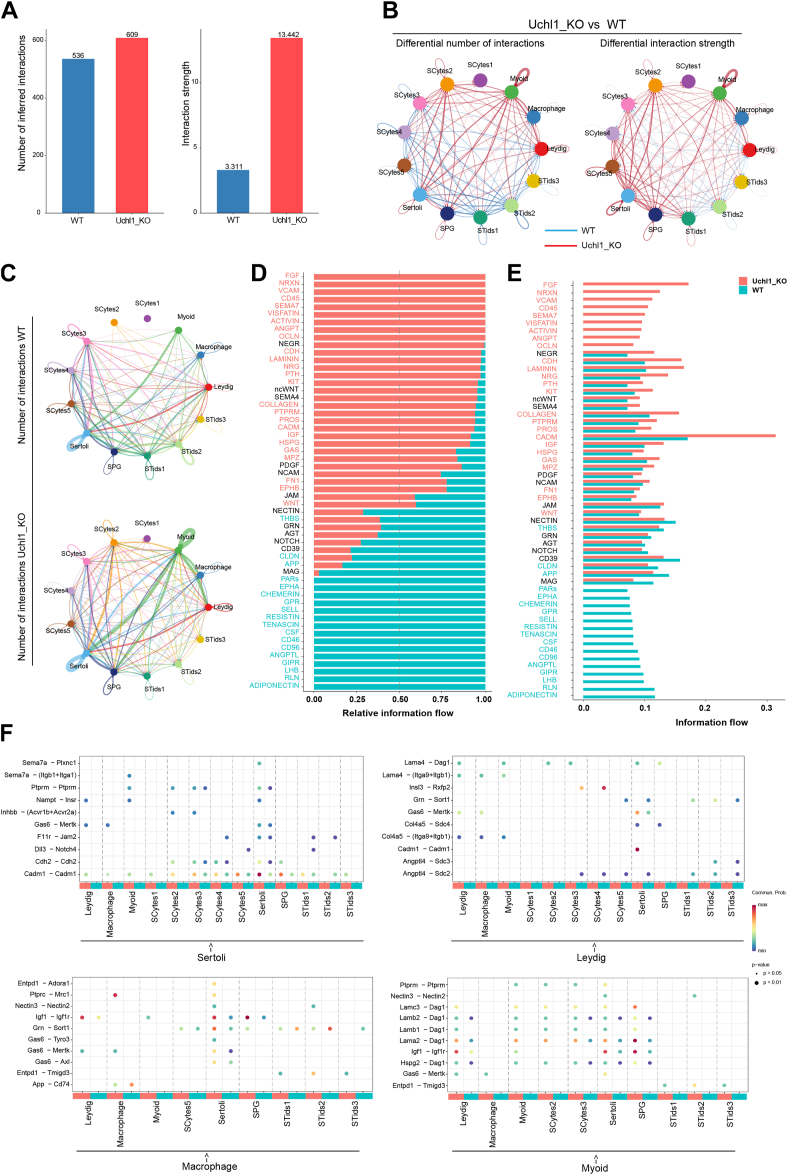
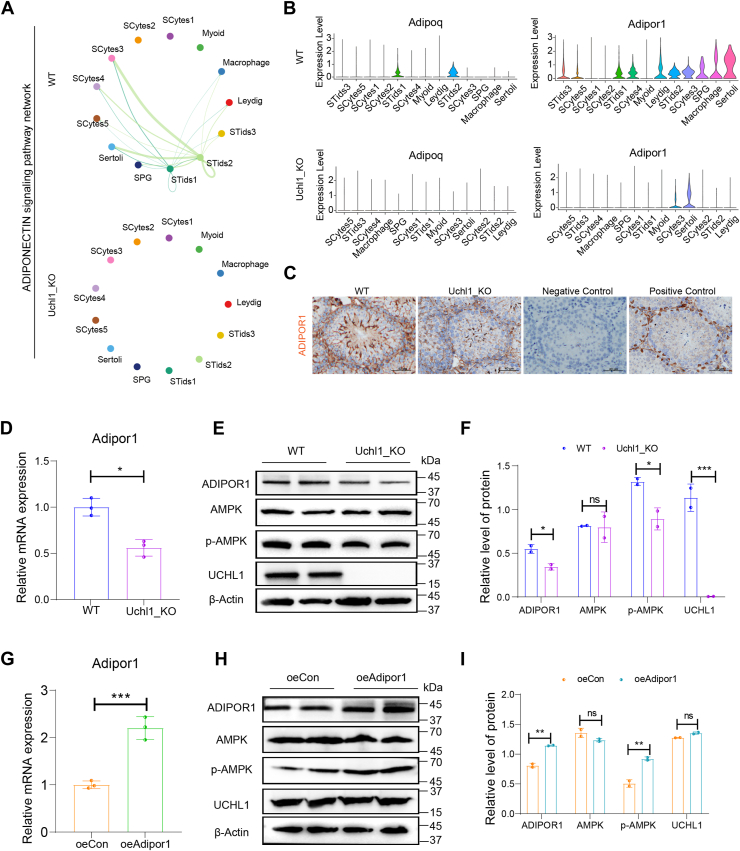
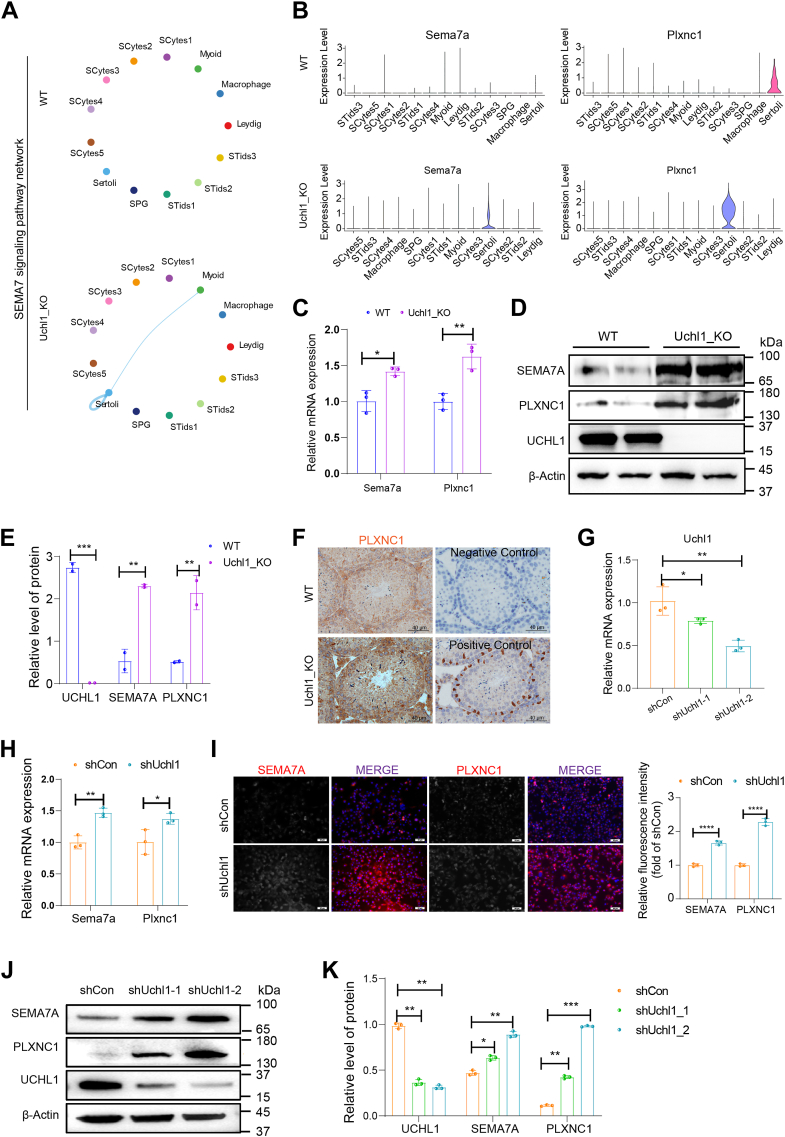
Disruptions in testicular homeostasis can lead to impaired spermatogenesis and male infertility. Such disturbances may result from various factors, including viral or bacterial infections, toxic injuries, and genetic mutations or deletions. The maintenance of testicular homeostasis is governed by a complex interplay of various cells, hormones, paracrine factors, genes, and enzymes. UCHL1, a member of the deubiquitinating enzyme family, is recognized for its role in neuronal function. However, its contribution to testicular homeostasis and spermatogenesis remains unclear. This study uncovers a critical role for Uchl1 in maintaining testicular homeostasis, acting as a regulatory switch for spermatogenesis. We demonstrate that Uchl1 knockout (Uchl1_KO) mice exhibit reduced body weight, decreased testicular specific gravity, and impaired spermatogenesis. Single-nucleus RNA sequencing (snRNA-seq) analysis of Uchl1_KO testes reveals a significant decrease in oxidative phosphorylation (OXPHOS) levels and an increase in Sertoli cell abnormalities. Notably, Uchl1_KO/knockdown downregulates metabolism-related adiponectin signaling (ADIPOR1/AMPK) and upregulates the inflammation-related SEMA7A/PLXNC1 pathway. Sertoli cell lines (oeAdipor1/shUchl1) confirm UCHL1's dual regulatory role in these signaling pathways in vitro experiments. Our findings identify UCHL1 as a key regulator of testicular homeostasis and spermatogenesis, and it dynamically controls the balance between metabolic and inflammatory signaling in the testis. This study provides a valuable theoretical foundation for exploring the molecular mechanisms underlying testicular homeostasis balance and for advancing human reproductive health.

Keywords: ADIPONECTIN; SEMA7A; Uchl1; homeostasis; snRNA-seq; spermatogenesis.


Conflict of interest statement

Conflict of interest The authors declare that they have no conflicts of interest with the contents of this article.

Figures

Figure 1
Figure 1
Phenotypic characterization of Uchl1_KO mice.A, analysis of Uchl1 gene expression across various tissues within the mouse body. B, knockout strategies for Uchl1_KO mice. C, detecting the changes in the mRNA expression of Uchl1 in brain and testis tissues from WT and Uchl1_KO mice by RT-qPCR. D, detecting the expression of Uchl1 at the protein level in the brain and testis of WT and Uchl1_KO mice via Western blot. E, the histograms showed quantitative results of Image J (V1.48d) gradation analysis for (D). F, IF staining to visualize the expression of Uchl1 proteins within the testes and brains of WT and Uchl1_KO mice, scale bar = 25 μm. G, evaluation of body and testis weight changes in both WT and Uchl1_KO mice. H, HE staining of the testes and epididymis from WT and Uchl1_KO mice. Note: Red asterisks denote the presence of sperm within the epididymal ducts. I and J, co-staining of UCHL1 with SOX9 and VASA in the testes of WT and Uchl1_KO mice using IF, scale bar = 25 μm. (Data are presented as means ± SD and represent three independent repetitions. ∗p < 0.05; ∗∗p < 0.01; ∗∗∗p < 0.001).
Figure 2
Figure 2
snRNA-seq profile of testicular cells from WT and Uchl1_KO mice.A, diagrammatic representation of the experimental workflow. B, UMAP plot illustrating the annotated testicular cell types derived from both WT and Uchl1_KO mice. Each point corresponds to an individual testicular cell, color-coded according to its source mouse. C, UMAP plot depicting all cell clusters identified through snRNA-seq. D, display of additional marker expressions that identify major testicular cell types overlaid on the UMAP plot. Colors indicate expression levels, with red (or gray) signifying high (or low) expression as per the color key located in the top right corner. E, left: Heatmap presenting the top 15 DEGs for each cell cluster as depicted in (C), the scaled gene expression levels are colored according to Z-score. Right: A list of the top 5 GO terms enriched among the marker genes for each cell cluster.
Figure 3
Figure 3
Differential analysis of WT and Uchl1_KO mouse cells. A, UMAP plots that depict the clustering annotations for Uchl1_KO and WT testicular cells, respectively. B, the count of distinct cell types presented between Uchl1_KO and WT groups. C, heatmap representation of the common and unique upregulated (left) and down-regulated (right) DEGs between WT and Uchl1_KO groups in each cell type. D, representative GO terms for the shared upregulated (top) or downregulated (bottom) DEGs between WT and Uchl1_KO groups, along with their associated p-values. E and F, violin plots that showcase the down- and upregulated DEGs associated with oxidative phosphorylation (OXPHOS) (E) and the ubiquitin-proteasome pathway (F), in testis cells from both WT and Uchl1_KO mice, with the diamond within the violin indicating the mean. G, RT-qPCR detected key genes (Cul3, Trip12, Rbx1, Mtch2, Atp5b) in WT and Uchl1_KO testis. H, IF staining used to detect the expression of RBX1 and ATP5B proteins in the WT and Uchl1_KO groups (scale bar = 40 μm) and statistically analyzed their fluorescence expression. I, the alterations in the proportions of various cell types observed between the WT and Uchl1_KO groups. (Data are presented as means ± SD and represent three independent repetitions. ∗p < 0.05; ∗∗p < 0.01; ∗∗∗p < 0.001; ∗∗∗∗p < 0.0001).
Figure 4
Figure 4
Differential analysis of Sertoli cells in WT and Uchl1_KO.A, an UMAP plot that provides a focused analysis of Sertoli cells as depicted in Figure 2C. B, IF staining to visualize the localization of SOX9, accompanied by statistical analysis of testes from both the WT and Uchl1_KO groups, scale bar = 25 μm, (B) is one of the images for the counting of SOX9-positive cells in the UCHL1_KO group in Figure 1I, which we reused as a representative result image). C, a pseudotime trajectory of Sertoli cells, analyzed using Monocle, to illustrate their developmental progression. D, deconvolution of the pseudotime trajectory shown in (C), categorized by the WT and Uchl1_KO groups to highlight group-specific dynamics. E, a heatmap displaying the top 150 DEGs in Sertoli cells from Cluster 1 and Cluster 2. F, gene Ontology (GO) terms and their corresponding -log(p) values for the DEGs identified in Cluster 1 and Cluster 2, providing insight into the biological processes and pathways. G and H, a dynamic expression analysis of select representative genes within Cluster 1 (G), and Cluster 2 (H), showcasing the temporal changes in gene expression during the pseudotime trajectory.
Figure 5
Figure 5
Analysis of testicular intercellular communication between WT and Uchl1_KO testes.A, a histogram displaying the frequency and intensity of interactions between WT and Uchl1_KO testicular cells. B, circular diagrams, generated by CellChat analysis, that illustrate the differential counts of interactions (left panel) and interaction strength (right panel) within the cell-cell communication network between WT and Uchl1_KO. C, circular diagrams showing the number of interactions between WT and Uchl1_KO testis cells across different groups. Note: The thickness of the connecting lines between various cell types indicates the strength of the interaction, while the arrows denote the direction of communication. D, a comprehensive representation of the information flow through each signaling pathway in WT and Uchl1_KO cells. E, a visualization of signaling pathways that are significantly enriched in the WT and Uchl1_KO groups. F, an overview of ligand–receptor interactions (p < 0.05) between WT and Uchl1_KO testicular cells. The diameter of each circle corresponds to the p-value, with red indicating a higher probability of communication. The color of the squares represents the sample origin, with blue denoting WT and red signifying Uchl1_KO.
Figure 6
Figure 6
UCHL1 positively regulates ADIPOR1/AMPK signaling pathway in Sertoli cells.A, circle plots presenting the ADIPONECTIN signaling networks in WT and Uchl1_KO testes. B, violin plot depicting the expression level of Adipoq and Adipor1 genes in the WT and Uchl1_KO groups. C, IHC staining for detecting the expression of ADIPOR1 protein in the WT and Uchl1_KO groups, Rabbit IgG isotype control and anti-SOX9 Rabbit IgG were used as primary antibodies for negative and positive controls, respectively, scale bar = 40 μm. D, RT-qPCR detected of Adipor1 expression in WT and Uchl1_KO testis. E, Western blot detected the changes of ADIPOR1, AMPK, p-AMPK, UCHL1 protein expression in WT and Uchl1_KO testis. F, The histograms showed quantitative results of Image J (V1.48d) gradation analysis for (E). G, RT-qPCR detection of Adipor1 expression level in oeAdipor1 (overexpression Adipor1) in Sertoli cells. H, Western blot detected the changes of ADIPOR1, AMPK, p-AMPK, UCHL1 protein expression in oeAdipor1 cells. I, the histograms showed quantitative results of Image J (V1.48d) gradation analysis for (H). (Data are presented as means ± SD and represent three independent repetitions. ∗p < 0.05; ∗∗p < 0.01; ∗∗∗p < 0.001).
Figure 7
Figure 7
UCHL1 knockout/knockdown activates the SEMA7A/PLXNC1 signaling pathway in testis and Sertoli cells.A, circle plots demonstrating the SEMA7 signaling networks in WT and Uchl1_KO testis. B, violin plot illustrating the expression level of Sema7a and Plxnc1 genes in the WT and Uchl1_KO groups. C, RT-qPCR detected Adipor1 and Plxnc1 expression in WT and Uchl1_KO testis. D, Western blot detected the changes of SEMA7A, PLXNC1 and UCHL1 protein expression in WT and Uchl1_KO testis. E, the histograms showed quantitative results of Image J (V1.48d) gradation analysis for (D). F, IHC staining for the detection of the expression of PLXNC1 protein in the WT and Uchl1_KO groups, Rabbit IgG isotype control and anti-SOX9 Rabbit IgG were used as primary antibodies for negative and positive controls, respectively, scale bar = 40 μm. G, RT-qPCR detection of Uchl1 expression level in Sertoli cells with knockdown of Uchl1. H, the expression level of Sema7a and Plxnc1 in shUchl1 cells. I, IF staining of SEMA7A and PLXNC1 protein in shUchl1-2 cells and statistically analyzed their fluorescence expression, and statistically analyzed their fluorescence expression, scale bar = 50 μm. J, Western blot detected the changes of SEMA7A, PLXNC1 and UCHL1 protein expression in shUchl1 cells. K, the histograms showed quantitative results of Image J (V1.48d) gradation analysis for (J). (Data are presented as means ± SD and represent three independent repetitions. ∗p < 0.05; ∗∗p < 0.01; ∗∗∗p < 0.001; ∗∗∗∗p < 0.0001).

Similar articles

Cited by

References

    1. Komeya M., Ogawa T. Spermatogonial stem cells: progress and prospects. Asian J. Androl. 2015;17:771–775. - PMC - PubMed
    1. Wen Y., Ma X., Wang X., Wang F., Dong J., Wu Y., et al. hnRNPU in Sertoli cells cooperates with WT1 and is essential for testicular development by modulating transcriptional factors Sox8/9. Theranostics. 2021;11:10030–10046. - PMC - PubMed
    1. Ye L., Huang W., Liu S., Cai S., Hong L., Xiao W., et al. Impacts of immunometabolism on male reproduction. Front. Immunol. 2021;12 - PMC - PubMed
    1. Zhou R., Wu J., Liu B., Jiang Y., Chen W., Li J., et al. The roles and mechanisms of Leydig cells and myoid cells in regulating spermatogenesis. Cell Mol. Life Sci. 2019;76:2681–2695. - PMC - PubMed
    1. Yuan C., Hong H., Wang N., Chen T., Cao M., Zhao Y., et al. Increased oxidized low-density lipoprotein in mice exposed to a high-fat diet impaired spermatogenesis by inhibiting testosterone synthesis via the Klk1bs/Eid3 pathway. Clin. Transl. Med. 2024;14 - PMC - PubMed

LinkOut - more resources