Review
. 2025 May 28;125(10):5003-5053.
doi: 10.1021/acs.chemrev.4c00833. Epub 2025 May 11.

Solid-Liquid Interfacial Free Energy from Computer Simulations: Challenges and Recent Advances

Affiliations
Review

Solid-Liquid Interfacial Free Energy from Computer Simulations: Challenges and Recent Advances

Nicodemo Di Pasquale et al. Chem Rev. .

Abstract

The study of interfacial properties in liquid-liquid and liquid-vapor systems has a history of nearly 200 years, with significant contributions from scientific luminaries such as Thomas Young and Willard Gibbs. However, a similar level of understanding of solid-liquid interfaces has emerged only more recently, largely because of the numerous complications associated with the thermodynamics needed to describe them. The accurate calculation of the interfacial free energy of solid-liquid systems is central to determining which interfaces will be observed and their properties. However, designing and analyzing the molecular dynamics simulations required to do this remains challenging, unlike the liquid-liquid or liquid-vapor cases, because of the unique complications associated with solid-liquid systems. Specifically, the lattice structure of solids introduces spatial directionality, and atomic configurations in solids can be altered by stretching. The primary aim of this review is to provide an overview of the numerical approaches developed to address the challenge of calculating the interfacial free energy in solid-liquid systems. These approaches are classified as (i) direct methods, which compute interfacial free energies explicitly, albeit often through convoluted procedures, and (ii) indirect methods, which derive these free energies as secondary results obtained from the analysis of simulations of an idealized experimental configuration. We also discuss two key topics related to the calculation of the interfacial free energy of solid-liquid systems: nucleation theory and curved interfaces, which represent important problems where research remains highly active.


Figures

1
1
(Left) Front view of a simulation snapshot of hexagonal ice coexisting with liquid water (water molecules are represented as red and white spheres for oxygen and hydrogen atoms, respectively). The angle θ that quantifies the deviation with respect to the average interfacial orientation is defined in the figure. A point of the function h(x n ) that defines a discretized interfacial profile in the real space is indicated. (Right) View of the simulation box showing the elongated strip geometry of the xy side where the solid interface is exposed to the liquid. Ice and liquid molecules are depicted as orange and blue spheres respectively to enhance the visual contrast between both phases. This figure was adapted with permission from ref . Copyright 2014 Royal Society of Chemistry.
2
2
Schematic illustration of the cleaving procedure, with the four steps described in the text highlighted. The initial point is represented by two different systems, solid bulk and liquid bulk. The final point is represented by a single system with two new interfaces between the solid and liquid phases. Labels α1, α2 (for the solid) and β1, β2 (for the liquid) help to identify parts of the solid and liquid systems that are put into contact in step 3.
3
3
Illustration of the cleaving walls needed to calculate the IFE of the (100) crystal–melt interface in a hard-sphere system. Solid circles outline the wall spheres of diameter σ. Dashed circles outline spheres of radius σ centered at the wall spheres. Shaded regions indicate the excluded volume introduced by the cleaving walls, i.e., where the cleaving walls potential is infinite (see eq ). (a) Initial position of the walls, where they do not interact with the system. (b) Intermediate wall position, where the system sphere can no longer pass through the cleaving plane. (c) Final position of the walls, where the system spheres cannot collide across the cleaving plane.
4
4
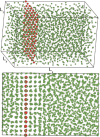
(Top) Snapshot of a hard-sphere fluid under coexistence conditions (green particles). (Bottom) Snapshot of a fluid with a thin crystal slab under coexistence conditions (a projection in the xz plane is shown). The mold that induces the formation of the crystal slab consists of a set of potential energy wells (red spheres) whose positions are given by the lattice sites of the selected crystal plane under coexistence conditions. The interaction between the mold and the hard-spheres is switched off in the top configuration and switched on in the bottom one. The diameters of the green particles have been reduced to 1/4 of their original size. This figure was reproduced with permission from ref . Copyright 2014 American Institute of Physics.
5
5
Snapshots representing trajectories extracted from molecular dynamics simulations of the CO2–water two-phase coexistence at 400 bar and 287 K. The mold that induces the formation of the crystal slab consists of a set of potential energy wells (magenta spheres) located at the crystallographic positions of the carbon atoms of the CO2 molecules of the selected crystal planes at coexistence conditions. The red and white licorice representation corresponds to oxygen and hydrogen atoms of water, respectively; blue and yellow spheres (van der Waals representation) correspond to carbon and oxygen atoms of CO2, respectively.
6
6
(Top left) Schematic of the transformation of bulk solid material into an Einstein crystal. (Bottom left) Schematic of the creation of a vacuum gap in a liquid. (Right) Schematic of the transformation of solid in the slab system into an Einstein crystal. Processes in green boxes need only be performed once and the free energy scaled to match the slab system. The process in the blue box is repeated for each slab system. This figure was reproduced from ref under a CC BY 4.0 license.
7
7
Summary of IFE results for the hard-sphere/structureless hard-wall system calculated using Gibbs–Cahn integration, cleaving walls, the Kirkwood–Buff equation, eq , and thermodynamic integration. , The solid and dashed lines are theoretical results from standard scaled particle theory and scaled particle theory using the Carnahan–Starling equation of state (EOS) pressure to correct for the position of the wall, respectively.
8
8
Solid cluster of hard spheres is shown in equilibrium with the surrounding melt in the NVT ensemble. For clarity, liquid particles are depicted at a reduced size. The system is in thermodynamic equilibrium, meaning that molecular motion ensures both temperature and chemical potential (but not pressure) are uniform throughout the system. This figure was reproduced with permission from ref . Copyright 2022 American Institute of Physics.
9
9
Variation of γ C with the radius of the cluster 1/RC for (a) hard spheres, (b) Lennard-Jones (two isobars), (c) mW model of water (three isobars), and (d) TIP4P/Ice (two isobars). This figure was reproduced with permission from ref . Copyright 2019 American Institute of Physics.
10
10
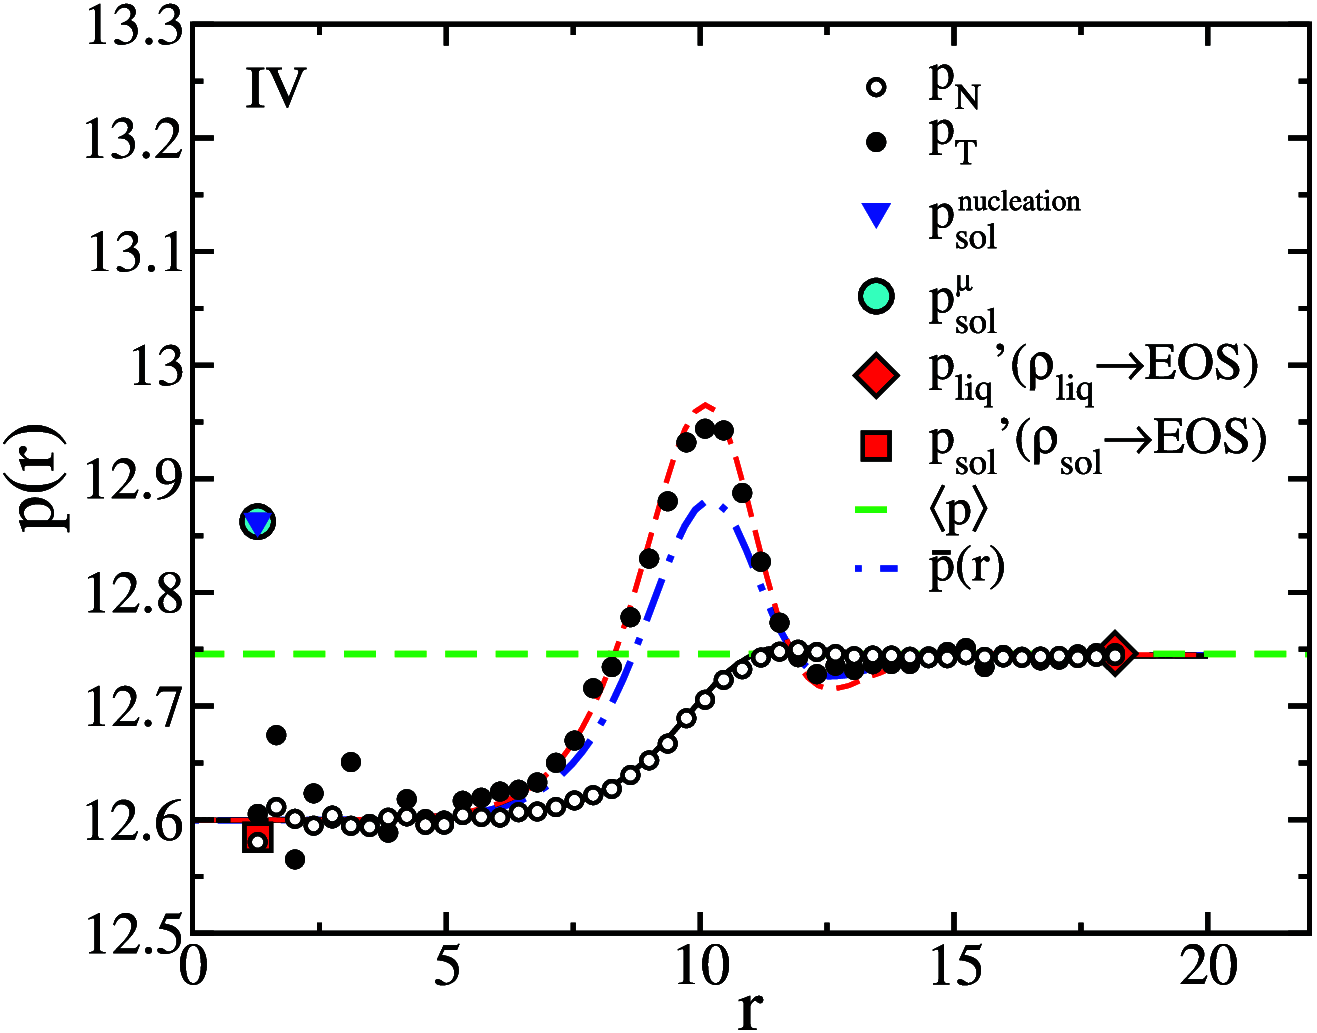
Normal P N and tangential P T components of the pressure tensor for a spherical solid cluster of pseudo hard spheres in equilibrium with the liquid at constant N, V , and T. The pressure components are shown as a function of the distance (r) to the center of mass of the cluster. We refer for the exact definition of all the other symbols to the original ref . This figure was reproduced with permission from ref . Copyright 2020 American Institute of Physics.
11
11
Trajectories in the NPT ensemble from a configuration of the stable solid cluster in the NVT shown in Figure . Results shown were obtained for the hard-sphere potential introducing a spherical solid cluster of size N sol in the fluid phase. This figure was adapted with permission from ref . Copyright 2020 American Chemical Society.
12
12
Sketch showing a stable solid cluster in the NVT ensemble (minimum in F) corresponding to a saddle point in the NPT ensemble corresponding to a critical cluster. This figure was reproduced with permission from ref . Copyright 2020 American Chemical Society.
13
13
Nucleation rates of (a) HS and (b) the mW model of water obtained from seeding compared to results obtained from brute force simulations, umbrella sampling, and forward flux sampling. This figure was reproduced with permission from ref . Copyright 2016 the American Institute of Physics.

References

    1. Brantley, S. L. ; White, A. F. ; Hodson, M. E. . Surface area of primary silicate minerals. In Growth, dissolution and pattern formation in geosystems; Springer, 1999; 291–326.
    1. Hoose C., Möhler O.. Heterogeneous ice nucleation on atmospheric aerosols: a review of results from laboratory experiments. Atmospheric Chemistry and Physics. 2012;12(20):9817–9854. doi: 10.5194/acp-12-9817-2012. - DOI
    1. Kalikmanov, V. I. Classical nucleation theory. In Nucleation theory; Springer, 2013; pp 17–41.
    1. Sosso G. C., Chen J., Cox S. J., Fitzner M., Pedevilla P., Zen A., Michaelides A.. Crystal nucleation in liquids: Open questions and future challenges in molecular dynamics simulations. Chem. Rev. 2016;116(12):7078–7116. doi: 10.1021/acs.chemrev.5b00744. - DOI - PMC - PubMed
    1. Sleutel M., Lutsko J., Van Driessche A. E.S., Durán-Olivencia M. A., Maes D.. Observing classical nucleation theory at work by monitoring phase transitions with molecular precision. Nat. Commun. 2014;5:5598. doi: 10.1038/ncomms6598. - DOI - PMC - PubMed