Application of Metabolomics and the Discovery of Potential Serum Biomarkers for Diuretic Resistance in Heart Failure
- PMID: 40351663
- PMCID: PMC12059756
- DOI: 10.31083/RCM27001
Application of Metabolomics and the Discovery of Potential Serum Biomarkers for Diuretic Resistance in Heart Failure
Abstract
Background: Diuretic resistance (DR) is characterized by insufficient fluid and sodium excretion enhancement despite maximum loop diuretic doses, indicating a phenotype of refractory heart failure (HF). Recently, metabolomics has emerged as a crucial tool for diagnosing and understanding the pathogenesis of various diseases. This study aimed to differentiate diuretic-resistant patients from non-resistant HF to identify biomarkers linked to the emergence of DR.
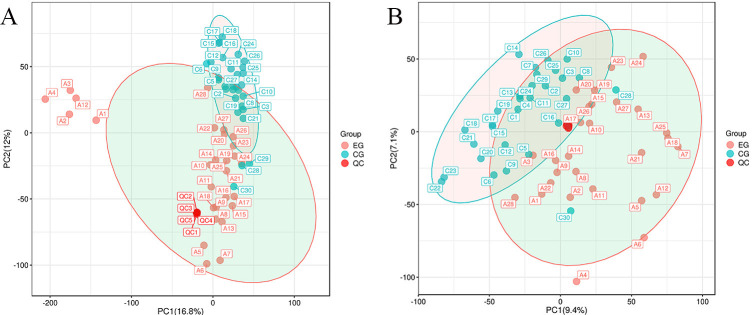
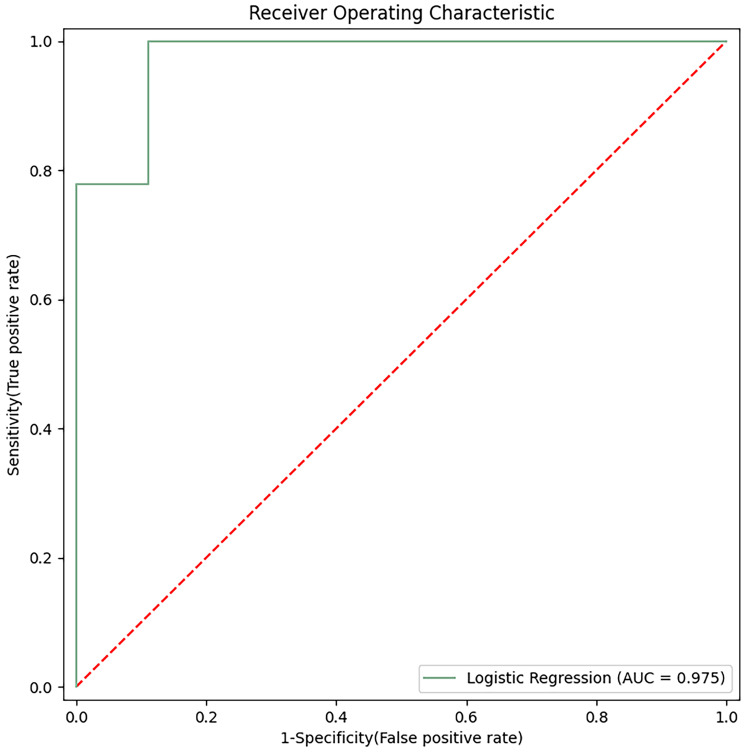
Methods: Serum samples from HF patients, both with and without DR, were subjected to non-targeted metabolomic analysis using liquid chromatography-tandem mass spectrometry. Metabolite variations between groups were identified using principal component analysis and orthogonal partial least-square discriminant analysis. Metabolic pathways were assessed through the Kyoto Encyclopedia of Genes and Genomes database enrichment analysis, and potential biomarkers were determined using receiver operating characteristic curves (ROCs).
Results: In total, 192 metabolites exhibited significant differences across the two sample groups. Among these, up-regulation was observed in 164 metabolites, while 28 metabolites were down-regulated. A total of 28 pathways involving neuroactive ligand-receptor interaction and amino acid biosynthesis were affected. The top five metabolites identified by ROC analysis as potential DR biomarkers were hydroxykynurenine, perillic acid, adrenic acid, 5-acetamidovalerate, and adipic acid.
Conclusions: Significant differences in metabolite profiles were observed between the diuretic-resistant and non-diuretic-resistant groups among patients with HF. The top five differentially expressed endogenous metabolites were hydroxykynurenine, perillic acid, adrenic acid, 5-acetamidovalerate, and adipic acid. The metabolic primary pathways implicated in DR were noted as amino acid, energy, and nucleotide metabolism.
Clinical trial registration: This study was registered with the China Clinical Trials Registry (https://www.chictr.org.cn/hvshowproject.html?id=197183&v=1.7, ChiCTR2100053587).
Keywords: biomarker; diuretic resistance; heart failure; metabolomic.
Copyright: © 2025 The Author(s). Published by IMR Press.
Conflict of interest statement
The authors declare no conflict of interest.
Figures


Similar articles
-
[Screening of serum oxysterol biomarkers for colon cancer by liquid chromatography-tandem mass spectrometry].Se Pu. 2022 Jun;40(6):541-546. doi: 10.3724/SP.J.1123.2022.01001. Se Pu. 2022. PMID: 35616199 Free PMC article. Chinese.
-
Discovery and Validation of Potential Serum Biomarkers for Heart Failure by Untargeted Metabolomics.Cardiovasc Ther. 2024 Aug 14;2024:7004371. doi: 10.1155/2024/7004371. eCollection 2024. Cardiovasc Ther. 2024. PMID: 39742011 Free PMC article.
-
[Analysis of metabolite differences in skin between Clapp's Favorite and its mutant Red Clapp's Favorite through non-targeted metabolomics].Se Pu. 2021 Nov;39(11):1203-1212. doi: 10.3724/SP.J.1123.2021.05002. Se Pu. 2021. PMID: 34677015 Free PMC article. Chinese.
-
Untargeted metabolomics analysis of glycerophospholipid metabolism in very low birth weight infants administered multiple oil lipid emulsions.BMC Pediatr. 2024 Dec 31;24(1):849. doi: 10.1186/s12887-024-05343-4. BMC Pediatr. 2024. PMID: 39736612 Free PMC article.
-
Metabolomics combined with clinical analysis explores metabolic changes and potential serum metabolite biomarkers of antineutrophil cytoplasmic antibody-associated vasculitis with renal impairment.PeerJ. 2023 Mar 15;11:e15051. doi: 10.7717/peerj.15051. eCollection 2023. PeerJ. 2023. PMID: 36942002 Free PMC article.
References
-
- Fonarow GC, Yancy CW, Heywood JT, ADHERE Scientific Advisory Committee, Study Group, and Investigators Adherence to heart failure quality-of-care indicators in US hospitals: analysis of the ADHERE Registry. Archives of Internal Medicine . 2005;165:1469–1477. doi: 10.1001/archinte.165.13.1469. - DOI - PubMed
LinkOut - more resources
Full Text Sources
Research Materials
Miscellaneous