. 2025 Apr 25:12:1577028.
doi: 10.3389/fvets.2025.1577028. eCollection 2025.

Transcriptomic profiling in canine B-cell lymphoma supports a synergistic effect of BTK and PI3K inhibitors

Affiliations

Transcriptomic profiling in canine B-cell lymphoma supports a synergistic effect of BTK and PI3K inhibitors

Xenia Lainscsek et al. Front Vet Sci. .

Abstract

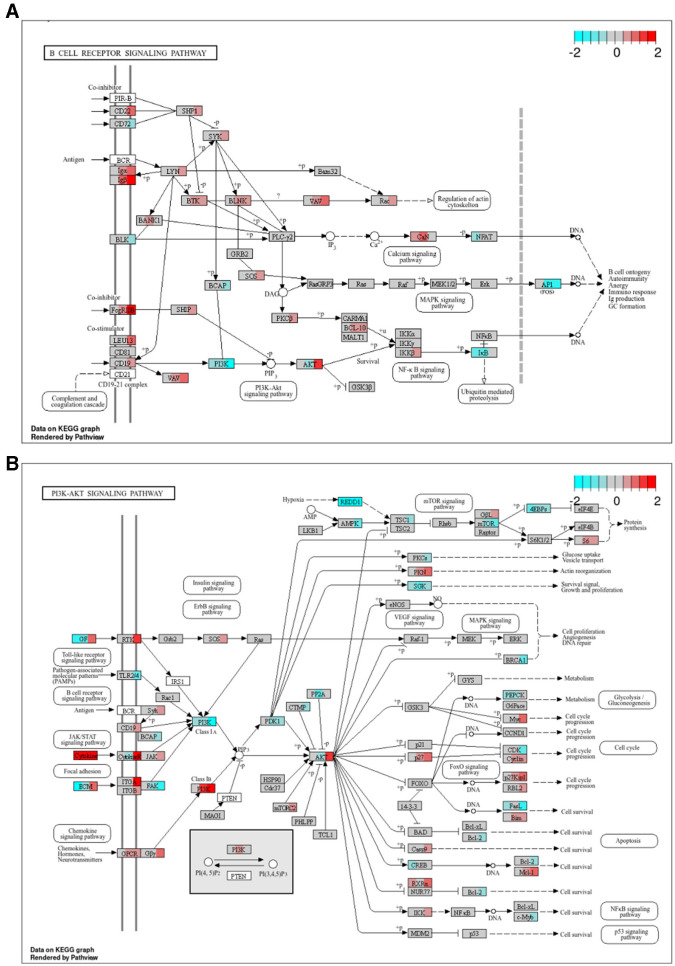
Introduction: B-cell receptor (BCR) signaling has revealed itself as a critical pathway in the pathogenesis of B-cell lymphoma. Within this pathway, the inhibition of Bruton's tyrosine kinase (BTK) or Phosphoinositide 3-kinases (PI3Ks) alone presents encouraging efficacy in the treatment of certain both canine and human hematological malignancies.

Methods: Here we characterized the effects of the BTK inhibitor Ibrutinib and the PI3K inhibitor AS-605240 as single and combined agents in the canine pre-clinical diffuse large B cell lymphoma (DLBCL) model CLBL-1 by assaying cell proliferation and metabolic activity, and performing RNA-seq to measure gene expression changes.

Results: We found 2,336 differentially expressed genes (DEGs) across all treatment types and time points relative to the control. The largest number of DEGs were induced by the combination of Ibrutinib and AS-605240. These genes were involved in adaptive immune response, leukotriene D4 metabolic and terms related to regulation of GTP and GTPase mediated signal transduction. Weighted gene co-expression network analysis (WGCNA) detected nine gene modules, five of which were associated with treatment response. Eighteen-percent of genes within these modules were also differentially expressed. Notably, we observed one module that was exclusively associated with the combined treatment whose gene members were related to cellular metabolism, homeostasis signaling, and protein synthesis and regulation.

Conclusion: Narrowing in on highly connected genes of modules associated with treatment response with large fold changes across treatments which play roles in the main targeted pathways identified PAG1, PRKAR2A, ACACA, FOS, and PRKCA as potential primary candidates of the synergistic treatment effect.

Keywords: RNA-seq; canine lymphoma; co-expression network analysis; differential expression analysis; phosphoinositide 3-kinase inhibitors; tyrosine kinase inhibitors.


Conflict of interest statement

JB was employed by Chronix Biomedical GmbH. The remaining authors declare that the research was conducted in the absence of any commercial or financial relationships that could be construed as a potential conflict of interest.

Figures

Figure 1
Figure 1
Combined application of Ibrutinib and AS-605240 for 72 h synergistically inhibits the proliferation and metabolic activity of CLBL-1. (A) Number of viable cells represented as dot plots. Means ± standard deviation (SD) of six independent experiments are shown. (B) Mean metabolic activity (%) compared to cells incubated with DMSO only, over three independent experiments. Error bars indicate one SD. Asterisks indicate statistical significance by a one-way Anova analysis with Tukey's multiple comparison test correction, with one, two or three asterisks if the P-value is below 0.05, 0.01, or 0.001, respectively.
Figure 2
Figure 2
Ibrutinib and AS-605240 synergistically induce gene expression changes in CLBL-1. (A) Expression values of all 2,336 DEGs across treatments and incubation times. Expression values were scaled across all sample groups to a mean of zero and a standard deviation of 1 for each gene. Genes were hierarchically clustered with complete linkage based on the Euclidean distance of their expression profiles. Most lowly and highly expressed genes are evidently present in the combined Ibr + AS treatment groups across all time points and upon incubation with DMSO for 72 h, whereby a discordant trend is visible. (B) PCA plot showing how samples clustered based on the expression values of their DEGs. Samples cluster by treatment type and then by incubation time (57% and 20% variance explained, respectively). (C) Bar plot showing the number of up- (red) and downregulated (cyan) DEGs per treatment (rows) and incubation time (columns). Genes exhibiting differential expression in the DMSO control group at 48 or 72 h, relative to DMSO at 24 h, are highlighted in bold opacity. (D) Venn diagram illustrating the overlap of DEGs identified upon single Ibr, AS, or combined Ibr + AS treatment. The shades of red indicate the relative number of DEGs within each subset, with darker shades representing a higher number of DEGs. The combined Ibr + AS treatment accounted for the highest number of exclusively differentially expressed genes (1,460; 62%). Only 281 (12%) genes were differentially expressed in all three treatment groups.
Figure 3
Figure 3
WGCNA revealed nine distinct gene modules, with five of them (cyan, darkmagenta, lightcyan1, lightgreen, and salmon) being potentially relevant to treatment response. (A) Average linkage hierarchical clustering dendrogram of the top two-third of the expressed genes with highest expression values. The color bars below the dendrogram (x-axis) show the module assignment of each gene, with gray representing unassigned genes. The y-axis (“Height”) represents the dissimilarity between genes, calculated based on their topological overlap (Supplementary Figures 1C, E). Higher heights indicate stronger dissimilarity. (B) Eigengenes of each treatment and incubation time averaged over passage reveal the expression profile of the combined Ibr + AS treatment to have the strongest (also negative) correlation to PC1 of the expression matrix of genes within the darkmagenta, cyan, and lightgreen modules compared to the eigengenes of the other treatments. (C) Heatmaps indicating linear regression-derived associations between the module eigengenes (y-axis) and treatment type and incubation times (x-axis). The color of the heatmaps represents the (–log10 value of the) false discovery rate (FDR).
Figure 4
Figure 4
A large proportion of the DEGs were found within potentially relevant modules. (A) Overlaps between module member genes (solid) and DEGs (low opacity). (B) GO terms of 1,617 genes which were either differentially expressed or in one of the potentially relevant modules identified by WGCNA (Figure 3C; cyan, darkmagenta, lightcyan1, lightgreen, and salmon). (C) Dot plot of the motifs overrepresented among the promoters of DEGs in potentially relevant modules. The size of the circle corresponds to the fraction of DEG promoters in the module with instances of the motif; odds ratios relative to all DEGs in potentially relevant modules are indicated in red. (D) Top 25 hubs of each module, selected based on module eigengene-based connectivity (kME), are represented as a graph with forced-directed layout as proposed by Kamada and Kawai (50) using the R plugin RCy3 (51) for constructing networks with Cytoscape (49). Each node represents a hub and edge thickness indicates the TOM similarity. Node size indicates its module eigengene-based connectivity (kME), i.e., the correlation between the expression profile of a gene and the module eigengene and node opacity corresponds to its intramodular connectivity (kWithin).
Figure 5
Figure 5
Combined Ibr + AS treatment modulates both upstream and downstream effectors of the BCR (A, B) PI3K-AKT signaling pathways. KEGG (58, 59) pathway graphs rendered by “pathview” (57) R package for the “B-cell receptor signaling pathway” (hsa04662) and “PI3K-Akt signaling pathway” (hsa04151). Rectangular boxes represent proteins and circles, metabolites. Boxes with rounded corners contain references to other pathways. Rectangular boxes are divided into three segments; from left to right, these segments represent: single treatment with AS, single with Ibr, and combined treatment with Ibr and AS. Segments are colored based on the log2 FCs relative to the DMSO control of the RNA transcripts of the respective proteins. Proteins encoded by genes that are not differentially expressed nor members of a potentially relevant module (lightgreen, salmon, darkmagenta, lightcyan1 or cyan) are shown in gray. White rectangular boxes correspond to RNA transcripts that were considered non-expressed or undetected. Canine genes (Entrez IDs) were mapped to their human orthologs. (A) Despite reduced protein expression of BTK, Ibrutinib treatment led to increased BTK mRNA levels, suggesting compensatory mechanisms. Nevertheless, FOS, the gene encoding a subunit of the AP-1 transcription factor, a downstream effector of the BCR pathway, was significantly downregulated. Note that the gray box labeled “PI3K” represents the catalytic (PIK3CA, PIK3CB, PIK3CD, and PIK3CG) and regulatory subunits (PIK3R1, PIK3R2, PIK3R3, PIK3R5, and PIK3R6) of the PI3K enzyme complex. (B) AS treatment selectively inhibited PI3K activation. We see strongest downregulation of PI3K class IA and upregulation of PI3K class I B in the combined treatment group. PI3K class I B constitutes the main target of AS, PIK3CG, as well as its regulatory subunits PIK3R5 and PIK3R6 which Ibr + AS seem to especially be influencing. Downstream thereof is AKT, an upstream regulator of MYC and BCL2. Although the isoform AKT3 was upregulated in Ibr + AS, MYC expression was substantially higher and BCL2 expression was substantially lower in the combined treatment.

References

    1. Richards KL, Suter SE. Man's best friend: what can pet dogs teach us about non-Hodgkin's lymphoma? Immunol Rev. (2015) 263:173–91. 10.1111/imr.12238 - DOI - PMC - PubMed
    1. Parissenti AM, Pritzker LB, Guo B, Narendrula R, Wang SX, Lin LL, et al. . RNA disruption indicates CHOP therapy efficacy in canine lymphoma. BMC Vet Res. (2019) 15:453. 10.1186/s12917-019-2189-x - DOI - PMC - PubMed
    1. Saba CF, Vickery KR, Clifford CA, Burgess KE, Phillips B, Vail DM, et al. . Rabacfosadine for relapsed canine B-cell lymphoma: efficacy and adverse event profiles of 2 different doses. Vet Comp Oncol. (2018) 16:E76–82. 10.1111/vco.12337 - DOI - PubMed
    1. Ortiz CC, García-Parejo A, de la Fuente Martín R, Heredia-Carroza J, Lorenzo JFP. Osuna Journals Salud y Deporte. Volumen I. Sevilla: Wanceulen S.L. (2022). p. 607.
    1. Wilson WH, Young RM, Schmitz R, Yang Y, Pittaluga S, Wright G, et al. . Targeting B cell receptor signaling with ibrutinib in diffuse large B cell lymphoma. Nat Med. (2015) 21:922–6. 10.1038/nm.3884 - DOI - PMC - PubMed

LinkOut - more resources