Use of Electron Density Maps and Fused Images in Dual-Energy Cardiac Computed Tomography to Facilitate Detection of Late Iodine Enhancement
- PMID: 40352123
- PMCID: PMC12061510
- DOI: 10.1253/circrep.CR-24-0115
Use of Electron Density Maps and Fused Images in Dual-Energy Cardiac Computed Tomography to Facilitate Detection of Late Iodine Enhancement
Abstract
Background: This study aimed to optimize the fusion of quantitative maps and morphological images to improve late iodine enhancement (LIE) imaging using cardiac dual-energy computed tomography (DECT).
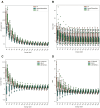
Methods and results: We retrospectively analyzed 15 patients with suspected old myocardial infarction who underwent cardiac DECT. Virtual monochromatic images (VMI) ranging from 40 to 200 keV and quantitative maps (e.g., iodine concentration, effective atomic number, and electron density [(%EDW: percentage relative to the electron density of water)] were generated. The contrast-to-noise ratio (CNR) between LIE areas and the left ventricular (LV) blood pool and normal myocardium was calculated to determine the optimal image fusion for LIE delineation. VMI at 40 keV demonstrated superior CNR between LIE areas and normal myocardium. Electron density was significantly higher in LIE areas [105.5%EDW (interquartile range (IQR): 105.15-105.65)] than in the LV blood pool [104.4%EDW (IQR: 104.3-104.6)] and normal myocardium [104.4%EDW (IQR: 104.2-104.65)] (P<0.001). Iodine concentration and effective atomic number differed significantly between LIE areas and normal myocardium, but did not differ significantly between LIE areas and the LV blood pool. Fusion of 40 keV VMI with electron density maps yielded the highest area under the receiver operating characteristic curve (0.917).
Conclusions: Fused images combining 40 keV VMI with electron density maps significantly enhanced the visualization of LIE areas on DECT, offering improved contrast and diagnostic accuracy for the assessment of myocardial territories.
Keywords: Dual-energy computed tomography; Electron density map; Iodine; Late enhancement; Myocardial infarction.
Copyright © 2025, THE JAPANESE CIRCULATION SOCIETY.
Conflict of interest statement
T.N. has received research support from Nemoto Kyorindo Co., Ltd. T.H. has received research support from Canon Medical Systems. The Department of Diagnostic Imaging Analysis, to which M.K. belongs, is an endowed chair supported by Philips Healthcare. Nemoto Kyorindo Co., Ltd., Philips Healthcare, and Canon Medical Systems had no control over the interpretation, writing, or publication of this work.
Figures


Similar articles
-
Evaluation of monoenergetic late iodine enhancement dual-energy computed tomography for imaging of chronic myocardial infarction.Eur Radiol. 2014 Jun;24(6):1211-8. doi: 10.1007/s00330-014-3126-9. Epub 2014 Mar 6. Eur Radiol. 2014. PMID: 24599623 Clinical Trial.
-
Mono+ algorithm assessment of the diagnostic value of dual-energy CT for high-risk factors for colorectal cancer: a preliminary study.Quant Imaging Med Surg. 2024 Jan 3;14(1):432-446. doi: 10.21037/qims-23-291. Epub 2024 Jan 2. Quant Imaging Med Surg. 2024. PMID: 38223051 Free PMC article.
-
Performance characterization of a prototype dual-layer cone-beam computed tomography system.Med Phys. 2021 Nov;48(11):6740-6754. doi: 10.1002/mp.15240. Epub 2021 Oct 8. Med Phys. 2021. PMID: 34622973
-
Virtual Monoenergetic Imaging and Iodine Perfusion Maps Improve Diagnostic Accuracy of Dual-Energy Computed Tomography Pulmonary Angiography With Suboptimal Contrast Attenuation.Invest Radiol. 2017 Nov;52(11):659-665. doi: 10.1097/RLI.0000000000000387. Invest Radiol. 2017. PMID: 28542094
-
Dual energy imaging in cardiothoracic pathologies: A primer for radiologists and clinicians.Eur J Radiol Open. 2021 Jan 20;8:100324. doi: 10.1016/j.ejro.2021.100324. eCollection 2021. Eur J Radiol Open. 2021. PMID: 33532519 Free PMC article. Review.
References
-
- Kwong RY, Chan AK, Brown KA, Chan CW, Reynolds HG, Tsang S, et al.. Impact of unrecognized myocardial scar detected by cardiac magnetic resonance imaging on event-free survival in patients presenting with signs or symptoms of coronary artery disease. Circulation 2006; 113: 2733–2743, doi:10.1161/CIRCULATIONAHA.105.570648. - PubMed
-
- Yap J, Lim FY, Gao F, Wang SZ, Low SCS, Le TT, et al.. Effect of myocardial viability assessed by cardiac magnetic resonance on survival in patients with severe left ventricular dysfunction. Circ Rep 2020; 2: 306–313, doi:10.1253/circrep.CR-19-0126. - PMC - PubMed
-
- Sugiura J, Soeda T, Kyodo A, Nakamura T, Okamura A, Nogi K, et al.. Clinical course of optical coherence tomography-detected lipid-rich coronary plaque after optimal medical therapy. Circ Rep 2021; 4: 29–37, doi:10.1253/circrep.CR-21-0147. - PMC - PubMed

