

Longitudinal study of COPD phenotypes using integrated SPECT and qCT imaging
- PMID: 40352142
- PMCID: PMC12061679
- DOI: 10.3389/fphys.2025.1555230
Longitudinal study of COPD phenotypes using integrated SPECT and qCT imaging
Abstract
Introduction: The aim of this research is to elucidate chronic obstructive pulmonary disease (COPD) progression by quantifying lung ventilation heterogeneities using single-photon emission computed tomography (SPECT) images and establishing correlations with quantitative computed tomography (qCT) imaging-based metrics. This approach seeks to enhance our understanding of how structural and functional changes influence ventilation heterogeneity in COPD.
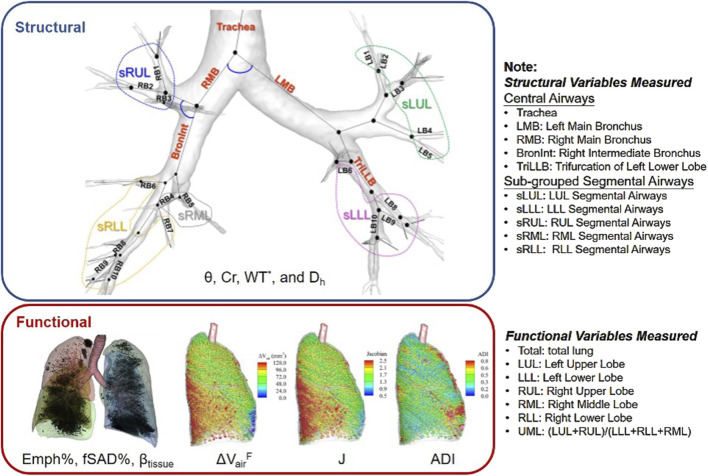
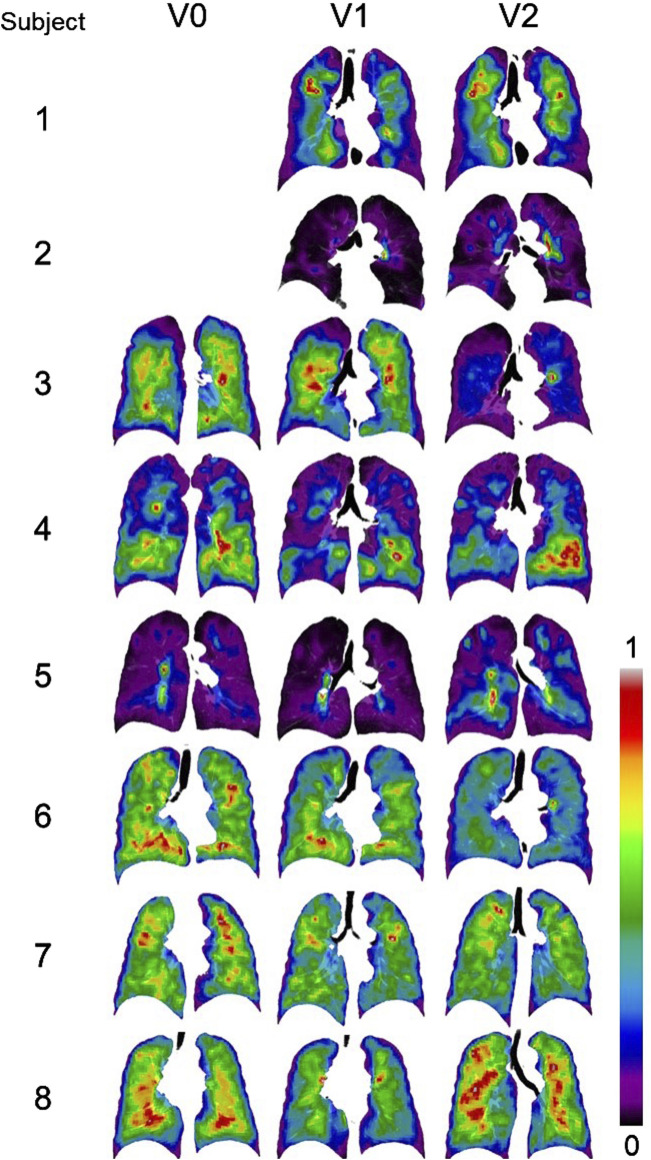
Methods: Eight COPD subjects completed a longitudinal study with three visits, spaced about a year apart. CT scans were performed at each visit and qCT-based variables were derived to measure the structural and functional characteristics of the lungs, while the SPECT-based variables were used to quantify lung ventilation heterogeneity. The correlations between key qCT-based variables and SPECT-based variables were examined.
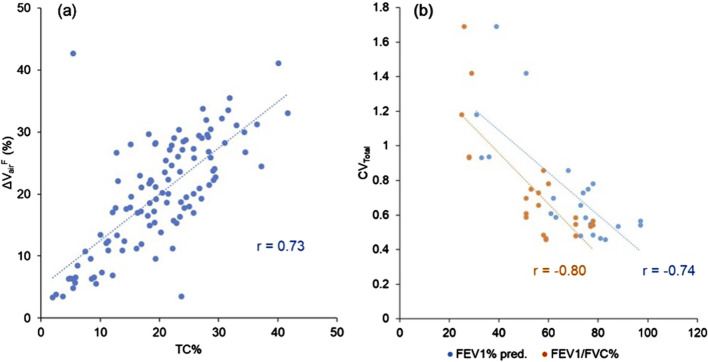
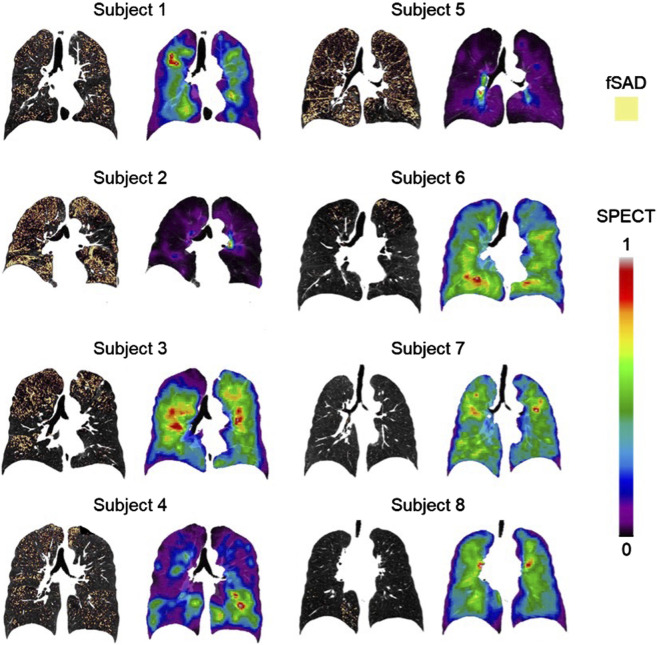
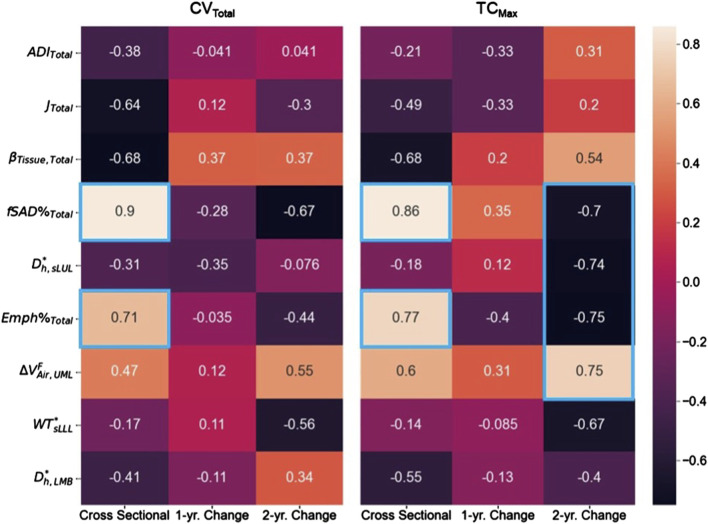
Results: The SPECT-based ventilation heterogeneity (CVTotal) showed strong correlations with the qCT-based functional small airway disease percentage (fSAD%Total) and emphysematous tissue percentage (Emph%Total) in the total lung, based on cross-sectional data. Over the 2-year period, changes in SPECT-based hot spots (TCMax) exhibited strong negative correlations with changes in fSAD%Total, Emph%Total, and the average airway diameter in the left upper lobe, as well as a strong positive correlation with alternations in airflow distribution between the upper and lower lobes.
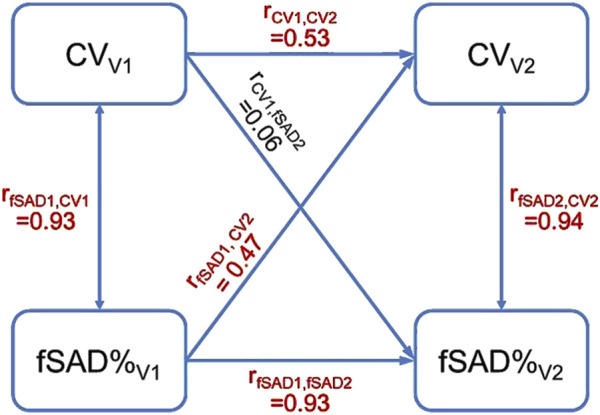
Discussion: In conclusion, this study found strong positive cross-sectional correlations between CVTotal and both fSAD% and Emph%, suggesting that these markers primarily reflect static disease severity at a single time point. In contrast, longitudinal correlations between changes in TCMax and other variables over 2 years may capture the dynamic process of hot spot formation, independent of disease severity. These findings suggest that changes in TCMax may serve as a more sensitive biomarker than changes in CVTotal for tracking the underlying mechanisms of COPD progression.
Keywords: COPD; CT; SPECT; small airway disease; ventilation.
Copyright © 2025 Li, Zhang, Comellas, Hoffman, Graham and Lin.
Conflict of interest statement
The authors declare that the research was conducted in the absence of any commercial or financial relationships that could be construed as a potential conflict of interest. The author(s) declared that they were an editorial board member of Frontiers, at the time of submission. This had no impact on the peer review process and the final decision.
Figures
Similar articles
-
Exploratory Study on COPD Phenotypes and their Progression: Integrating SPECT and qCT Imaging Analysis.medRxiv [Preprint]. 2024 Apr 13:2024.04.10.24305577. doi: 10.1101/2024.04.10.24305577. medRxiv. 2024. PMID: 38645219 Free PMC article. Preprint.
-
Assessment of ventilation heterogeneity and particle deposition in asthmatics using combined SPECT/CT imaging and computational modeling approaches.Eur J Pharm Sci. 2025 Jun 1;209:107093. doi: 10.1016/j.ejps.2025.107093. Epub 2025 Apr 2. Eur J Pharm Sci. 2025. PMID: 40185289 Free PMC article.
-
Longitudinal Imaging-Based Clusters in Former Smokers of the COPD Cohort Associate with Clinical Characteristics: The SubPopulations and Intermediate Outcome Measures in COPD Study (SPIROMICS).Int J Chron Obstruct Pulmon Dis. 2021 May 31;16:1477-1496. doi: 10.2147/COPD.S301466. eCollection 2021. Int J Chron Obstruct Pulmon Dis. 2021. PMID: 34103907 Free PMC article.
-
The utility of quantitative computed tomography in cohort studies of chronic obstructive pulmonary disease: a narrative review.J Thorac Dis. 2023 Oct 31;15(10):5784-5800. doi: 10.21037/jtd-23-1421. Epub 2023 Oct 27. J Thorac Dis. 2023. PMID: 37969311 Free PMC article. Review.
-
Quantitative computed tomography measurements to evaluate airway disease in chronic obstructive pulmonary disease: Relationship to physiological measurements, clinical index and visual assessment of airway disease.Eur J Radiol. 2016 Nov;85(11):2144-2151. doi: 10.1016/j.ejrad.2016.09.010. Epub 2016 Sep 13. Eur J Radiol. 2016. PMID: 27776670 Free PMC article. Review.
References
-
- Alber M., Buganza Tepole A., Cannon W. R., De S., Dura-Bernal S., Garikipati K., et al. (2019). “Integrating machine learning and multiscale modeling—perspectives, challenges, and opportunities in the biological, biomedical, and behavioral sciences,” 2. United Kingdom: Nature Research. npj Digital Medicine. 10.1038/s41746-019-0193-y - DOI - PMC - PubMed
LinkOut - more resources
Full Text Sources