. 2025 Apr 25:16:1555048.
doi: 10.3389/fimmu.2025.1555048. eCollection 2025.

Molecular characterization and immune role of TLR7 in Labeo rohita

Affiliations

Molecular characterization and immune role of TLR7 in Labeo rohita

Saswati Pani et al. Front Immunol. .

Abstract

Background: Toll-like receptors (TLRs) play a vital role in the immune response by recognizing pathogen-associated molecular patterns (PAMPs) and triggering signaling pathways that activate innate immunity. In bony fish, TLR7 is essential for both antiviral and antibacterial defense; however, its interactions with a wide range of ligands and pathogens are still not well understood across various fish species. This study focuses on the identification and characterization of TLR7 in Labeo rohita (LrTLR7) and aims to evaluate its response to pathogen challenges and stimulation by PAMPs.

Methods: To clone the TLR7 gene, RNA was extracted from L. rohita kidney tissue using a standard protocol, followed by cDNA synthesis with commercial kits. The TLR7 gene was amplified by PCR, and the gel-purified product was cloned into the pGEM-T Easy vector. DNA sequencing and BLAST analysis confirmed the identity of the LrTLR7 gene. The ORF of LrTLR7 cDNA was predicted using ORF-finder, while structural motifs in the encoded protein were identified through SMART. Phylogenetic relationships were analyzed using MEGA7 to construct evolutionary trees. Gene expression profiles of LrTLR7 were evaluated by quantitative real-time PCR (qRT-PCR) across developmental stages, tissues/organs of rohu fingerlings, and during challenges with A, hydrophila and E. tarda infections, as well as LPS and Poly I:C stimulation. Mucosal RBCs and PBLs were isolated using density-gradient centrifugation with HiSep™ LSM 1077 (Himedia, India). Cultured L. rohita gill (LRG) cells in Leibovitz's L-15 medium were infected with A. hydrophila or E. tarda at a multiplicity of infection (MOI) of 1, following established protocols.

Results: LrTLR7 showed the closest phylogenetic affinity to TLR7 in Cyprinus carpio. During embryonic development, LrTLR7 expression surged dramatically (~111-fold, p<0.05) in embryos at 120 h post-fertilization (hpf). In L. rohita juveniles, the gene was ubiquitously expressed across tissues/organs, with peak expression in gills (~2,000-fold). Following infection with A. hydrophila or E tarda, LrTLR7 gene transcripts in the liver increased sharply at 6 hpi (~93-fold and ~53,000-fold, respectively). In the infected fish, mucosal RBCs showed a ~500,000-fold upregulation (p<0.05), while PBLs exhibited maximal responses at 24 hpi (~5,000-fold for A. hydrophila and ~10 million-fold for E. tarda). In the LRG cell line, LrTLR7 gene expression rose ~30-fold by 3 hpi. during A. hydrophila infection. In-vivo stimulation with LPS or poly I:C triggered a ~30,000-fold increase in hepatic LrTLR7 expression at 12 h post-stimulation, with kidney tissue showing secondary activation. Mucosal RBCs and PBLs displayed rapid (1-3 h) LrTLR7 upregulation following in-vitro ligand exposure. Imiquimod and gardiquimod activated LrTLR7-signalling pathways in both in-vivo and in-vitro systems, elevating transcription of IRF7 and type I interferon genes.

Conclusion: Similar to higher vertebrates, LrTLR7 plays a crucial role in responding to pathogenic invasions and various PAMPs to induce innate immunity. Consequently, TLR7 in fish represents a significant target for immune activation using specific agonists or ligands, which could aid in the prevention of fish diseases.

Keywords: Labeo rohita; PAMPS; PBLs; RBCs; TLR7; TLRs; Type-I IFN; innate immunity.


Conflict of interest statement

The authors declare that the research was conducted in the absence of any commercial or financial relationships that could be construed as a potential conflict of interest.

Figures

Figure 1
Figure 1
Schematic representation of various domains of TLR7 in different fish species. The SMART (Simple Modular Architecture Research Tool) program was used for predicting domain organization in TLR7 proteins of several fish species. The signal peptide (SP), leucine-rich repeat (LRR) domains, transmembrane domain (TM), and Toll/IL-1 receptor (TIR) domain are shown in their respective positions: (a) Labeo rohita; (b) Danio rerio; (c) Siniperca chuatsi; (d) Mastacembelus armatus; (e) Cyprinus carpio; (f) Scophthalmus maximus L.; (g) Squaliobarbus curriculus; (h) Trachinotus blochii; (i) Oncorhynchus mykiss; (j) Salmo salar; (k) Takifugu rubripes; (l) Trematomus bernacchii; (m) Paralichthys olivaceus; (n) Ictalurus punctatus.
Figure 2
Figure 2
Phylogenetic relationship of LrTLR7 with TLR7 proteins of other animal species. Full-length amino acid sequences of TLR7 from various organisms were retrieved from the GenBank database, and aligned through the Clustal Omega. To generate a phylogenetic tree, the neighbor-joining method of the MEGA7 (Molecular Evolutionary Genetics Analysis 7) software was used. The evolutionary distances were computed using the Poisson correction method and were in the units of the number of amino acid substitutions per site. Branches in the tree were assessed for their reliability through bootstrap analysis with 1,000 replications, and depicted as percentage (%) on the branches.
Figure 3
Figure 3
(a) LrTLR7 gene expressions in various embryonic developmental stages of L. rohita. Total RNA was extracted from different stages of embryonic development, and the expression of the LrTLR7 gene was analyzed by qRT-PCR. The expression of the LrTLR7 gene was represented as a ratio relative to β-actin (internal control) levels in the same samples. The gene expression at the fertilized egg stage (0 h) has been chosen as a calibrator (1), and the relative expression of LrTLR7 at various stages of development is represented as fold change from the calibrator. A representative data from three separate experiments (N=3) ± standard error (bars) has been presented. Significant difference (p<0.05) has been indicated with asterisks (*). (b) Basal expression of the LrTLR7 gene in various tissues of rohu fingerlings Total RNA was extracted from blood, brain, eye, gill, heart, intestine, kidney, liver, muscle, skin, and spleen, and qRT-PCR was carried out to investigate the expression of the LrTLR7 gene among the tissues. The expression of LrTLR7 gene transcript levels in each tissue has been represented as a ratio relative to β-actin (internal control) levels in the same samples. Among the tissues examined, skin expressed the lowest level of LrTLR7 and was chosen as the calibrator (1). The LrTLR7 gene expression in other tissues has been represented as fold changes from the calibrator. Representative data from three separate experiments (N=3) ± standard error (bars) have been presented. Significant (p<0.05) difference has been indicated with asterisks (*).
Figure 4
Figure 4
Expression of the LrTLR7 gene in response to Aeromonas hydrophila infection. Rohu fingerlings were either mock-infected (control) or infected with A. hydrophila (1×10⁶ CFU fish−1) by i.p. injection, and after the designated time course, total RNA was extracted from the control and infected fish tissues, cDNA was synthesized, and qRT-PCR was performed to analyze LrTLR7 gene expression. The expression of the LrTLR7 gene was analyzed, keeping β-actin as an internal control. Representative data of one experiment out of three separate experiments (N=3) are shown along with standard error (bars). Significant (p<0.05) differences in LrTLR7 gene expression between the control and infected fish groups are indicated with asterisks (*). LrTLR7 gene expression in A. hydrophila-infected fish (a) gill, (b) liver, (c) kidney, and (d) blood.
Figure 5
Figure 5
Expression of LrTLR7 gene in response to Edwardsiella tarda infection. Rohu fingerlings were either mock-infected (control) or infected with E. tarda (1×10⁶ CFU fish−1) by i.p. injection, and after the designated time course, total RNA was extracted from the control and infected fish tissues, cDNA was synthesized, and qRT-PCR was employed to analyze LrTLR7 gene expression. The expression of the LrTLR7 gene was analyzed keeping β-actin as an internal control. Representative data from one experiment out of three separate experiments (N=3) are shown along with standard error (bars). Significant (p<0.05) differences in LrTLR7 gene expression between the control and infected fish groups are indicated with asterisks (*). LrTLR7 gene expression in the E. tarda-infected fish (a) gill, (b) liver, (c) kidney, and (d) blood.
Figure 6
Figure 6
Modulation of LrTLR7 gene expression in RBCs and PBLs following bacterial infections. Rohu fingerlings were either mock-infected (control) or infected with A. hydrophila or E. tarda (1×10⁶ CFU fish−1) by i.p. injection, and after the designated time course, mucosal RBC or PBLs were isolated from the control and infected fish, total RNA was extracted, and cDNA was prepared. Then, qRT-PCR assay was conducted to analyze the expression of the LrTLR7 gene keeping β-actin as an internal control. Representative data from one experiment out of three separate experiments (N=3) are shown along with the standard error (bars). Significant differences between the control and infected fish RBCs and PBLs are indicated with asterisks (*). LrTLR7 gene expression in the A. hydrophila infected fish mucosal RBCs (a), and PBLs (b), and E. tarda infected fish mucosal RBCs (c) and PBLs (d).
Figure 7
Figure 7
LrTLR7 is induced in LRG cells during bacterial pathogenesis. The L. rohita gill (LRG) cell line was cultured for 48 h, and then it was either mock-infected or infected with A. hydrophila or E. tarda (with 1 MOI) for the respective time points. Then, the control and infected cells were observed under microscope (10×) to visualize the morphological changes following infections. After the designated time, total RNA was extracted from the mock-infected and bacteria infected cells, and cDNA was synthesized followed by qRT-PCR assay to analyze the LrTLR7 gene expression keeping β-actin as an internal control. The results are expressed as one representative data from three separate experiments (N=3) along with standard error (bars). Significant (p< 0.05) differences between the control and infected cells are indicated with asterisks (*). (a) Control, (b) 1 h-A. hydrophila-infected, (c) 2.30 h-A. hydrophila-infected, (d) control, (e) 1 h-E. tarda-infected, (f) 3 h-E. tarda-infected LRG cells. LrTLR7 gene expression post A. hydrophila (g) and E. tarda (h) infection.
Figure 8
Figure 8
In-vivo induction of LrTLR7 gene in response to LPS stimulation. Rohu fingerlings were either mock-stimulated or i.p. injected with LPS (50 µg/fish), and following the time course, total RNA was extracted from the control and LPS-stimulated fish tissues at 6, 12, 24, and 36 h post-stimulation. The cDNA was prepared, and the LrTLR7 gene expression was analyzed through qRT-PCR assay keeping β-actin as an internal control. The results are expressed as one representative data from three separate experiments (N=3) along with standard error (bars). Significant (p<0.05) differences between the control and LPS-stimulated samples are indicated with asterisks (*). LrTLR7 gene expression in the LPS-stimulated fish group: (a) gill, (b) liver, (c) kidney, and (d) blood.
Figure 9
Figure 9
In-vivo induction of LrTLR7 gene in response to poly I:C stimulation. Rohu fingerlings were either mock-stimulated or i.p. injected with poly I:C (200 µg/fish), and following the time course, total RNA was extracted from the control and stimulated fish tissues at 6, 12, 24, and 36 h post-stimulation. The cDNA was prepared, and the LrTLR7 gene expression was analyzed through qRT-PCR assay, keeping β-actin as an internal control. The results are expressed as one representative data from three separate experiments (N=3) along with standard error (bars). Significant (p<0.05) differences between the control and stimulated samples are indicated with asterisks (*). LrTLR7 gene expression in the poly I:C-stimulated fish group: (a) gill, (b) liver, (c) kidney, and (d) blood.
Figure 10
Figure 10
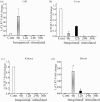
In-vitro modulation of LrTLR7 gene expression in the mucosal RBCs and PBLs following LPS and poly I:C stimulation. Purified mucosal RBCs and PBLs (107 cells/ml/well) were cultured in their respective media and were either mock-stimulated or stimulated with LPS (in RBCs: 10 µg/ml/well and in PBLs: 20 µg/ml/well) or poly I:C (RBCs and PBLs: 100 µg/ml/well) for 1 and 3 h. After the designated time course, total RNA was extracted from the control and LPS or poly I:C-stimulated cells and cDNA was prepared. The qRT-PCR assay was conducted to analyze the LrTLR7 gene expression, keeping β-actin as an internal control. Representative data of one experiment out of three separate experiments (N=3) are shown along with the standard error (bars). A significant (p<0.05) difference in LrTLR7 gene expression between the control and stimulated RBCs and PBLs has been indicated with asterisks (*). LPS-stimulated mucosal RBCs (a) and PBLs (b); and poly I:C-stimulated mucosal RBCs (c) and PBLs (d).
Figure 11
Figure 11
In-vitro activation of LrTLR7-signal transduction pathways by imiquimod and gardiquimod. The L. rohita gill (LRG) cell line was cultured for 48 h and was either mock-stimulated or stimulated with imiquimod or gardiquimod (10 μg/ml), and then the morphological changes of the cells were observed under microscope (10×) (upper panel figures). After the designated time course, total RNA was extracted from the mock-stimulated and ligand-stimulated cells followed by qRT-PCR assay to analyze the LrTLR7, IRF7, and type-I IFN gene expression, keeping β-actin as an internal control. The results are expressed as one representative data from three separate experiments (N=3) along with the standard error (bars). Significant (p<0.05) differences between the control and stimulated LRG cells are indicated with asterisks (*). (a) LrTLR7 gene expression, (b) IRF7 gene expression, and (c) type-I IFN gene expression in the imiquimod and gardiquimod stimulated LRG cells.
Figure 12
Figure 12
In-vivo LrTLR7 gene expression in response to imiquimod stimulation. Rohu fingerlings were either mock-stimulated or i.p. injected with imiquimod (10 µg/fish), and following the time course, total RNA was extracted from the control and stimulated fish tissues. The cDNA was prepared, and LrTLR7 gene expression was analyzed through qRT-PCR assay keeping β-actin as an internal control. The results are expressed as one representative data from three separate experiments (N=3) along with the standard error (bars). Significant (p<0.05) differences between the control and imiquimod-stimulated fish tissues have been indicated with asterisks (*). LrTLR7 gene expression in the imiquimod-stimulated fish group: (a) gill, (b) liver, (c) kidney, and (d) blood.
Figure 13
Figure 13
In-vivo LrTLR7 gene expression in response to gardiquimod stimulation. Rohu fingerlings were either mock-stimulated or i.p. injected with gardiquimod (10 µg/fish), and following the time course, total RNA was extracted from the control and stimulated fish tissues at 6, 12, 24, and 36 h post-stimulation. The cDNA was prepared, and LrTLR7 gene expression was analyzed through qRT-PCR assay keeping β-actin as an internal control. The results are expressed as one representative data from three separate experiments (N=3) along with the standard error (bars). Significant (p<0.05) differences between the control and gardiquimod-stimulated fish tissues have been indicated with asterisks (*). LrTLR7 gene expression in the gardiquimod-stimulated fish group: (a) gill, (b) liver, (c) kidney, and (d) blood.
Figure 14
Figure 14
IRF7 and type I IFN gene expression in response to imiquimod and gardiquimod stimulation. Rohu fingerlings were either mock-stimulated or i.p. injected with imiquimod or gardiquimod and following the time course, total RNA was extracted from the control and stimulated fish tissues. The cDNA was prepared and expression of IRF7, and type-I IFN genes were analyzed through qRT-PCR assay keeping β-actin as an internal control. The results are expressed as one representative data from three separate experiments (N=3) along with standard error (bars). Significant (p<0.05) differences between the control and stimulated fish samples have been indicated with asterisks (*). In imiquimod-stimulated fish tissues, IRF7 gene expression and type- I IFN gene expression are shown in gill (a) and blood (b). In gardiquimod-stimulated fish tissues, IRF7 gene expression and type I IFN gene expression are shown in gill (c), liver (d), and blood (e).

Similar articles

References

    1. Akira S, Uematsu S, Takeuchi O. Pathogen recognition and innate immunity. Cell. (2006) 124:783–801. doi: 10.1016/j.cell.2006.02.015 - DOI - PubMed
    1. Rauta PR, Samanta M, Dash HR, Nayak B, Das S. Toll-like receptors (TLRs) in aquatic animals: signaling pathways, expressions and immune responses. Immunol Lett. (2014) 158:14–24. doi: 10.1016/j.imlet.2013.11.013 - DOI - PubMed
    1. Kawai T, Akira S. The role of pattern-recognition receptors in innate immunity: update on Toll-like receptors. Nat Immunol. (2010) 11:373–84. doi: 10.1038/ni.1863 - DOI - PubMed
    1. Takeda K, Akira S. Toll-like receptors. Curr Protoc Immunol. (2015) 109:14–2. doi: 10.1002/0471142735.im1412s109 - DOI - PubMed
    1. Lim KH, Staudt LM. Toll-like receptor signaling. Cold Spring Harbor Perspect Biol. (2013) 5:a011247. doi: 10.1101/cshperspect.a011247 - DOI - PMC - PubMed

MeSH terms

Substances

LinkOut - more resources