

Ecological mechanisms of microbial assembly in clonal plant Glechoma longituba: from soil to endosphere
- PMID: 40353652
- PMCID: PMC12175508
- DOI: 10.1128/aem.00336-25
Ecological mechanisms of microbial assembly in clonal plant Glechoma longituba: from soil to endosphere
Abstract
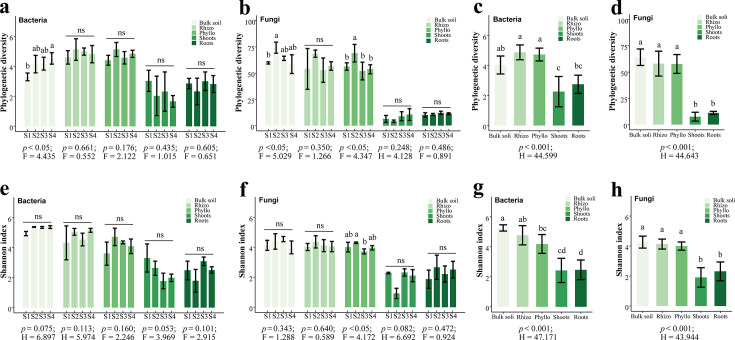
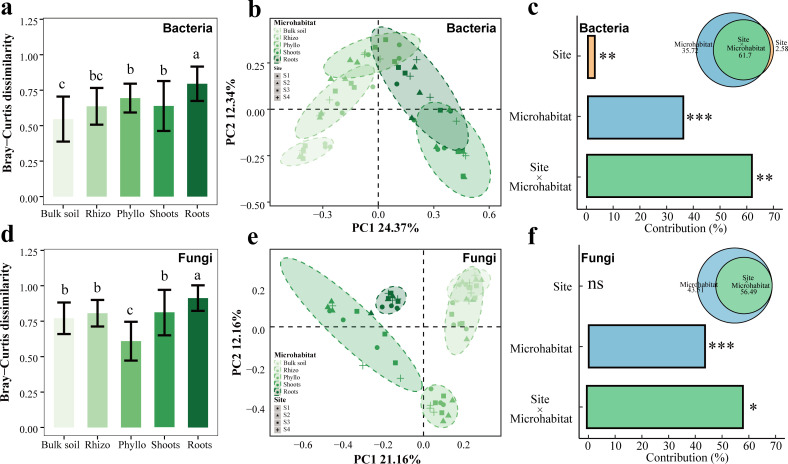
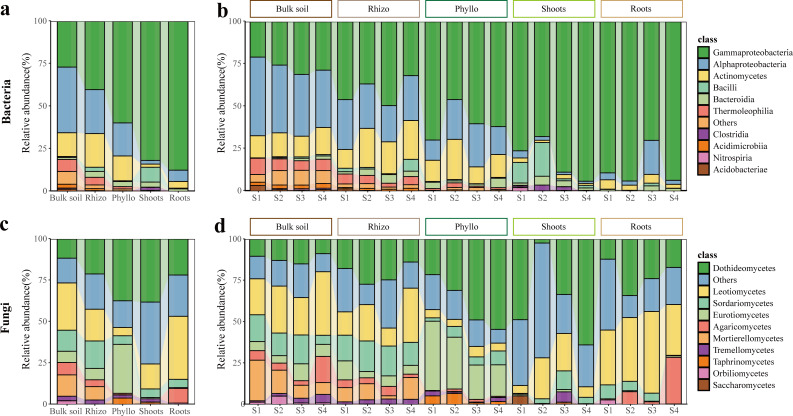
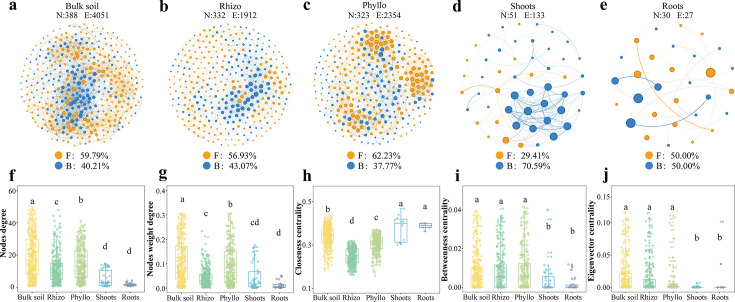
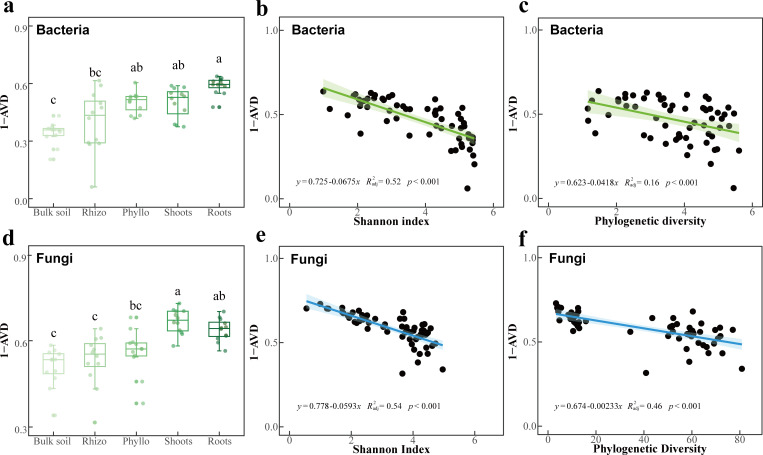
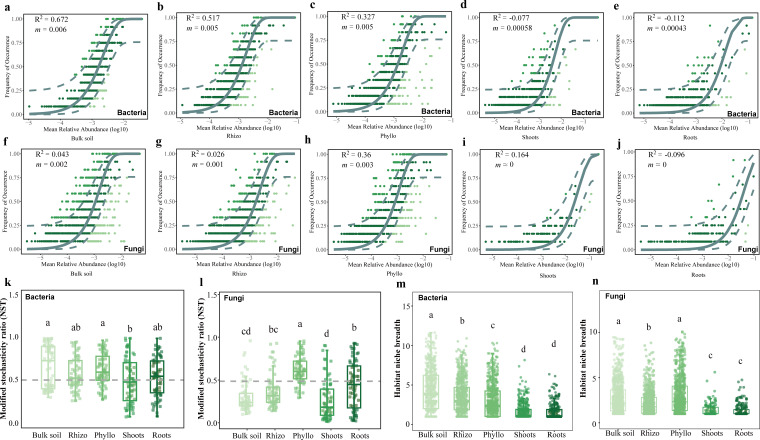
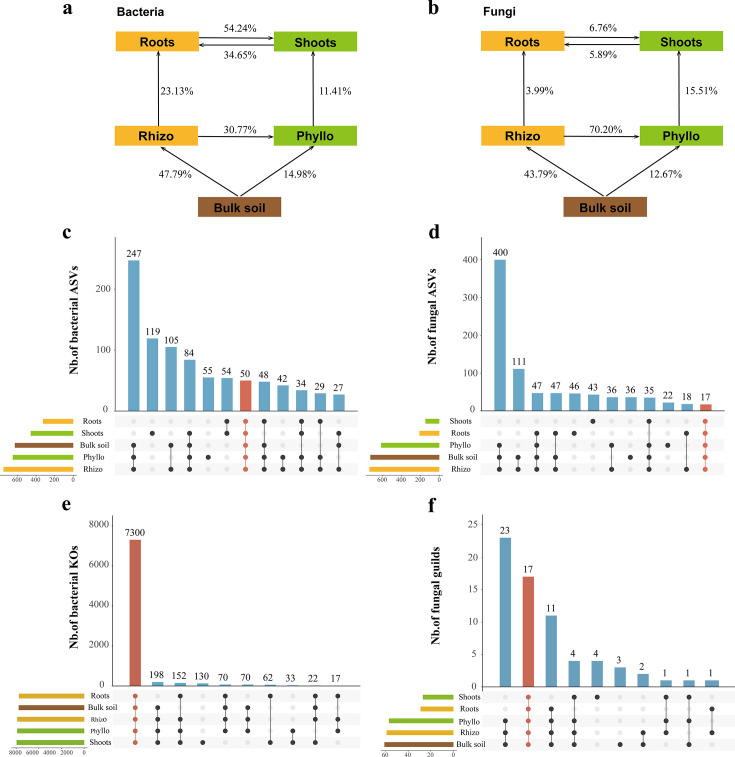
Climate change presents significant challenges to plant growth and reproduction. Clonal plants, with low genetic diversity, are particularly vulnerable due to their limited adaptive capacity. Plant-associated microbiomes can play a crucial role in enhancing clonal plant survival and adaptability, yet the mechanisms governing microbial community assembly along the soil-episphere-endosphere continuum remain unclear. In this study, we investigated microbial community assembly patterns in the clonal plant Glechoma longituba. Our findings demonstrate that the assembly of microbial communities is primarily driven by host-related factors rather than external environmental filtering. First, host selection reduced α-diversity and network complexity while increasing β-diversity and community stability. Second, the mechanisms of microbial assembly transitioned from stochastic dominance in bulk soil and epiphytic compartments to deterministic processes within endophytic niches. Third, the taxonomic structure exhibited significant turnover along the soil-episphere-endosphere continuum, accompanied by functional redundancy to maintain ecosystem functions. The results support the hypothesis that host selection optimizes the functional composition of microbial communities by reducing diversity and network complexity while ensuring the stability of key functional microorganisms. The study emphasizes the critical role of host-microbe interactions in sustaining the adaptive and functional advantages of clonal plants, offering insights into managing sustainable plant communities under climate change.IMPORTANCEThis study highlights the vital role of plant-associated microbiomes in helping clonal plants, which have low genetic diversity, adapt to climate change. By examining the clonal plant Glechoma longituba, the research reveals that the plant itself plays a key role in shaping its microbial communities, rather than external environmental factors. Host selection simplifies microbial diversity and network complexity but enhances community stability and functional efficiency. These findings suggest that clonal plants can optimize their microbiomes to maintain critical functions. This work provides valuable insights into how plants and microbes interact to improve resilience, offering potential strategies for managing plant communities in a changing climate. By understanding these mechanisms, we can better support sustainable ecosystems and agricultural practices in the face of global environmental challenges.
Keywords: clonal plant; community assembly; host selection; soil-episphere-endosphere continuum.
Conflict of interest statement
The authors declare no conflict of interest.
Figures
Similar articles
-
Determinism and stochasticity drive microbial community assembly and microbial interactions in calcareous glacier forefields.Appl Environ Microbiol. 2025 Jun 18;91(6):e0030225. doi: 10.1128/aem.00302-25. Epub 2025 May 15. Appl Environ Microbiol. 2025. PMID: 40372053 Free PMC article.
-
A tale of two vineyards: parsing site-specific differences in bacterial and fungal communities of wine grapes from proximal vineyards and their changes during processing in a single winery.Appl Environ Microbiol. 2025 Jun 18;91(6):e0052625. doi: 10.1128/aem.00526-25. Epub 2025 May 5. Appl Environ Microbiol. 2025. PMID: 40323100 Free PMC article.
-
Host-Determined Diversity and Environment-Shaped Community Assembly of Phyllosphere Microbiomes in Alpine Steppes Ecosystems.Microorganisms. 2025 Jun 19;13(6):1432. doi: 10.3390/microorganisms13061432. Microorganisms. 2025. PMID: 40572320 Free PMC article.
-
Unboxing the black box-one step forward to understand the soil microbiome: A systematic review.Microb Ecol. 2023 Feb;85(2):669-683. doi: 10.1007/s00248-022-01962-5. Epub 2022 Feb 2. Microb Ecol. 2023. PMID: 35112151 Free PMC article.
-
Continuous cropping obstacles in medicinal plants: Driven by soil microbial communities and root exudates. A review.Plant Sci. 2025 Oct;359:112686. doi: 10.1016/j.plantsci.2025.112686. Epub 2025 Jul 26. Plant Sci. 2025. PMID: 40721126 Review.
References
-
- Grimm NB, Chapin FS III, Bierwagen B, Gonzalez P, Groffman PM, Luo Y, Melton F, Nadelhoffer K, Pairis A, Raymond PA, Schimel J, Williamson CE. 2013. The impacts of climate change on ecosystem structure and function. Frontiers in Ecol & Environ 11:474–482. doi: 10.1890/120282 - DOI
MeSH terms
Grants and funding
LinkOut - more resources
Full Text Sources
