

Cellular transcription factor TFII-I represses adenovirus gene expression
- PMID: 40353670
- PMCID: PMC12172414
- DOI: 10.1128/jvi.00618-25
Cellular transcription factor TFII-I represses adenovirus gene expression
Abstract
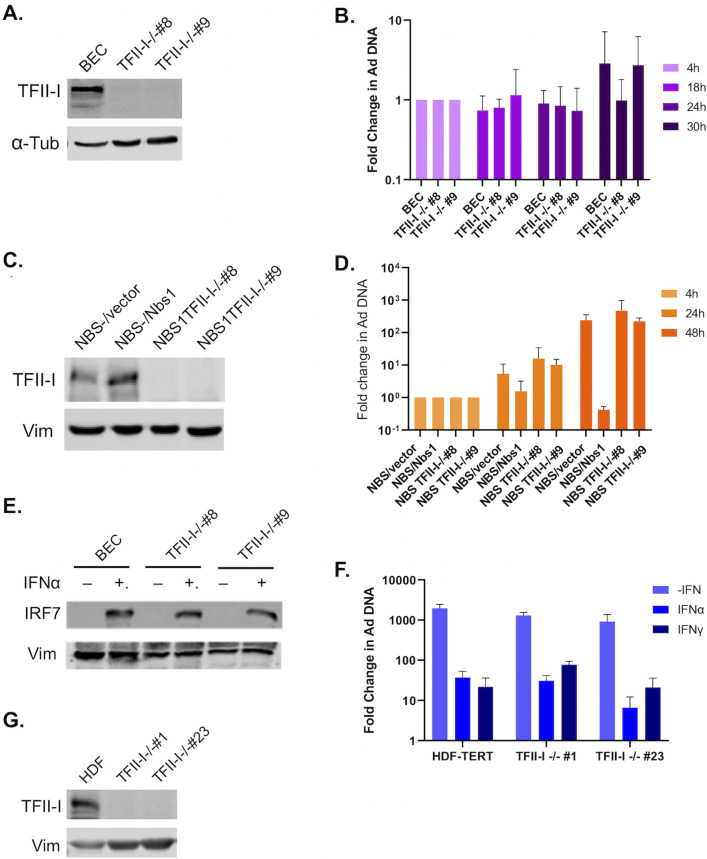
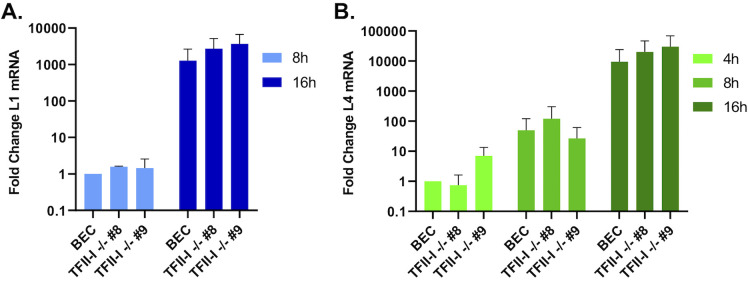
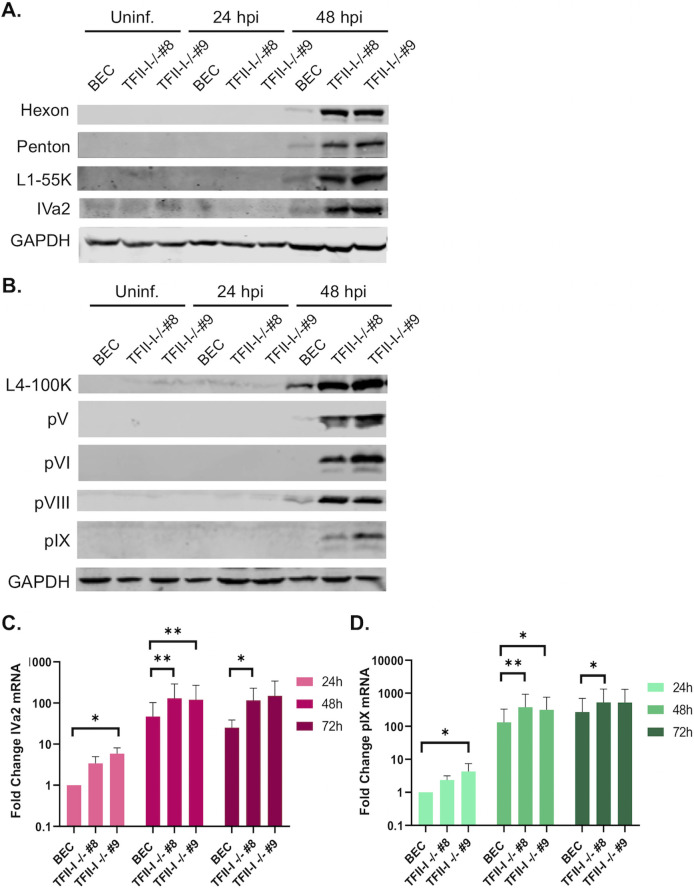
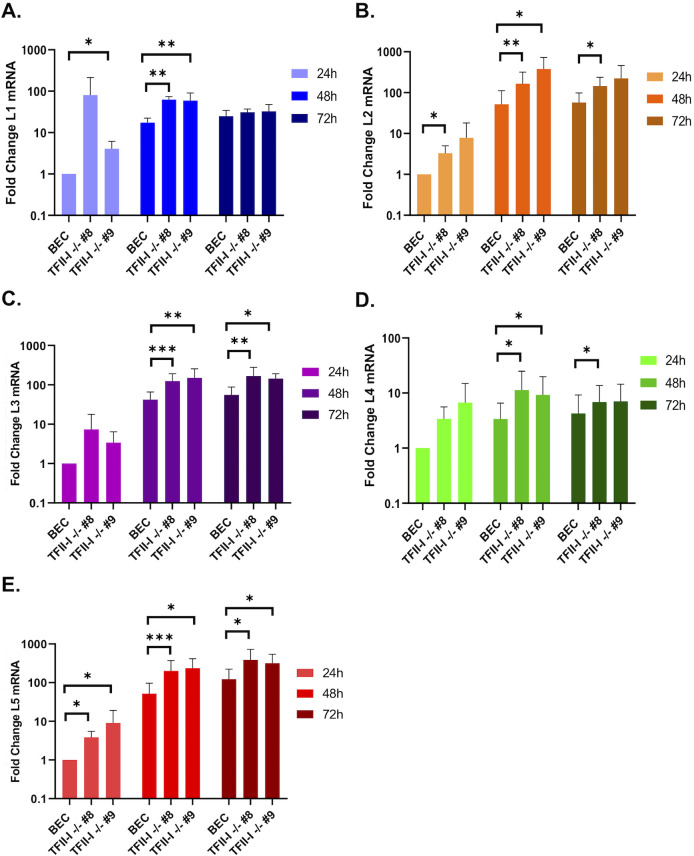
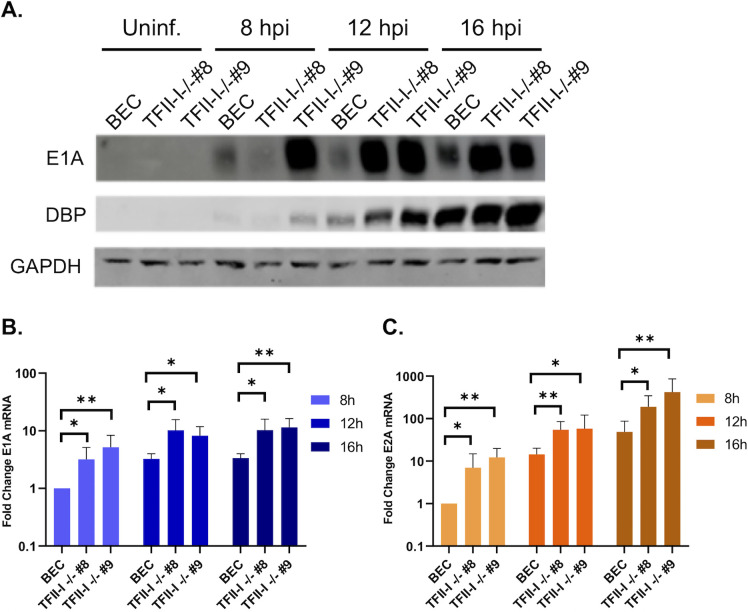
To successfully replicate, viruses must overcome innate cellular antiviral responses. With human adenovirus (HAdV), a key viral repressor of cellular antiviral responses is the early protein E4ORF3. E4ORF3 relocalizes numerous cellular antiviral proteins, particularly those involved in the interferon (IFN) and DNA damage response (DDR) pathways, to sequester them from viral replication sites in the nucleus. E4ORF3 also directs SUMO modification of a subset of its targets, some of which are subsequently targeted for proteasomal degradation. We previously identified TFII-I, a cellular transcription factor and DNA repair protein, as one of the proteins most highly SUMOylated by E4ORF3, as well as one of the E4ORF3 degradation targets. In this study, we characterized the effect of TFII-I knockout (KO) on HAdV replication. TFII-I KO significantly increased the infectious virus yield from infected cells, supporting the hypothesis that TFII-I acts as a restriction factor during HAdV infection. TFII-I KO also significantly increased viral genome replication, as well as both early and late gene and protein expression. Our results do not support TFII-I acting as a part of either the DDR or IFN responses during HAdV infection. Our results characterize a novel antiviral function for TFII-I against HAdV that occurs during the early stage of the viral replication cycle and highlight the importance of studying viral countermeasures to the cellular antiviral response, like E4ORF3, to better understand how cells restrict viral infection.IMPORTANCEThe cellular transcription factor TFII-I was previously shown to bind to HAdV late promoters and to E4-mutant viral genomes during replication. More recently, TFII-I was shown to be a degradation target of HAdV protein E4ORF3. Due to the long-established importance of E4ORF3 in countering cellular antiviral responses, this raised the question of whether TFII-I possesses an undiscovered antiviral role against HAdV. It was hypothesized that whether TFII-I played an antiviral role in HAdV infection, it was most likely to be as a repressor of the late transcriptional program. Here, we show the first direct evidence of TFII-I repressing HAdV infection and demonstrate that the inhibitory effect can be detected much earlier in the viral life cycle than previously predicted. Our findings provide insight into the role of TFII-I in the cellular antiviral response.
Keywords: GTF2I; TFII-I; Viral DNA Replication; adenovirus; gene expression.
Conflict of interest statement
The authors declare no conflict of interest.
Figures


Similar articles
-
A MicroRNA Screen Identifies the Wnt Signaling Pathway as a Regulator of the Interferon Response during Flavivirus Infection.J Virol. 2017 Mar 29;91(8):e02388-16. doi: 10.1128/JVI.02388-16. Print 2017 Apr 15. J Virol. 2017. PMID: 28148804 Free PMC article.
-
Adenovirus Remodeling of the Host Proteome and Host Factors Associated with Viral Genomes.mSystems. 2021 Aug 31;6(4):101128msystems0046821. doi: 10.1128/mSystems.00468-21. Epub 2021 Aug 31. mSystems. 2021. PMID: 34463575 Free PMC article.
-
GSK3A promotes human adenovirus replication and phosphorylates viral L4-22K protein.Life Sci Alliance. 2025 Jun 19;8(9):e202503320. doi: 10.26508/lsa.202503320. Print 2025 Sep. Life Sci Alliance. 2025. PMID: 40537285 Free PMC article.
-
E4orf1: The triple agent of adenovirus - Unraveling its roles in oncogenesis, infectious obesity and immune responses in virus replication and vector therapy.Tumour Virus Res. 2024 Jun;17:200277. doi: 10.1016/j.tvr.2024.200277. Epub 2024 Feb 28. Tumour Virus Res. 2024. PMID: 38428735 Free PMC article. Review.
-
Assessing the comparative effects of interventions in COPD: a tutorial on network meta-analysis for clinicians.Respir Res. 2024 Dec 21;25(1):438. doi: 10.1186/s12931-024-03056-x. Respir Res. 2024. PMID: 39709425 Free PMC article. Review.
References
-
- Hearing P. 2022. Adenoviruses, p 129–171. In Howley P, Knipe D (ed), Fields virology, Volume 2: DNA viruses. Wolters Kluwer, Philadelphia.
MeSH terms
Substances
Grants and funding
LinkOut - more resources
Full Text Sources
Research Materials
Miscellaneous
