. 2025 May 12;21(5):e1012988.
doi: 10.1371/journal.pcbi.1012988. eCollection 2025 May.

Mathematical modeling of malaria vaccination with seasonality and immune feedback

Affiliations

Mathematical modeling of malaria vaccination with seasonality and immune feedback

Zhuolin Qu et al. PLoS Comput Biol. .

Abstract

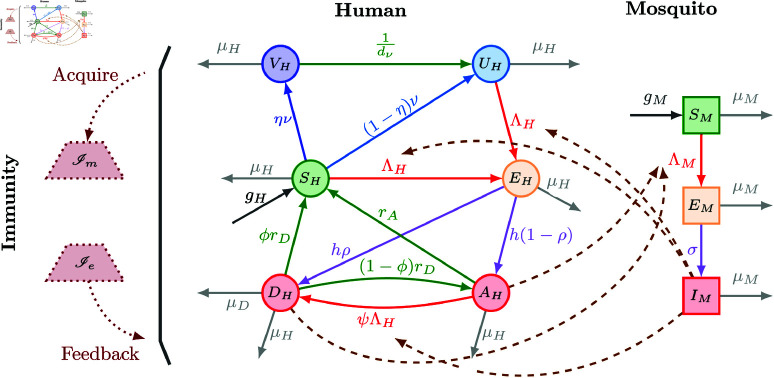
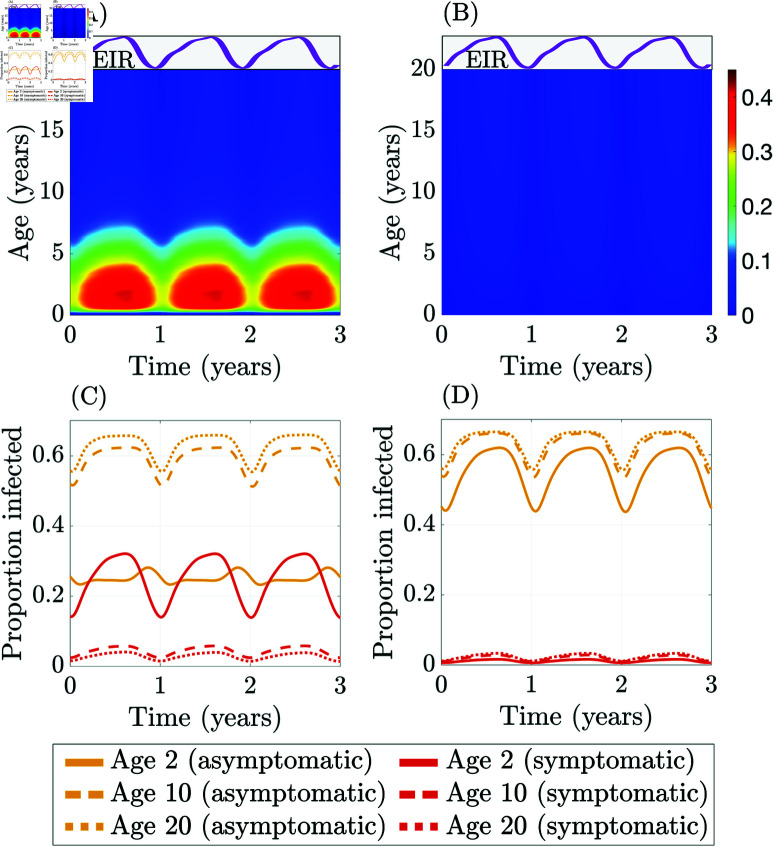
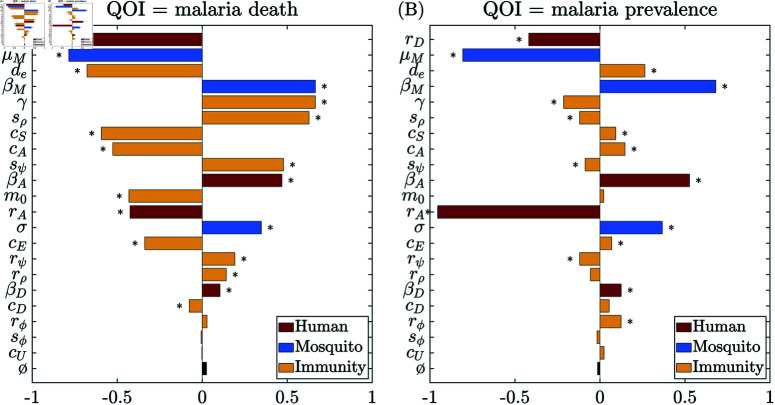
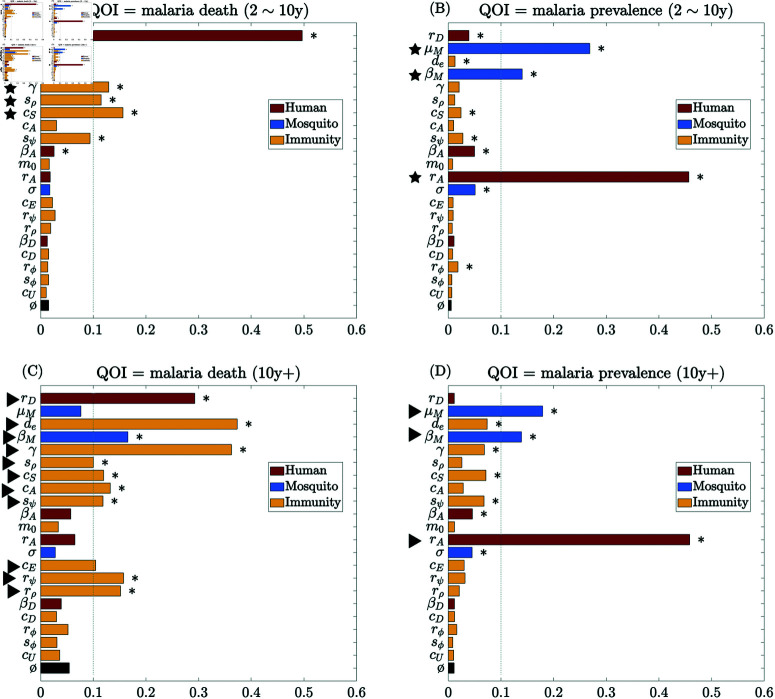
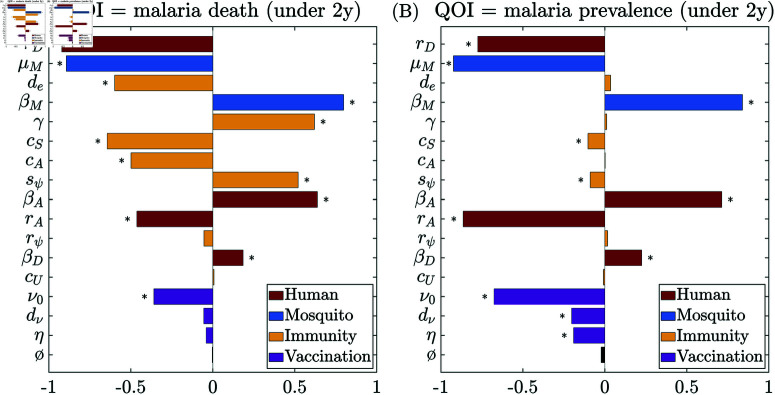
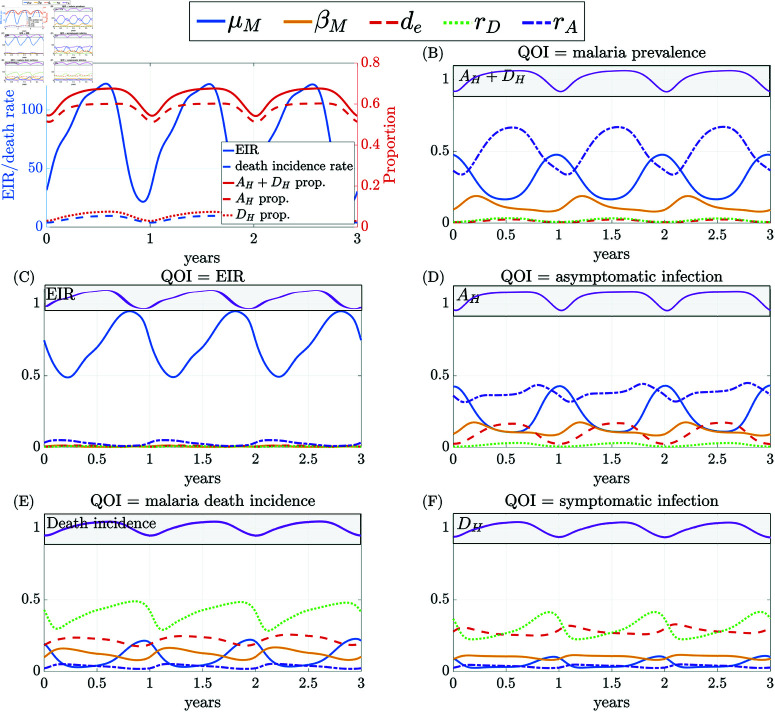
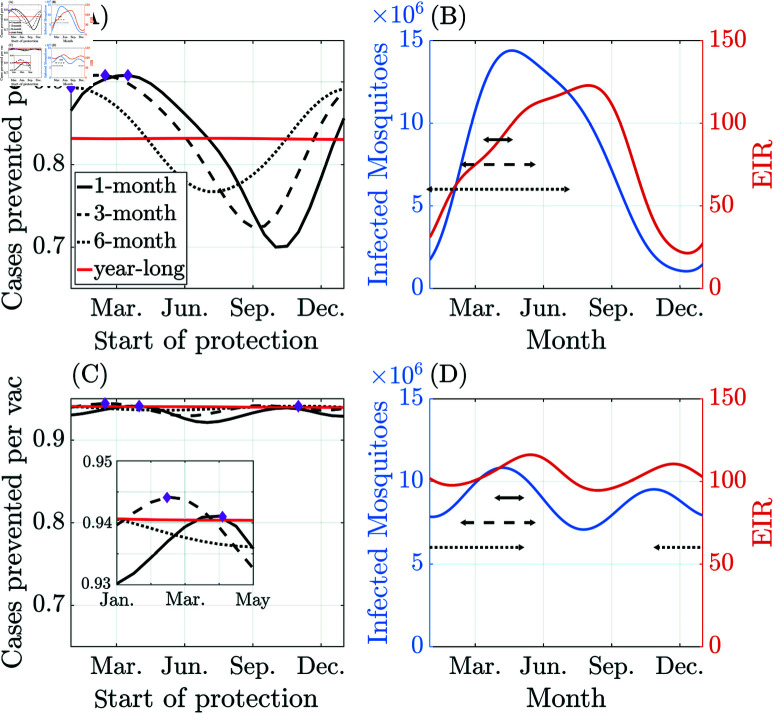
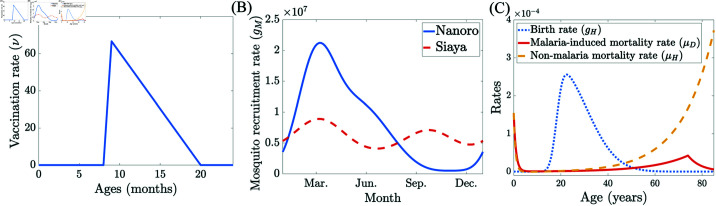
Malaria is one of the deadliest infectious diseases globally, claiming hundreds of thousands of lives each year. The disease presents substantial heterogeneity among the population, with approximately two-thirds of fatalities occurring in children under five years old. Immunity to malaria develops through repeated exposure and plays a crucial role in disease dynamics. Seasonal environmental fluctuations, such as changes in temperature and rainfall, lead to temporal heterogeneity and further complicate transmission dynamics and the utility of intervention strategies. We employ an age-structured partial differential equation model to characterize seasonal malaria transmission and assess vaccination strategies that vary by timing and duration. Our model integrates vector-host epidemiological dynamics across different age groups and nonlinear feedback between transmission and immunity. We calibrate the model to year-round and seasonal malaria settings and conduct extensive sensitivity analyses for both scenarios to systematically assess which assumptions lead to the most uncertainty. We use time-varying sensitivity indices to identify critical disease parameters during low and high transmission seasons. We further investigate the impact of vaccination and its implementation in the seasonal malaria settings. When implementing a three-dose primary vaccination series, seasonally targeted campaigns can prevent significantly more cases per vaccination than constant year-long programs in regions with strong seasonal variation in transmission. In such scenarios, the optimal vaccination interval aligns with the peak in infected mosquito abundance and precedes the peak in malaria transmission. In contrast, seasonal booster programs may provide limited advantages over year-long vaccination. Additionally, while increasing annual vaccination counts can reduce overall disease incidence, it yields marginal improvements in cases prevented per vaccination.


Conflict of interest statement

The authors have declared that no competing interests exist.

Figures

Fig 1
Fig 1. Infection dynamics flowchart for the full human-mosquito-immunity model.
Solid arrows indicate the flow of individuals, dashed arrows indicate exposure that leads to infection (involving interactions between vectors and hosts), and dotted arrows represent the feedback of population immunity in humans.
Fig 2
Fig 2. Fraction of symptomatic infections (out of total infections) under (A) dynamic immunity (population-averaged annual EIR 79) and (B) static high immunity where ρ0.03, ϕ0.93, ψ0.01 (population-averaged annual EIR 76).
Fraction of symptomatic and asymptomatic infections (out of the total population) under (C) dynamic immunity and (D) static high immunity for age groups 2, 10, and 20 years old.
Fig 3
Fig 3. Global sensitivity analysis results using PRCC on (A) cumulative malaria death counts and (B) malaria prevalence for the entire population at endemic quasi-steady state in the absence of vaccination and seasonality.
The dummy parameter (ø) is included as a null comparison. Significance (p0.05) is indicated with an asterisk (*). Colors indicate different categories.
Fig 4
Fig 4. Global sensitivity analysis results using eFAST on cumulative malaria death counts (left) and malaria prevalence (right) at endemic quasi-steady state in the absence of vaccination and seasonality.
(A)–(B) ages 2 10 years; and (C)–(D) over age 10 years. Total-order sensitivity index is shown for each parameter, including a dummy parameter (ø) as a null comparison. Significance (p0.05) is indicated with an asterisk (*). Markers highlight the parameters with total sensitivity index above 0.1: =210 years, =10+ years, and colors indicate different categories.
Fig 5
Fig 5. Global sensitivity analysis results using PRCC with vaccine-related parameters for children aged under 2 years for (A) cumulative malaria deaths and (B) malaria prevalence.
Significance (p0.05) is indicated with an asterisk (*). Colors indicate different categories. See S1 Fig for the corresponding eFAST results.
Fig 6
Fig 6. Time series of (A) quantities of interest (QOIs) and (B)–(F) total-order eFAST sensitivity indices under strong seasonal setting (Nanoro, Burkina Faso) for the entire population.
The magenta curve in the gray panel shows the trend of the QOI quantity in time for (B) malaria prevalence, (C) EIR, (D) fraction asymptomatic infection, (E) malaria death incidence, and (F) fraction symptomatic infection. For readability, only selected parameters are plotted here. The eFAST results for all parameters are summarized in S3 Fig. The analogous global sensitivity analysis using PRCC is shown in S4 Fig.
Fig 7
Fig 7. Comparison of seasonal vaccination programs in Nanoro (A)–(B) and Siaya (C)–(D) with efficacy reported for children under 2 years of age in year 3 of the program.
(A, C) Cases (new symptomatic infections) are prevented per year per vaccination by programs of different durations with the 1.2 × 10⁴ total annual vaccinations fixed. The (protection) start month that maximizes the cases prevented per vac is marked with a diamond for each program. (B, D) Optimal vaccination time interval (black lines) for each seasonal vaccination campaign, dynamics of the infected mosquito populations (left y-axis in blue), and EIR (right y-axis in orange). Note: The start of protection in (A, C) refers to the introduction of vaccination, which, in our model, is equivalent to the point when protection is conferred upon completion of the first three doses.
Fig 8
Fig 8. Curves from model parameterization.
(A) Age-dependent vaccination rate ν(α,·) based on a triangular distribution covering the age range 820 months old. (B) Daily seasonal mosquito recruitment rates gM(t) for Nanoro, Burkina Faso (solid curve) and Siaya, Kenya (dashed curve). (C) Demographic curves, including human age-dependent daily birth rate, gH(α), malaria-induced daily mortality rate, μD(α), and non-malaria-related daily mortality rate, μH(α) using Kenya as a representative population.
Fig 9
Fig 9. Malaria therapy data (courtesy of Drs. Jeffrey and Collins).
(A–C) Patients treated while positive for parasites and before day 30 of infection. (D–F) Patients not treated while positive for parasites, i.e., never treated or treated after the end of infection. (A),(D) Length of symptomatic infection (above gametocyte threshold and showing symptoms, i.e., fever above 100degF); (B),(E) Length of asymptomatic infection (above gametocyte threshold but not showing symptoms); (C),(F) Length of period before infectiousness. See Sect 5.4 for how this data is used to calculate rD, rA, and h.
Fig 10
Fig 10. Model calibration results for sigmoid functions and population-level behavior.
(A) Plots of the immune link function ϕ, ψ, and ρ as a function of the per person total immune level, I~H. (B) Heatmap showing the total immunity level per person I~H (unitless) as a function of age and EIR. (C) Heatmap of susceptibility, ρ(I~H) (probability of progression from EH to DH), as a function of age and EIR. (D) The proportion of symptomatic infections, DH/PH, by age and EIR. (E) Total infection, (EH  +  AH  +  DH)/PH, by age and EIR. (F) The incidence rate of new symptomatic infections from the exposed stage, specifically the transition rate from EHDH, by age and EIR. For (D)–(F), the baseline EIR scenarios are indicated with magenta-dotted curves.

Similar articles

References

    1. World Health Organization. World malaria report 2023; 2023. https://www.who.int/teams/global-malaria-programme/reports/world-malaria...
    1. World Health Organization. Global Health Observatory data repository: Life Tables; 2021. https://apps.who.int/gho/data/view.main.61860?lang=en
    1. Bill & Melinda Gates Foundation. Malaria - Eradication, Prevention, Through Innovation & Data; 2024. https://www.gatesfoundation.org/our-work/programs/global-health/malaria
    1. Najera JA, Gonzalez-Silva M, Alonso PL. Some lessons for the future from the Global Malaria Eradication Programme (1955–1969). PLoS Medicine 2011; 8(1):e1000412. - PMC - PubMed
    1. Alout H, Labbé P, Chandre F, Cohuet A. Malaria vector control still matters despite insecticide resistance. Trends Parasitol. 2017;33(8):610–618. doi: 10.1016/j.pt.2017.04.006 - DOI - PubMed

Substances