. 2025 May 20;122(20):e2418525122.
doi: 10.1073/pnas.2418525122. Epub 2025 May 12.

Mitochondria regulate MR1 protein expression and produce self-metabolites that activate MR1-restricted T cells

Affiliations

Mitochondria regulate MR1 protein expression and produce self-metabolites that activate MR1-restricted T cells

Gennaro Prota et al. Proc Natl Acad Sci U S A. .

Abstract

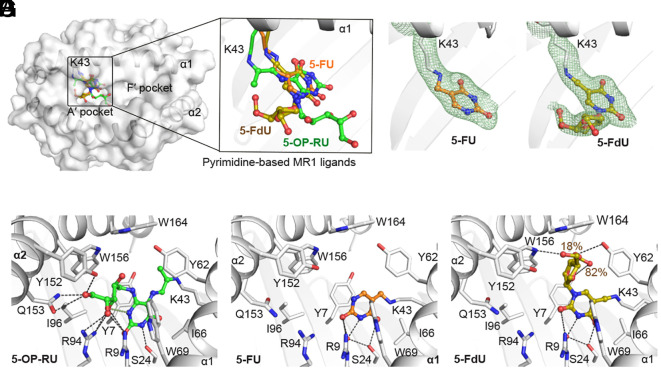
Mitochondria coordinate several metabolic pathways, producing metabolites that influence the immune response in various ways. It remains unclear whether mitochondria impact antigen presentation by the MHC-class-I-related antigen-presenting molecule, MR1, which presents small molecules to MR1-restricted T-lymphocytes. Here, we demonstrate that mitochondrial complex III and the enzyme dihydroorotate dehydrogenase are essential for the cell-surface expression of MR1 and for generating uridine- and thymidine-related compounds that bind to MR1 and are produced upon oxidation by reactive oxygen species. One mitochondria-derived immunogenic formylated metabolite we identified is 5-formyl-deoxyuridine (5-FdU). Structural studies indicate that 5-FdU binds in the A'-antigen-binding pocket of MR1, positioning the deoxyribose toward the surface of MR1 for TCR interaction. 5-FdU stimulates specific T cells and detects circulating T cells when loaded onto MR1-tetramers. 5-FdU-reactive cells resemble adaptive T cells and express the phenotypes of naïve, memory, and effector cells, indicating prior in vivo stimulation. These findings suggest that mitochondria may play a role in MR1-mediated immune surveillance.

Keywords: MR1; T cells; antigen presentation; formylated metabolite; mitochondria.


Conflict of interest statement

Competing interests statement:A.V., A.C., L.M., and G.D.L. are inventors on patent applications submitted by the University of Basel covering the use of MR1T cells and nucleobase adducts for immunomodulation. J.R. is an inventor on patents describing MR1 ligands and MR1 tetramers. All other authors declare no competing interests.

Figures

Fig. 1.
Fig. 1.
Blocking of mitochondrial activity reduces MR1 levels on the tumor’s cell surface. (A) Illustration of mitochondrial ETC composed of four complexes (I-IV). The electron flow is indicated by minus in dark circles and protons by H+. CoQ, Cytochrome C (Cyt c), and ATP synthase are involved in the process of ATP generation. (B) Cell surface expression of antigen-presenting molecules following oligomycin exposure of THP-1 cells (MHC class I and MHC class II) and THP-1 cells individually transfected with CD1a, CD1b, CD1c, CD1d, or MR1. Values represent the percentage of control of n = 7 samples in three independent experiments, and bars represent the mean values. Statistical significance was determined by comparing the control’s median fluorescence intensity (MFI) with the MFI of the respective treated group (see below for details). (C) Cell surface expression of CD1b, MR1, MHC class I, and MHC class II after oligomycin exposure of freshly isolated monocytes. Values represent the percentage of control from n = 3 samples collected from three healthy donors, and bars indicate the mean values. Statistical significance was assessed by comparing the control’s MFI with the MFI of the corresponding treated group (see below for details). (DF) Surface expression of MR1, MHC class I, and MHC class II on (D) Mel JuSo (n = 6), (E) RPMI 7932 (n = 6), and (F) A375-MR1 cells (n = 6) treated with oligomycin (closed circles) or vehicle (open circles). (G) MR1 and GFP expression levels of A375-MR1-GFP cells after exposure to oligomycin (closed circles) or vehicle (open circles) (n = 6). (H) MR1 surface levels of A375-MR1 cells exposed or not to oligomycin or Ac-6-FP or both (n = 6). (I) MR1 surface levels of A375-MR1 (open circles) and A375-MR1 ρ0 cells (closed circles) following or not exposure to Ac-6-FP (20 µM) (n = 6). Statistical evaluation was performed using the Student’s t test, ****P ≤ 0.001, ***P ≤ 0.005, **P ≤ 0.01, *P ≤ 0.05. The data show results from two independent experiments out of three performed. See also SI Appendix, Figs. S1 and S2.
Fig. 2.
Fig. 2.
CIII activity is essential to maintain basal levels of MR1 on the cell surface. (AC) Cell surface expression of (A) MR1, (B) MHC class I, and (C) MHC class II molecules following exposure of A375-MR1 cells to rotenone, 3-NPA, antimycin A, or NaN3. Values represent the MFI of n = 6 samples, and bars represent the mean values. (D) Illustration showing the reactivation of de novo synthesis of pyrimidines in ρ0 cells expressing AOX. In ρ0 cells, CIII cannot accept electrons (minus in circles) from CoQ because it is not functional. After the AOX gene transfer, CoQ donates electrons to AOX, thus becoming substrate available for DHODH, which becomes functional. (E) Survival of A375-MR1 ρ0 cells (open columns) or AOX-expressing A375-MR1 ρ0 cells (filled columns) after incubation in a medium containing dialyzed fetal bovine serum with or without uridine. The percentage of viable cells is shown (n = 5). (F) MR1 levels of A375-MR1 ρ0, or A375-MR1 ρ0 AOX assessed by flow cytometry after overnight incubation with Ac-6-FP (20 µM) or vehicle. MFI is shown (n = 6). Statistical evaluation was performed using the one-way ANOVA with Tukey’s test, ****P ≤ 0.001, ***P ≤ 0.005, (AC), or the Student’s t test, ****P ≤ 0.001 (E and F). The data shown are from two independent experiments out of three performed. See also SI Appendix, Fig. S3.
Fig. 3.
Fig. 3.
CIII inhibition decreases the response of some MR1T cell clones. (A) Response of the indicated MR1T cell clones to increasing numbers of A375-MR1 cells (APC number per well) exposed to antimycin A (filled squares) or atovaquone (filled circles) compared to unexposed cells (open circles). The released IFNγ is shown as the mean of triplicates ± SD after overnight incubation. Data are from one experiment representative of three independently performed experiments. (B) Response of the MAIT clone MRC25 to increasing doses of 5-OP-RU presented by A375-MR1 cells exposed to antimycin A (filled squares) or atovaquone (filled circles) or unexposed (open circles). The released IFNγ is shown as the mean of triplicates ± SD. Data are from one experiment representative of three independently performed experiments. (C) Response of the indicated MR1T cell clones to A375-MR1 cells exposed to antimycin A or atovaquone in the presence or absence of uridine. The released IFNγ is shown for each sample. Bars indicate the mean values (n = 5). The data displayed are from two independent experiments out of three performed. One-way ANOVA with Tukey’s test, ****P ≤ 0.001, ***P ≤ 0.005, **P ≤ 0.01. See also SI Appendix, Fig. S3.
Fig. 4.
Fig. 4.
Uridine derivatives rescue MR1T cell recognition of DHODH-inhibited cells. (A) Schematic representation of the de novo pyrimidine synthesis pathways downstream of DHODH. This enzyme catalyzes the fourth enzymatic step, the ubiquinone-mediated oxidation of dihydroorotate to orotate. Interrupted gray arrows indicate that intermediates exist between the specified compounds. The dotted arrow shows that uridine can also serve as a precursor of UMP through uridine kinase, independent of DHODH. (B) Response of five MR1T cell clones to various numbers of A375-MR1 cells (APC number per well) exposed to brequinar (filled squares), brequinar + uridine (filled circles), or vehicle (open circles). Data are from one experiment representative of three independently performed experiments. (C) Response of the same MR1T cell clones as in (B) to A375-MR1 cells exposed to brequinar and the indicated nucleosides or nucleotides. The released IFNγ is the mean ± SD (n = 6). The statistical significance refers to comparison with the group “Brequinar only.” The data displayed is from two independent experiments out of three performed. (D) Response of the CIII-dependent MR1T cell clones as in (B) after exposure to brequinar only, brequinar + thymidine, with or without NAC. Values indicate the mean ± SD of triplicates. Data are from one experiment representative of three independently performed experiments. One-way ANOVA with Tukey’s test, ****P ≤ 0.001, ***P ≤ 0.005, **P ≤ 0.01, *P ≤ 0.05. See also SI Appendix, Figs. S4 and S5.
Fig. 5.
Fig. 5.
5-FdU stimulates MR1T cell cells. (A) Structure of 5-formyl-deoxyuridine and 5-formyl-uracil. (B) Competition for MR1 binding of 5-FdU or 5-FU assessed by the response of the MRC25 MAIT cell clone to 5-OP-RU presented by fixed A375-MR1 cells pulsed with increasing concentrations of 5-FdU or 5-FU. The released IFNγ is shown as the mean of triplicates ± SD. (C) Response of two MR1T and control MAIT clones to A375-MR1 fixed and then pulsed with the indicated antigens. The released IFNγ is shown as the mean of triplicates ± SD. (D) Response of the indicated MR1T cell clones to plastic-bound sMR1 monomers refolded with 5-FdU in the presence or absence of anti-MR1 mAbs. The released IFNγ is shown as the mean of triplicates ± SD. (E) Staining of JK cells transduced with the indicated TCR genes and stained with various PE-labeled MR1-tetramers. Data are from one experiment representative of three independently performed experiments. One-way ANOVA with Tukey’s test, ****P ≤ 0.001, ***P ≤ 0.005, *P ≤ 0.05. See also SI Appendix, Fig. S5.
Fig. 6.
Fig. 6.
Ex vivo analysis of MR1-5-FdU tetP cells. (A) Ex vivo frequencies of MR1-5-FdU tetP T cells from the peripheral blood of 10 healthy donors. Dots represent individual donors; the horizontal bars represent the median values. (B) Ex vivo frequencies of MR1-5-FdU tetP T cells that costain with the MR1-6-FP tetramer or the MR1-5-OP-RU tetramer. Dots represent individual donors; the horizontal bars represent the median values. (C) Percentages of naïve, central memory (TCM), effector memory (TEM), and terminally differentiated (TEMRA) T cell populations within the MR1-5-FdU tetP T cells. Dots represent individual donors; the horizontal bars represent the median values. (D and E) Uniform Manifold Approximation and Projection of the cells were used for the clustering analysis, with cluster identity overlaid as color on tetN (D) or tetP (E) cells. The cells within clusters 4, 9, and 12 are circled. (F) Heatmap of median asinh-transformed expression of the markers used for clustering. Color scales indicate the enrichment of MR1-5-FdU tetP cells and tetN cells and the fraction of total cells (% of total) in each cluster. See also SI Appendix, Figs. S6 and S7.
Fig. 7.
Fig. 7.
Crystal structures of MR1 complexed with 5FU and 5-FdU. (A) Top view of the antigen binding cleft of the respective MR1 molecules displaying the position of the 5-FU and 5F-dU within the A’ pocket of MR1. (B) Zoomed view of the A’ pocket revealing novel orientation of the deoxyribose sugar of 5-FdU compared to the ribityl chain of 5-OP-RU. (C and D) Electron density maps of 5-FU (C) and 5-FdU (D) after simulated-annealing refinement (using the Phenix-refine crystallographic structure-refinement program), presented as a 2Fobserved−Fcalculated map (green mesh) contoured at 1σ that highlight the unambiguous positions of the nucleobases within MR1 cleft. (EG) Interactions between the 5-OP-RU (PDB; 6PUC) (E), 5-FU (F), and 5-FdU (G) and the residues of MR1- A’ pocket. MR1 is white, and the ligands are as follows: 5-FU, orange; 5-FdU, olive; and 5-OP-RU, green. The CDR3α and CDR3β loop are pink and light blue, respectively. See also SI Appendix, Fig. S8 and Table S1.

References

    1. Monzel A. S., Enriquez J. A., Picard M., Multifaceted mitochondria: Moving mitochondrial science beyond function and dysfunction. Nat. Metab. 5, 546–562 (2023). - PMC - PubMed
    1. Zhao R. Z., Jiang S., Zhang L., Yu Z. B., Mitochondrial electron transport chain, ROS generation and uncoupling (Review). Int. J. Mol. Med. 44, 3–15 (2019). - PMC - PubMed
    1. Anderson A. J., Jackson T. D., Stroud D. A., Stojanovski D., Mitochondria-hubs for regulating cellular biochemistry: Emerging concepts and networks. Open Biol. 9, 190126 (2019). - PMC - PubMed
    1. Angajala A., et al. , Diverse roles of mitochondria in immune responses: Novel insights into immuno-metabolism. Front. Immunol. 9, 1605 (2018). - PMC - PubMed
    1. Bahat A., MacVicar T., Langer T., Metabolism and innate immunity meet at the mitochondria. Front. Cell Dev. Biol. 9, 720490 (2021). - PMC - PubMed

MeSH terms

Substances

LinkOut - more resources