. 2025 May 9;104(19):e42376.
doi: 10.1097/MD.0000000000042376.

Identification of genetic indicators linked to immunological infiltration in idiopathic pulmonary fibrosis

Affiliations

Identification of genetic indicators linked to immunological infiltration in idiopathic pulmonary fibrosis

Yan Huang et al. Medicine (Baltimore). .

Abstract

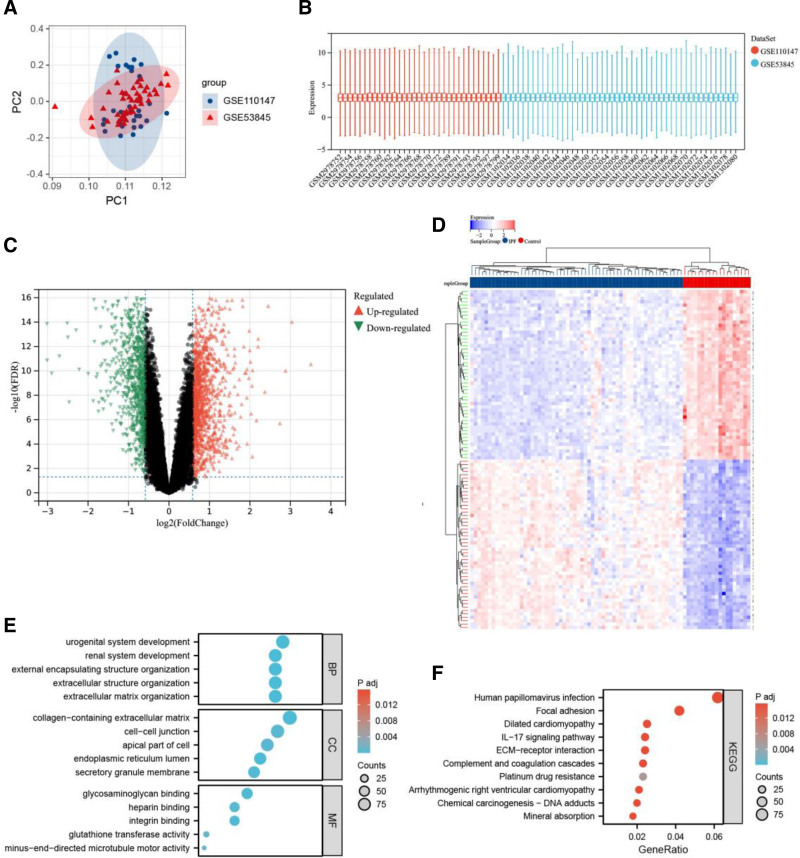
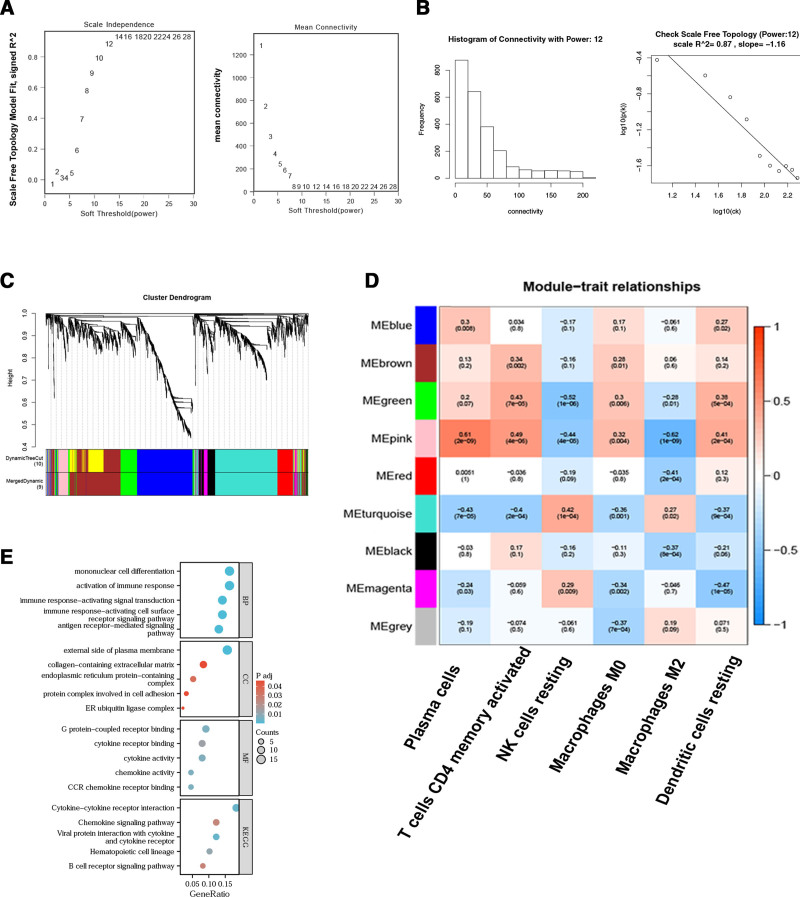
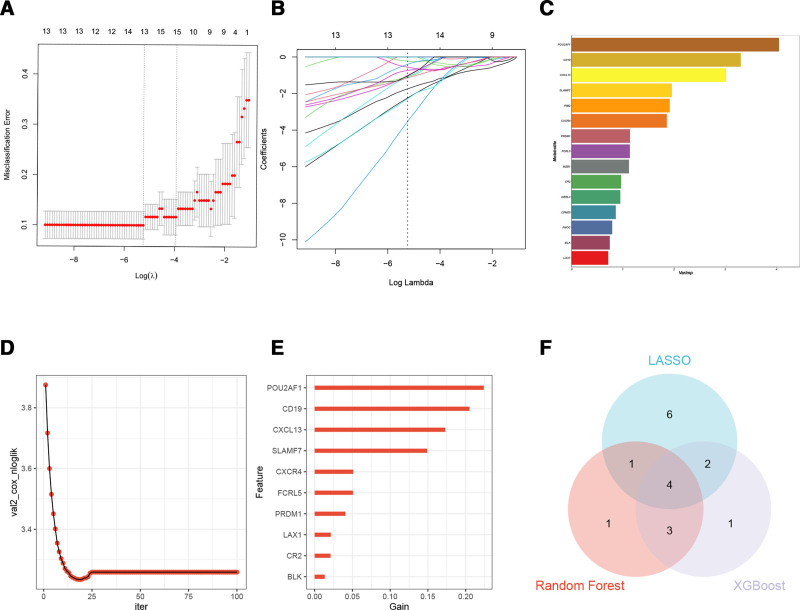
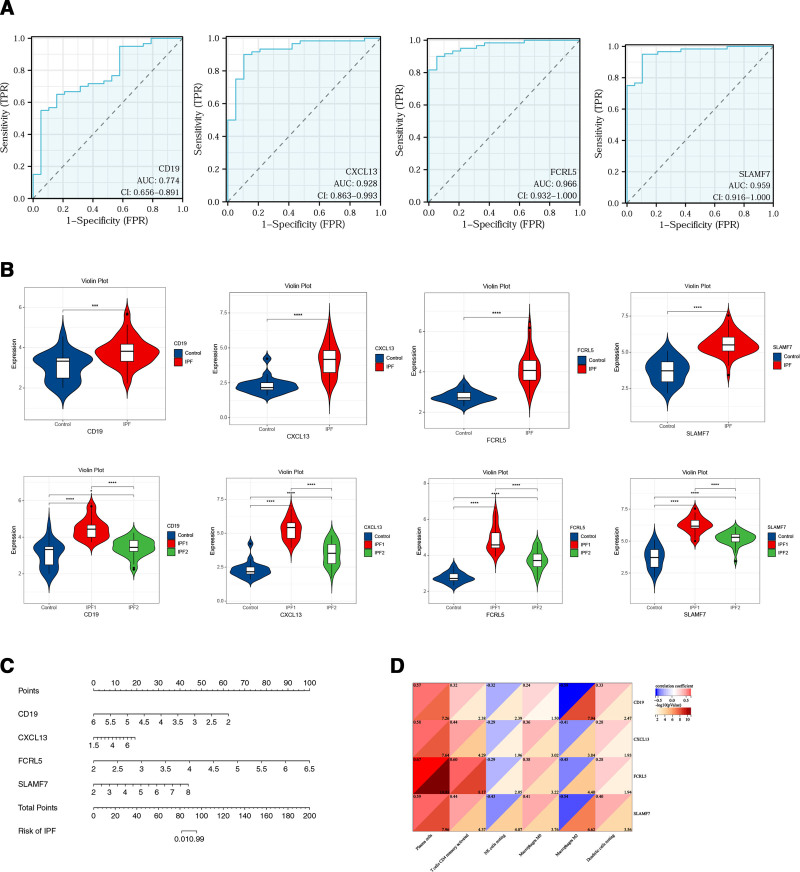
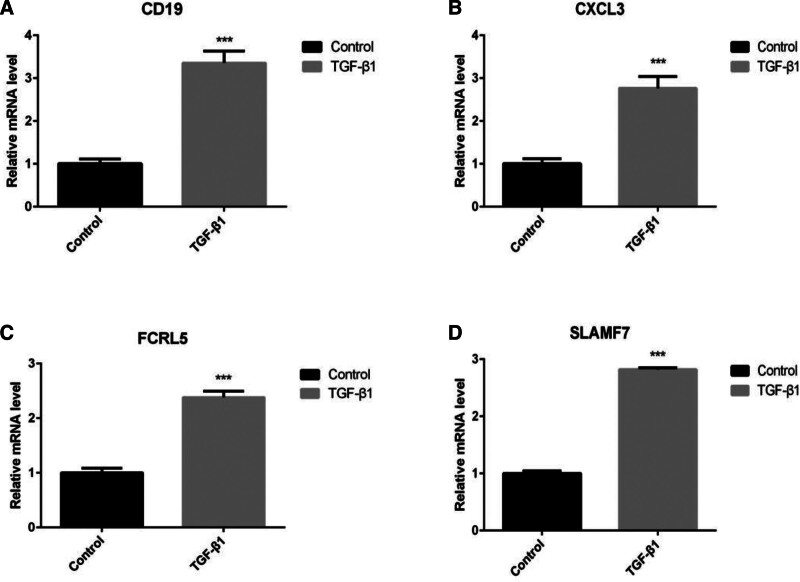
This study employed bioinformatics to investigate potential molecular markers associated with idiopathic pulmonary fibrosis (IPF) and examined their correlation with immune-infiltrating cells. Microarray data for IPF were retrieved from the Gene Expression Omnibus database. Differentially expressed genes (DEGs) and module genes were identified through Limma analysis and weighted gene co-expression network analysis. Enrichment analysis and protein-protein interaction network development were performed on the DEGs. Machine learning algorithms, including least absolute shrinkage and selection operator regression, random forest, and extreme gradient boosting, were applied to identify potential key genes. The predictive accuracy was assessed through a nomogram and a receiver operating characteristic (ROC) curve. Additionally, the correlation between core genes and immune-infiltrating cells was assessed utilizing the CIBERSORT algorithm. An IPF model was established in a human fetal lung fibroblast 1 (HFL-1) through induction with transforming growth factor β1 (TGF-β1), and validation was conducted via reverse transcription-quantitative polymerase chain reaction. A sum of 1246 genes exhibited upregulation, whereas 879 genes were downregulated. Pathway enrichment analysis and functional annotation revealed that DEGs were predominantly involved in extracellular processes. Four key genes - cd19, cxcl13, fcrl5, and slamf7 - were identified. Furthermore, ROC analysis demonstrated high predictive accuracy for these 4 genes. Compared to healthy individuals, lung tissues from IPF patients exhibited an increased presence of plasma cells, CD4 memory-activated T cells, M0 macrophages, activated dendritic cells, resting NK cells, and M2 macrophage infiltration. The upregulation of cd19, cxcl13, fcrl5, and slamf7 in TGF-β1-treated HFL-1 cells was confirmed, aligning with the findings from the microarray data analysis. cd19, cxcl13, fcrl5, and slamf7 serve as diagnostic markers for IPF, providing fresh perspectives regarding the fundamental pathogenesis and molecular mechanisms associated with this condition.

Keywords: CIBERSORT; biomarker; idiopathic pulmonary fibrosis; immune infiltration; machine learning algorithm.


Conflict of interest statement

The GEO database is a publicly accessible repository that offers a comprehensive collection of ethically approved patient data. Researchers are permitted to freely download and utilize this data for scientific investigations and publication purposes. As this study was conducted using open-access datasets, no ethical concerns or conflicts of interest are associated with its findings. The authors have no funding and conflicts of interest to disclose.

Figures

Figure 1.
Figure 1.
Differential gene expression analysis between IPF patients and healthy individuals following batch effect elimination. A. PCA visualization of both datasets subsequent to batch effect removal. B. Distribution analysis represented through box plots post-batch effect elimination. C. Differential gene expression is illustrated through a volcano plot, wherein upregulated genes are depicted in red, downregulated genes in green, and non-DEGs between IPF patients and healthy controls are shown in black. D. Hierarchical clustering heatmap demonstrates the expression patterns of identified DEGs across sixty individuals diagnosed with IPF and nineteen healthy controls. Expression intensity is represented by a color gradient, with red indicating elevated expression and blue denoting reduced expression. E. GO enrichment analysis of identified DEGs. F. Top 10 markedly enriched KEGG pathways. DEGs = differentially expressed genes, GO = gene ontology, IPF = idiopathic pulmonary fibrosis, KEGG = Kyoto Encyclopedia of Genes and Genomes, PCA = principal component analysis.
Figure 2.
Figure 2.
Immune cell infiltration in IPF and controls. A. PCA clustering visualization demonstrating immune cell infiltration distribution between IPF and control specimens. B. Correlation matrix heat map depicting the interrelationships among 22 distinct immune cell populations. C. Quantitative distribution of 22 immune cell infiltration subtypes, with the X-axis representing relative percentages across 19 control and 60 IPF samples, while the Y-axis indicates the proportional composition of immune cell subtypes per specimen (color-coded classification of immune cell categories displayed on the right). D. Statistical visualization via violin plots illustrating differential immune cell infiltration patterns between IPF and healthy control groups across 22 immune cell populations. *P < .05; **P < .01; ***P < .001. IPF = idiopathic pulmonary fibrosis, PCA = principal component analysis.
Figure 3.
Figure 3.
WGCNA for identification of module genes exhibiting correlation with immune infiltration. (A) and (B) Evaluation of diverse soft thresholds for network topology optimization (A). The x-axis represents the power value, while the y-axis of the left and right graphs depict network correlation coefficients and average network connectivity, respectively; in the right graph, a progressive reduction in average gene connectivity is observed with increasing power values. B. Distribution histogram illustrating connectivity metrics relative to power values with scale-free topological assessment. C. Hierarchical dendrogram visualizing color-coded co-expression gene modules. D. Correlation matrix depicting associations between distinct gene modules and immune cell populations. E. Functional enrichment analysis performed on genes within the pink module. WGCNA = weighted gene co-expression networks.
Figure 4.
Figure 4.
Disease typing of IPF identified by consistent cluster analysis. A. Genes positioned at the intersection of immune cell-associated genes and DEGs. B. PPI network rendered via Cytoscape software. C. Consensus matrix visualization for IPF molecular subtypes. D. cumulative distribution function curve of IPF consensus clustering. E. Relative alterations in the underlying cumulative distribution function curve for IPF subtyping. F. Item-consensus plot with k = 2, demonstrating optimal stratification parameters. G. Heatmap visualization of gene expression patterns across identified IPF subtypes following consensus clustering. H. Volcano plot illustrating differential gene expression profiles between distinct IPF patient subtypes. Genes exhibiting upregulation are depicted in red, those demonstrating downregulation are represented in green, and genes lacking significant differential expression between IPF phenotypes are shown in black. I. Intersection of patient-derived hub genes and DEGs across IPF subtypes. DEGs = differentially expressed genes, IPF = idiopathic pulmonary fibrosis, PPI = protein-protein interaction.
Figure 5.
Figure 5.
Screening candidate diagnostic biomarkers for IPF using machine learning. (A) and (B) Implementation of LASSO logistic regression algorithm for diagnostic marker screening and selection. C. Graphical representation displaying the 10 most significant genes as determined by the Mean Decrease Gini criterion within the RF algorithm framework. (D) and (E) Systematic biomarker identification process utilizing XGBoost regression modeling techniques. F. Intersectional Venn diagram illustrating diagnostic markers (cd19, cxcl13, fcrl5, slamf7) commonly identified across 3 distinct machine learning algorithmic approaches. LASSO = least absolute shrinkage and selection operator, RF = random forest.
Figure 6.
Figure 6.
Validation of the diagnostic value of cd19, cxcl13, fcrl5, and slamf7 as hub genes. A. ROC curve for diagnostic effectiveness validation. B. Violin plot showing the expression levels of cd19, cxcl13, fcrl5, and slamf7 between IPF group and control group, IPF group phenotypes and controls. C. Nomogram predicting the probability of IPF. D. Relevance of 4 key genes to immune cells. IPF = idiopathic pulmonary fibrosis, ROC = receiver operating characteristic.
Figure 7.
Figure 7.
Verification of differential gene expression in the TGF-β1-induced pulmonary fibrosis HFL-1 cell model. (A–D) Relative mRNA expression levels of cd19, cxcl13, fcrl5, and slamf7 were quantified via RT-qPCR analysis. (n = 3 per group). *P < .05; **P < .01; ***P < .001. HFL-1 = Human Fetal Lung Fibroblast 1, RT-qPCR = Reverse Transcription Quantitative Polymerase Chain Reaction, TGF-β1 = transforming growth factor β1.

Similar articles

References

    1. Li X, Liu X, Deng R, et al. . Nintedanib inhibits Wnt3a-induced myofibroblast activation by suppressing the Src/β-catenin pathway. Front Pharmacol. 2020;11:310. - PMC - PubMed
    1. Enomoto N, Naoi H, Aono Y, et al. . Acute exacerbation of unclassifiable idiopathic interstitial pneumonia: comparison with idiopathic pulmonary fibrosis. Ther Adv Respir Dis. 2020;14:1753466620935774. - PMC - PubMed
    1. Martinez FJ, Collard HR, Pardo A, et al. . Idiopathic pulmonary fibrosis. Nat Rev Dis Primers. 2017;3:17074. - PubMed
    1. Yang M, Yin E, Xu Y, et al. . CDKN2B antisense RNA 1 expression alleviates idiopathic pulmonary fibrosis by functioning as a competing endogenouse RNA through the miR-199a-5p/Sestrin-2 axis. Bioengineered. 2022;13:7746–59. - PMC - PubMed
    1. Decato BE, Leeming DJ, Sand J, et al. . LPA(1) antagonist BMS-986020 changes collagen dynamics and exerts antifibrotic effects in vitro and in patients with idiopathic pulmonary fibrosis. Respir Res. 2022;23:61. - PMC - PubMed

MeSH terms

Substances