. 2025 Apr;35(3):e70036.
doi: 10.1002/eap.70036.

Evaluating ecosystem caps on fishery yield in the context of climate stress and predation

Affiliations

Evaluating ecosystem caps on fishery yield in the context of climate stress and predation

Alberto Rovellini et al. Ecol Appl. 2025 Apr.

Abstract

Ecosystem-based fisheries management strives to account for species interactions and ecosystem processes in natural resource management and conservation. In this context, ecosystem-wide caps on total fishery catches have been proposed as one tool to manage multispecies fisheries with an ecosystem approach. However, determining effective ecosystem caps is complicated because fish stock production is influenced by environmental conditions, species interactions, and fishing. Consequently, the implementation of ecosystem caps in fisheries management frameworks remains uncommon. We investigated whether ecosystem caps should account for climate variability and for predator-prey dynamics to achieve management objectives in complex marine ecosystems. We considered the example of the Gulf of Alaska (United States), a North Pacific large marine ecosystem where annual groundfish catches are managed using an "optimum yield" ecosystem cap of 800,000 t. We simulated multispecies yield of the 12 most abundant and commercially valuable groundfish stocks under selected climate and fishing scenarios using an end-to-end marine ecosystem model (Atlantis), which accounts for predator-prey and ecosystem dynamics. We found that total groundfish yield was never projected to exceed the 800,000 mt optimum yield cap across scenarios and fishing mortalities. Projected climate change led to decreased groundfish yield, and predation from the underexploited groundfish predator arrowtooth flounder (Atheresthes stomias) led to foregone catches. Groundfish removals had negative indirect effects on groundfish predators, despite total yield never exceeding the optimum yield cap, highlighting that an ineffective cap may not protect non-target species. These results suggest that the optimum yield cap currently used in the Gulf of Alaska may be too high to constrain groundfish catches under future climate change and low exploitation rates of predators. We propose that ecosystem caps should be reviewed when environmental conditions, stock productivity, or species interactions change.

Keywords: Atlantis; climate‐integrated modeling; ecosystem modeling; ecosystem‐based management; optimum yield; predator–prey dynamics.


Conflict of interest statement

The authors declare no conflicts of interest.

Figures

FIGURE 1
FIGURE 1
Historical values of the aggregate catch allocation metrics and total catch (sum of landed and discarded) of species included in the Gulf of Alaska (GOA) groundfish Fishery Management Plan. ABC, acceptable biological catch; OFL, overfishing limit; TAC, total allowable catch. OFL is a proxy of maximum sustainable yield (MSY) in Alaska according to current definitions. The horizontal dashed red line is the 800,000 mt optimum yield GOA cap.
FIGURE 2
FIGURE 2
Schematic representation of the fishing experiments performed on the 12 focal groups. Steps 1 and 2 are represented in panels (a) and (b), respectively. F OFL is the fishing mortality at the overfishing limit from single‐species stock assessments for the GOA, and a value of 4 F OFL was used as the maximum fishing mortality (F) explored in Step 1 for each focal group. F MSY is the fishing mortality at maximum sustainable yield obtained in Atlantis from profiling F, one focal group at a time. MF MSY is the vector of the 12 F MSY values, one per focal group.
FIGURE 3
FIGURE 3
Equilibrium spawning biomass (left) and catch (right) in 1000s of tons for selected focal groups as a function of fishing mortality F, as determined in Step 1 of the Atlantis fishing experiment (F manipulated on one focal group at a time). Vertical dashed lines: in orange, F at the overfishing limit (F OFL) from single‐species assessments (natural mortality M for Pacific halibut), and in blue, F at maximum sustainable yield (F MSY) as determined by Atlantis. Horizontal dashed lines indicate stock biomass at F MSY, with the corresponding depletion (i.e., the fraction of unfished biomass).
FIGURE 4
FIGURE 4
Equilibrium multispecies yield (1000s of tons) of groundfish focal groups for increasing multipliers of the multispecies fishing mortality at maximum sustainable yield (MF MSY). Panels indicate the four scenarios combining climate regime (rows) and arrowtooth flounder exploitation level (columns). Only catches from the Alaska portion of the model domain are shown, and Pacific halibut catches are not plotted, to allow comparison with the Gulf of Alaska optimum yield cap (horizontal red dashed line = 800,000 t). The vertical dashed line indicates MF MSY.
FIGURE 5
FIGURE 5
Number of groundfish focal groups (out of 12) whose spawning stock biomass (SSB) fell below B35% (the reference point for overfishing in the North Pacific) at equilibrium for increasing multipliers of the multispecies fishing mortality at maximum sustainable yield (MF MSY). Panels indicate the four scenarios related to climate regime (rows) and arrowtooth flounder fishing strategy. The vertical dotted line indicates MF MSY. Note that Pacific cod is below B35% regardless of fishing mortality and arrowtooth fishing strategy under warm climate conditions.
FIGURE 6
FIGURE 6
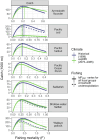
Equilibrium catch (1000s of tons) of selected focal groups for increasing fishing mortality F under different combinations of climate regimes and arrowtooth exploitation level. Blue lines: historical conditions (1999); green lines: warm conditions (2075–2085 climatology, ssp585). Solid lines: F on all stocks varies with the multipliers of the multispecies fishing mortality at maximum sustainable yield (MF MSY); dashed lines; F on arrowtooth fixed at ¼ F OFL, a proxy for F MSY in Alaska. Vertical lines indicate the F corresponding to the highest yield in each scenario.
FIGURE 7
FIGURE 7
(a) Forage fish biomass (1000s of tons) for increasing multipliers of the multispecies fishing mortality at maximum sustainable yield (MF MSY) for groundfish. Note the different scales on the y‐axis and that the y‐axis does not extend to 0. Colors indicate the change (in percentage) in total biomass of the predators of each forage fish species from the unfished scenario. Shapes indicate the arrowtooth exploitation level, and columns indicate the climate scenario. The vertical dashed line indicates MF MSY. (b) Same as (a) but for predator biomass (1000s of tons). Colors indicate the change (in percentage) in total biomass of the prey of each piscivorous predator functional group from the unfished scenario.

References

    1. Abelman, A. , Dalton M., Fissel B., Garber‐Yonts B., Kasperski S., Lee J., Lew D., et al. 2023. Stock Assessment and Fishery Evaluation Report for the Groundfish Fisheries of the Gulf of Alaska and Bering Sea/Aleutian Islands Area: Economic Status of the Groundfish Fisheries off Alaska, 2022. Aleutian Islands and Gulf of Alaska SAFE: NPFMC Bering Sea.
    1. Adams, G. D. , Holsman K. K., Barbeaux S. J., Dorn M. W., Ianelli J. N., Spies I., Stewart I. J., et al. 2022. “An Ensemble Approach to Understand Predation Mortality for Groundfish in the Gulf of Alaska.” Fisheries Research 251: 106303.
    1. Anderson, P. J. , and Piatt J. F.. 1999. “Community Reorganization in the Gulf of Alaska Following Ocean Climate Regime Shift.” Marine Ecology Progress Series 189: 117–123.
    1. Arimitsu, M. L. , Piatt J. F., Hatch S., Suryan R. M., Batten S., Anne M., Campbell R. W., et al. 2021. “Heatwave‐Induced Synchrony Within Forage Fish Portfolio Disrupts Energy Flow to Top Pelagic Predators.” Global Change Biology 27: 1859–1878. - PMC - PubMed
    1. Audzijonyte, A. , Pethybridge H., Porobic J., Gorton R., Kaplan I., and Fulton E.. 2019. “Atlantis: A Spatially Explicit End‐to‐End Marine Ecosystem Model with Dynamically Integrated Physics, Ecology and Socio‐Economics Modules.” Methods in Ecology and Evolution 10: 1814–1819.

LinkOut - more resources