. 2025 May 12;16(1):374.
doi: 10.1038/s41419-025-07708-8.

Pharmacological inhibition of PLK1/PRC1 triggers mitotic catastrophe and sensitizes lung cancers to chemotherapy

Affiliations

Pharmacological inhibition of PLK1/PRC1 triggers mitotic catastrophe and sensitizes lung cancers to chemotherapy

Pingping Li et al. Cell Death Dis. .

Abstract

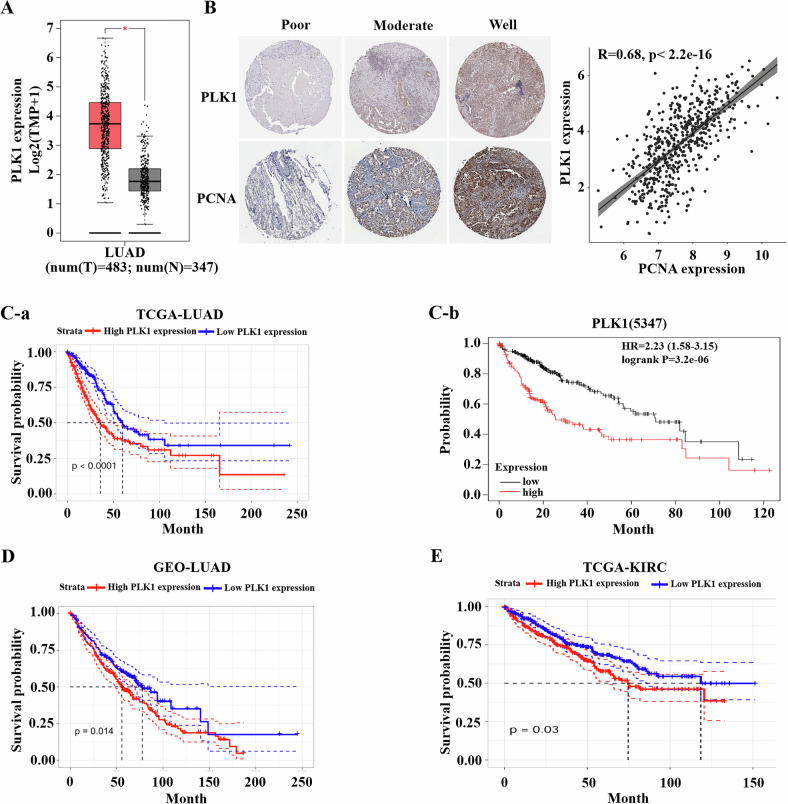
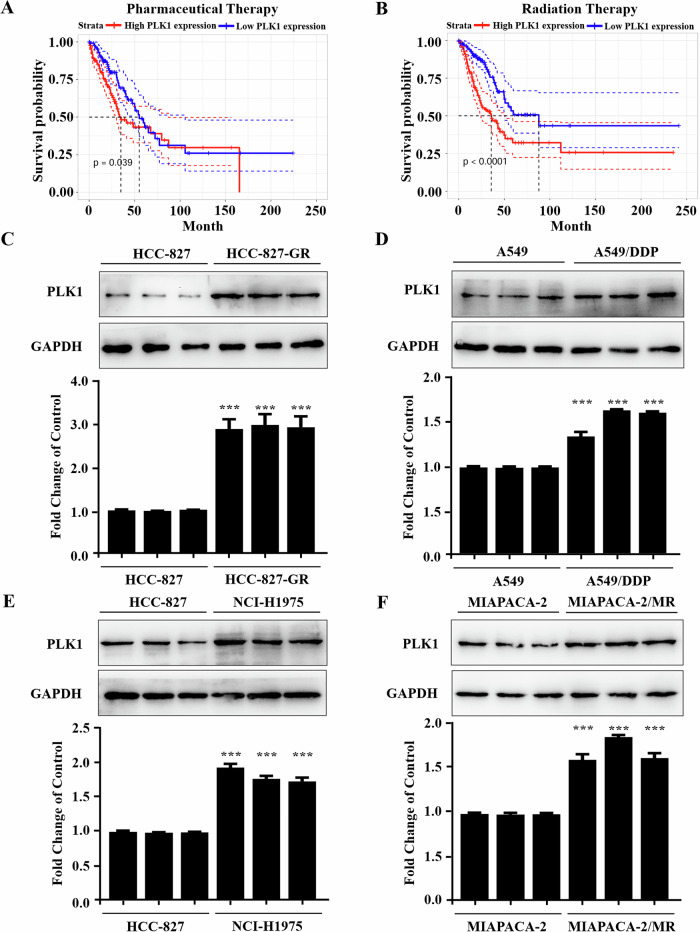
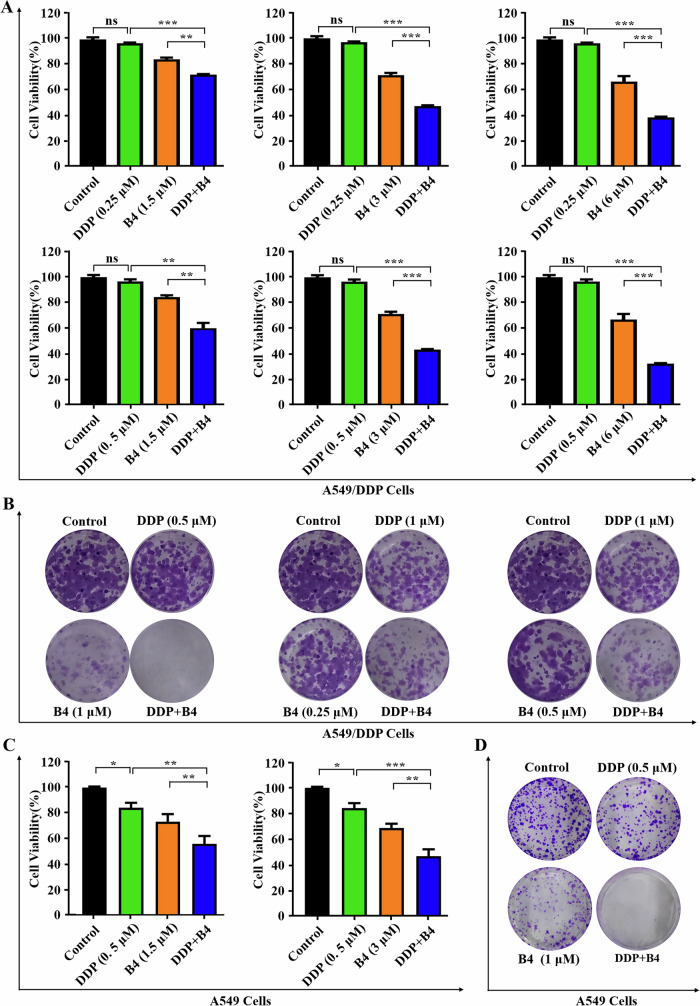
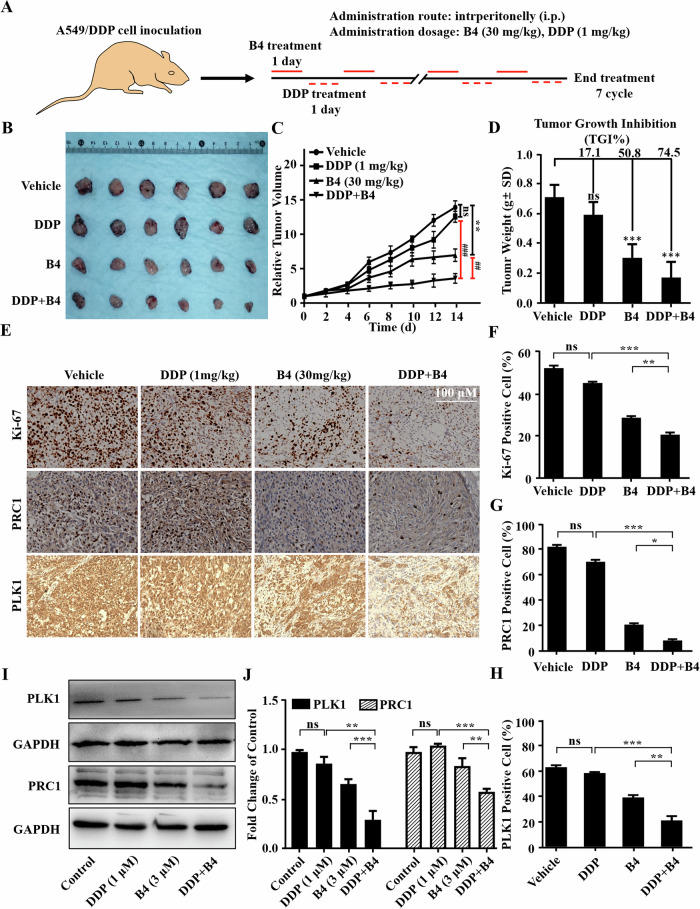
Polo-like kinase 1 (PLK1) signaling drives tumor malignancy and chemotherapy resistance, which is an unmet clinical need. Recruiting PLK1 to the central spindle during anaphase is necessary for its function in promoting cancer cell proliferation, which is achieved by binding to microtubule-associated protein regulating of cytokinesis (PRC1) located in the spindle. However, the role of PLK1/PRC1 signaling in chemotherapy resistance is unknown. In this study, we identified a small molecule B4 which inhibited PLK1/PRC1 signaling through disrupting the formation of PLK1/PRC1 protein complexes. In the presence of blocking PLK1/PRC1 signaling, enhanced sensitivity of drug-resistant tumors to traditional chemotherapy was found. Suppression of PLK1 activity by B4 inhibited disease progression in allograft models, and combination with cisplatin elicited dramatic regression of drug-resistant tumors. Our findings provide a promising strategy to target the PLK1 signaling cascade and demonstrate a potential modality to enhance sensitivity to chemotherapy in non-small cell lung cancer (NSCLC).


Conflict of interest statement

Competing interests: The authors declare no competing interests.

Figures

Fig. 1
Fig. 1. High expression of PLK1 in NSCLC correlates with poor prognosis.
A mRNA levels of PLK1 in NSCLC tissues and normal tissues, *P < 0.05. B Immunohistochemical analysis to detect the protein expression of PLK1 and proliferating cell nuclear antigen (PCNA) in tumor tissues of NSCLC patients with different degrees of differentiation (left), and the correlation study between PLK1 and PCNA expression in tumor tissues of NSCLC patients (right). C-a Correlation analysis between PLK1 and overall survival (OS) of NSCLC patients in TCGA database. C-b Correlation analysis between PLK1 and OS in patients with advanced NSCLC in the Kaplan-Meier mapper database. D Correlation analysis between PLK1 and OS in NSCLC patients in the GEO database. E Correlation analysis between PLK1 and OS in KIRC patients in the TCGA database.
Fig. 2
Fig. 2. PLK1 overexpression is associated with chemotherapy resistance.
A Correlation analysis between PLK1 expression status and overall survival rate in NSCLC patients receiving drug therapy. B Correlation analysis between PLK1 expression status and overall survival rate in NSCLC patients receiving radiation therapy. CF Protein immunoblotting assay to detect PLK1 expression levels in drug-sensitive and drug-resistant cell lines, respectively: C HCC-827 and HCC-827/GR, D A549 and A549/DDP, E HCC-827 and NCI-H1975, F MIAPACA-2 and MIAPACA-2/MR. Each has the expression of GAPDH as the internal control. Protein expression was quantified by densitometry analysis using ImageJ and normalized against GAPDH expression. Data are presented as the mean ± SD. ***p < 0.001.
Fig. 3
Fig. 3. Assess of B4 as a PLK1 inhibitor.
(A) Structure-based virtual screening workflow for PLK1-substrate interaction inhibitors. (B) Ribbon structure display of B4 binding to active sites of PLK1 PBD (PDB code: 3FVH). B4 is shown in green and protein residues involved in B4 binding are highlighted in blue. (C) Interaction of compounds with PLK1 protein detected by surface plasmon resonance. B4 binding to PLK1 protein, respectively. (D) Plots of the equilibrium response unit responses versus concentrations of B4. Results are the mean of two independent experiments. (E) Protein abundance of PLK1 and p-PLK1 after B4 treatment. Lysates from A549/DDP cells after 48 h of B4 treatment were detected by western blotting and quantified using ImageJ. Data is expressed as mean ± SD, (n = 3) **p < 0.01 and ***p < 0.001. (F) Protein abundance of PLK1 and p-PLK1 after B4 treatment. Lysates from A549 cells after 48 h of B4 treatment were detected by western blotting and quantified using ImageJ. Data is expressed as mean ± SD, (n = 3) **p < 0.01 and ***p < 0.001. G IC50 values of B4 against A549 and A549/DDP cell lines. Data is expressed as mean ± SD, (n = 3). H, I Effect of B4 on cell cycle in A549 cells and A549/DDP cells. After treated with B4 for 48 h, PI staining was used to examine the cell cycle of A549 cells (H) and A549/DDP cells (I). Data is expressed as mean ± SD, (n = 3). J Morphological changes in the nucleus of A549/DDP and A549 cells after B4 treatment at 48 h. Arrows indicate multinucleated cells. Images shown are representatives of three independent experiments. K Regulation of B4 on cell cycle progression. PI staining was used to investigate the effects of B4 on the cell cycle of A549/DDP cells. Data is processed through ModFit LT.
Fig. 4
Fig. 4. B4 binds to PLK1 PBD.
A NMR measurements of direct binding between B4 and PLK1. T1ρ NMR spectra for B4 (green), B4 in the presence of PLK1 at 5 μM (red) and 10 μM (blue). B Representative western blots for the stabilization of the PLK1 protein. CETSA was detected in A549/DDP cell lysates and intact cells in the presence of 20 μM and 5 μM B4, respectively. Each has the expression of GAPDH as the internal control. C 2D structural model of Flag-KD and Flag-PBD plasmids construct. D Images of Flag-KD and Flag-PBD plasmids transfected A549/DDP cells for 24 h were captured by Cytation 5. Images shown are representatives of three independent experiments. E Co-IP-MS experimental procedure. F Interaction between B4 and PLK1-PBD was analyzed by HR-MS. (a) B4 was dissolved in DMSO and detected by HR-MS (m/z: 456.1394 [M + H]+), black line. (b) B4 interacted with PLK1 PBD. Whole proteins extracted from A549/DDP cells transfected with Flag-PBD plasmids were treated with B4 (10 μМ) for 1 h, followed by immunoprecipitation with anti-Flag antibody, and finally eluted samples were examined by HR-MS after 1 min of ultrasonic treatment (m/z: 456.1370 [M + H]+, blue line). (c) B4 was not combined with PLK1 KD. Whole proteins extracted from A549/DDP cells transfected with Flag-KD plasmids were treated with B4 (10 μМ) for 1 h, followed by immunoprecipitation with anti-Flag antibody, and finally eluted samples were examined by HR-MS after 1 min of ultrasonic treatment (orange line). (d) The mass result of the negative control. Whole proteins extracted from A549/DDP cells were treated with B4 (10 μМ) for 1 h, followed by immunoprecipitation with anti-Flag antibody, and finally eluted samples were examined by HR-MS after 1 min of ultrasonic treatment (green line).
Fig. 5
Fig. 5. B4 combined with cisplatin improves chemoresistance in lung cancer in vitro.
A Cell viability of A549/DDP cell lines treated with B4 and cisplatin. Cell viability was determined on 48 h after treatment and proliferation index was calculated as fold change of cell viability. Columns, means (n = 3); bars, standard deviation (*p < 0.05, **p < 0.01, ***p < 0.001). B Colony formation assay in cells treated B4, cisplatin, or combination at 12 days. Images shown are representatives of three independent experiments. C Cell viability of A549 cell lines treated with B4 and cisplatin. Cell viability was determined on 48 h after treatment and proliferation index was calculated as fold change of cell viability. Columns, means (n = 3); bars, standard deviation (*p < 0.05, **p < 0.01, ***p < 0.001). D Colony formation assay in cells treated B4, cisplatin, or combination at 12 days. Images shown are representatives of three independent experiments.
Fig. 6
Fig. 6. In vivo anticancer activity of B4 in an A549/DDP xenograft mice model.
A Treatment scheme of B4 in A549/DDP xenograft tumor model. B Images of excised tumor from different groups at time of euthanasia. C Relative tumor volume changes from different groups. Data are shown as the mean ± SD, n = 6, **p < 0.01, ##p < 0.01 and ###p < 0.001. D The average weight of excised tumors from different groups at time of euthanasia. Data are shown as the mean ± SD, n = 6, *p < 0.05, **p < 0.01 and ***p < 0.001. EH B4 inhibited Ki-67, PRC1 and PLK1 expression in tumor tissues. Tumors were excised at the end of treatment and then analyzed by immunohistochemistry (E). Three random fields of each sample were counted for the quantification of Ki-67 (F), PRC1 (G) and PLK1 (H) positive cells. Statistical analysis was carried out by GrapPad Prism with one-way ANOVA. I, J Expression of PLK1 and PRC1 in A549/DDP cells after B4 treatment. Whole cell proteins were detected by western blotting (I) using indicated antibodies and quantified with imageJ (J). Data are presented as the mean ± SD. *p < 0.05, **p < 0.01 and ***p < 0.001.
Fig. 7
Fig. 7. B4 has a safety profile in vivo.
(A) Changes in body weights of the mice recorded over treatment period. Data are shown as the mean ± SD, (n = 6). (B) Weights of lung, hearts, livers, and kidneys from A549/DDP xenograft mice at the end of treament. Data are shown as the mean ± SD, n = 6, *p < 0.05. (C) H&E staining tissue images of the major organs obtain from each group mice in A549/DDP xenograft mice. Images shown are representatives of three independent experiments.
Fig. 8
Fig. 8. Mechanism study of B4 induced mitotic catastrophe.
A Co-immunoprecipitation was conducted to examine the interaction between PLK1 and PRC1 in A549/DDP cells after B4 treatment. B Immunostaining was performed to show the localization of PLK1 and PRC1 in A549/DDP cells after B4 treatment at 48 h. Arrows indicate multinucleated cells. Images shown are representatives of three independent experiments. Expression of some cell cycle-related proteins after B4 treatment in A549/DDP cells. Whole cell proteins were detected by western blotting (C) using indicated antibodies and quantified with imageJ (D). Each has the expression of GAPDH as the internal control. E, F Expression of some cell cycle-related proteins after B4 treatment in A549 cells. Whole cell proteins were detected by western blotting (E) using indicated antibodies and quantified with imageJ (F). Data are presented as the mean ± SD. *p < 0.05, **p < 0.01 and ***p < 0.001.

References

    1. Vasan N, Baselga J, Hyman DM. A view on drug resistance in cancer. Nature. 2019;575:299–309. - PMC - PubMed
    1. Marine JC, Dawson SJ, Dawson MA. Non-genetic mechanisms of therapeutic resistance in cancer. Nat Rev Cancer. 2020;20:743–56. - PubMed
    1. Boumahdi S, de Sauvage FG. The great escape: tumour cell plasticity in resistance to targeted therapy. Nat Rev Drug Discov. 2020;19:39–56. - PubMed
    1. Ward RA, Fawell S, Floc’h N, Flemington V, McKerrecher D, Smith PD. Challenges and opportunities in cancer drug resistance. Chem Rev. 2021;121:3297–351. - PubMed
    1. Robey RW, Pluchino KM, Hall MD, Fojo AT, Bates SE, Gottesman MM. Revisiting the role of ABC transporters in multidrug-resistant cancer. Nat Rev Cancer. 2018;18:452–64. - PMC - PubMed

MeSH terms