. 2025 May 12;16(1):4400.
doi: 10.1038/s41467-025-59005-9.

Transcriptome analysis of archived tumors by Visium, GeoMx DSP, and Chromium reveals patient heterogeneity

Affiliations

Transcriptome analysis of archived tumors by Visium, GeoMx DSP, and Chromium reveals patient heterogeneity

Yixing Dong et al. Nat Commun. .

Abstract

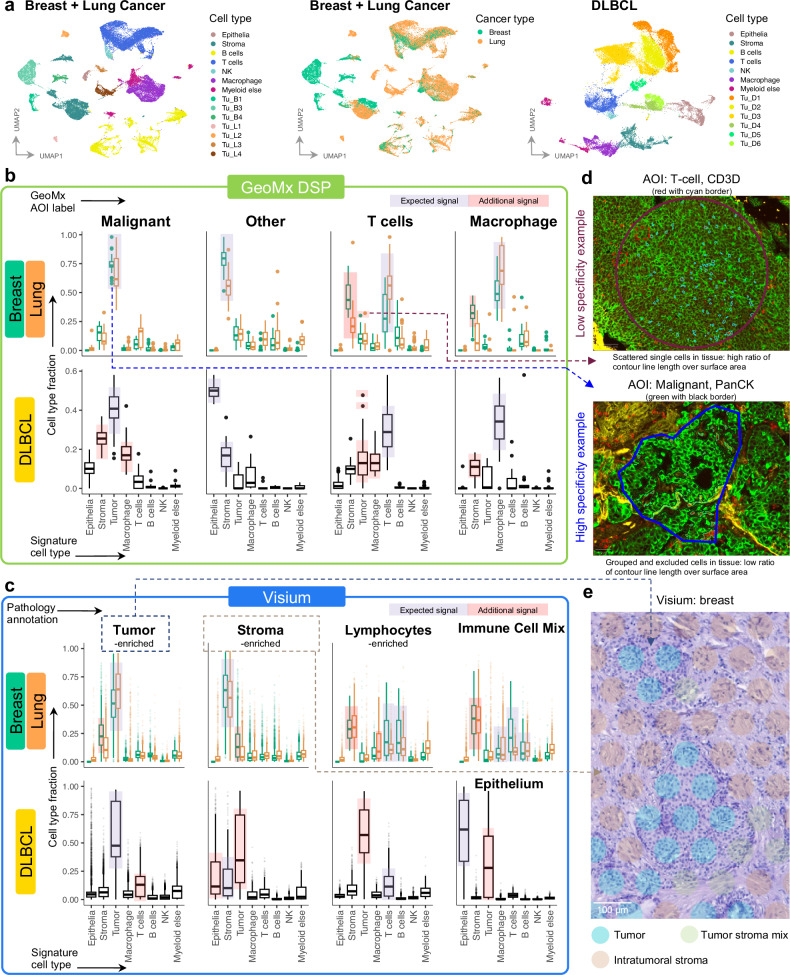
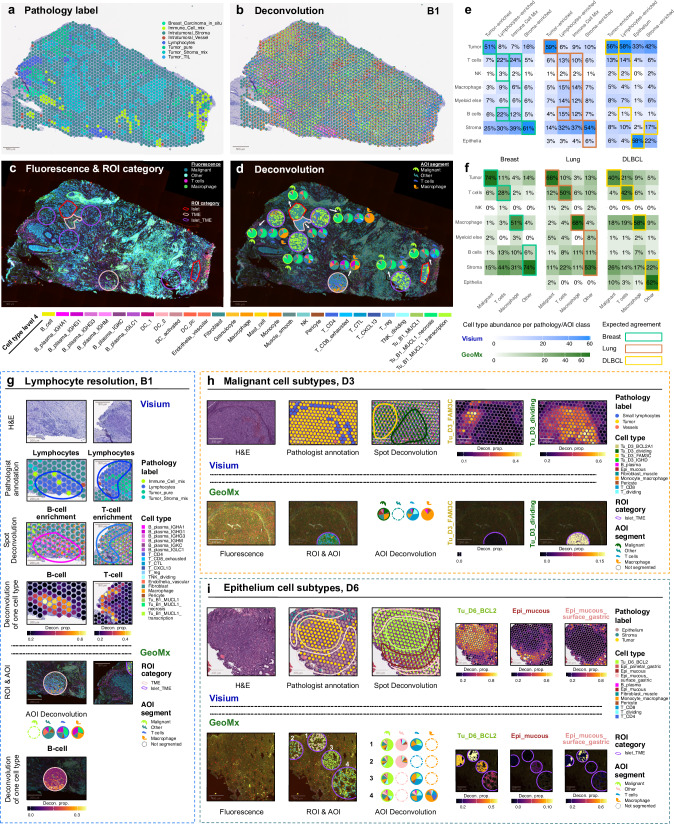
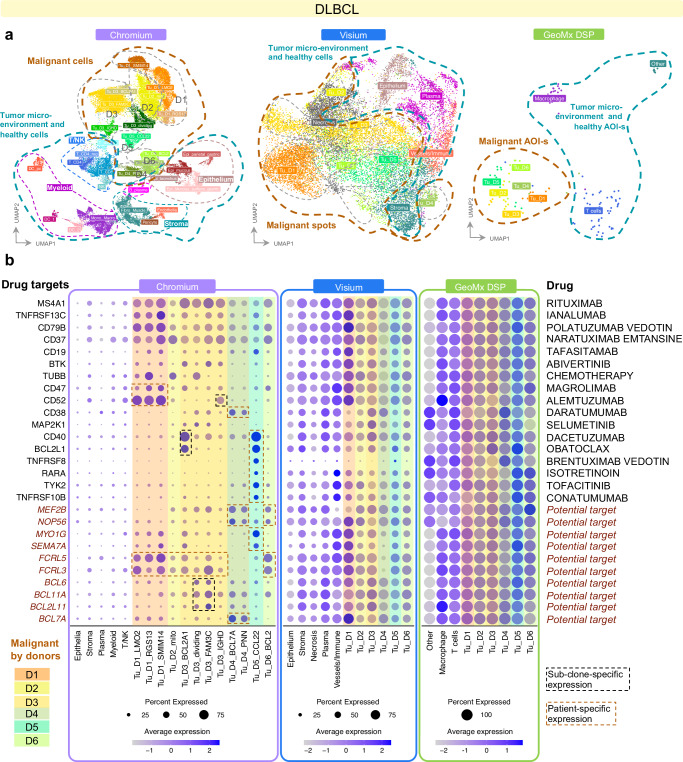
Recent advancements in probe-based, full-transcriptome technologies for FFPE tissues, such as Visium CytAssist, Chromium Flex, and GeoMx DSP, enable analysis of archival samples, facilitating the generation of data from extensive cohorts. However, these methods can be labor-intensive and costly, requiring informed selection based on research objectives. We compare these methods on FFPE tumor samples in Breast, NSCLC and DLBCL showing 1) good-quality, highly reproducible data from all methods; 2) GeoMx data containing cell mixtures despite marker-based preselection; 3) Visium and Chromium outperform GeoMx in discovering tumor heterogeneity and potential drug targets. We recommend the use of Visium and Chromium for high-throughput and discovery projects, while the manually more challenging GeoMx platform with targeted regions remains valuable for specialized questions.


Conflict of interest statement

Competing interests: E.M., A.E.P., Q.B., S.C., E.Y.D., R.San., K.v.L., R.D., C.Ha., S.L.L., A. K., V.S. are Owkin employees and shareholders. C. Ho. is an Owkin employee and a consultant for Nanobiotix. R.G. has received consulting income from Takeda, Arcellx, GSK, and Sanofi; declares ownership in Ozette Technologies; and has received research funding from 10X Genomics through his employer, the CHUV. G.C. has received honoraria from Bristol-Myers Squibb. The Lausanne University Hospital (CHUV) has received honoraria for advisory services G.C. has provided to Iovance and EVIR. G.C. has received royalties from the University of Pennsylvania for CAR T cell therapy licensed to Novartis and Tmunity Therapeutics, and from the Ludwig Institute for Cancer Research, the University of Lausanne and the CHUV, for NeoTIL intellectual property previously licensed to Tigen Pharma. S.P. has received educational grants, provided consultation, attended advisory boards, and/or delivered lectures for the following organizations, from which S.P. has received honoraria (all fees directed to their institution): AbbVie, Amgen, Arcus, AstraZeneca, Bayer, Beigene, BioNTech, BerGenBio, Bicycle Therapeutics, Biocartis, BioInvent, Blueprint Medicines, Boehringer Ingelheim, Bristol-Myers Squibb, Clovis, Daiichi Sankyo, Debiopharm, Eli Lilly, F-Star, Foundation Medicine, Genmab, Genzyme, Gilead, GSK, Hutchmed, Illumina, Incyte, Ipsen, iTeos, Janssen, Qlucore, Merck Sharp and Dohme, Merck Serono, Merrimack, Mirati, Nuvation Bio, Nykode Therapeutics, Novartis, Novocure, Pharma Mar, Promontory Therapeutics, Pfizer, Regeneron, Roche/Genentech, Sanofi, Seattle Genetics, Takeda, and Zymeworks. S.P. has spoken at company-organized public events for AstraZeneca, Boehringer Ingelheim, Bristol-Myers Squibb, Eli Lilly, Foundation Medicine, GSK, Illumina, Ipsen, Merck Sharp and Dohme, Mirati, Novartis, Pfizer, Roche/Genentech, Sanofi, Seattle Genetics, and Takeda. Additionally, S.P. has served as a principal investigator for trials sponsored by Amgen, Arcus, AstraZeneca, Beigene, Bristol-Myers Squibb, Eli Lilly, GSK, iTeos, Merck Sharp and Dohme, Mirati, Pharma Mar, Promontory Therapeutics, Roche/Genentech, and Seattle Genetics, with institutional financial support for these clinical trials.

Figures

Fig. 1
Fig. 1. Experimental setup and data quality with three full transcriptome methods GeoMx, Visium and Chromium on Breast and Lung cancer, and DLBCL biobank samples.
a Schematics of experimental design to generate GeoMx and Visium spatial transcriptomics and Chromium single-nuclei data for three cancer types corresponding to 14 donors from FFPE blocks with 2 samples replicated for each technology. AOI - area of illumination, DLBCL - Diffuse large B-cell lymphoma, DSP - digital spatial profiler. Created in BioRender. Gottardo, R. (2025) https://BioRender.com/o13c311. b Display of block age and RNA quality measure DV200 values for all the samples with histology type, labelled by patient ID. c Gene detection rate for GeoMx AOI-s and number of genes detected in Visium spots and single nuclei. Colors in GeoMx correspond to AOI labels. d Breast cancer tSNE plots with GeoMx and UMAP plots with Visium and Chromium show good reproducibility. Technical replicates with adjacent sections from the same block are highlighted with a dashed line. GeoMx: 5 samples/117 AOIs; Visium: 5 samples/10249 spots; Chromium: 6 samples/10689 cells. B breast, L lung, D DLBCL. Source data are provided as a Source Data file.
Fig. 2
Fig. 2. Assessment of cell type specificity in GeoMx AOI-s and Visium spots.
a UMAP plots for annotated Chromium data at Level 1.5 resolution. Breast & Lung: 10 samples/46,643 cells; DLBCL: 6 samples/39,713 cells. Predicted cell type fractions by deconvolution in GeoMx (b) and Visium (c), grouped by AOI label in GeoMx and Pathologist annotation groups in Visium. Fractions are displayed for groups of shown cell types. Boxes represent the quartiles of the data, while the whiskers extend to data points within 1.5x the interquartile range from the lower and upper quartiles. The horizontal black line within each box represents the median. Outliers are indicated as individual data points. GeoMx: Breast (Malignant: n = 225 AOIs; Other: n = 281 AOIs; T cells: n = 148 AOIs; Macrophage: n = 134 AOIs), Lung (Malignant: n = 248 AOIs; Other: n = 296 AOIs; T cells: n = 296 AOIs; Macrophage: n = 104 AOIs), DLBCL (Malignant: n = 448 AOIs; Other: n = 72 AOIs; T cells: n = 416 AOIs; Macrophage: n = 152 AOIs). Visium: Breast (Tumor-enriched: n = 15,352 spots; Stroma-enriched: n = 36,086 spots; Lymphocytes-enriched: n = 638 spots; Immune Cell Mix: n = 1625 spots), Lung (Tumor-enriched: n = 15,352 spots; Stroma-enriched: n = 13,224 spots; Lymphocytes-enriched: n = 7160 spots; Immune Cell Mix: n = 14,088 spots), DLBCL (Tumor-enriched: n = 120,824 spots; Stroma-enriched: n = 5288 spots; Lymphocytes-enriched: n = 5840 spots; Epithelium: n = 7592 spots). Expected and unexpected additional signals for that AOI label or pathology group are highlighted. Pathology annotations were grouped as in Supplementary Data 5. d Examples of AOI-s with low and high specificity on immunofluorescent images. Thicker line is contour for the full region of interest, thinner line is contours for AOI. Images above are representative of 1 sample. e Examples of Visium spot annotation into Tumor and adjacent areas. Image above is representative of 1 sample. Source data are provided as a Source Data file.
Fig. 3
Fig. 3. Cell-type deconvolution specificity comparison on spatially registered Visium spots to GeoMx AOI labels.
a Image registration between GeoMx fluorescent image and Visium spot coordinates. Image above is representative of 1 sample. b Density plot of overlapping area between Visium spots and each GeoMx AOI. A threshold of > 70% was applied to select spots registered to a GeoMx AOI label. Number of mapped spots: n total (n passed 70% threshold)—Malignant: n = 1422 (116 AOIs); Other: n = 1676 (342 AOIs); T cells: n = 701 (5 AOIs); Macrophage: n = 395 (0 AOIs). (c) For registered GeoMx segments and Visium spots in (b), using matched Level 1.5 Chromium reference from Fig. 2a to deconvolute cell type fraction. Boxes represent the quartiles of the data, while the whiskers extend to data points within 1.5x the interquartile range from the lower and upper quartiles. The horizontal black line within each box represents the median. Outliers are indicated as individual data points. Malignant: GeoMx (n = 28 AOIs), Visium (n = 116 spots); Other: GeoMx (n = 29 AOIs), Visium (n = 342 spots); T cells: GeoMx (n = 3 AOIs), Visium (n = 5 spots). Source data are provided as a Source Data file.
Fig. 4
Fig. 4. Multi-modality of Visium and GeoMx data visualized with H&E and fluorescence image, pathology label, and deconvolution.
a Pathology label visualized on H&E image of Visium sample B1_4. b Deconvolution cell type fractions plotted as scattered pie charts for each spot visualized on H&E image of Visium sample B1_4. c Pathological regions of interest (ROI-s) visualized on fluorescence images of GeoMx sample B1_3. d Up to four AOI segments have their outlines complement each other in an ROI. Deconvolution cell type fractions plotted as pie charts for each area of illumination (AOI) segment within each ROI. Sample B1 - Visium: 1988 spots; GeoMx: 24 AOIs. Pathology label and deconvolution agreement for breast, lung and DLBCL in Visium (e) and GeoMx (f) samples. Heatmap is labelled by the average cell type deconvolution fraction per pathology label or AOI label, colored by square root of the number. g Lymphocyte resolution zoomed in on H&E image, pathology annotation, deconvolution shown as scatterpie of cell type fractions, and individual deconvolution fraction for cell type of interest in Visium sample B1_4. At the same spatial location, ROI and AOI outlines (if any) were shown on the consecutive section of GeoMx sample B1_3. The individual deconvolution fraction of B-cells  is shown spatially in the TME ROI. The T-cell region identified in Visium did not have an ROI sampled exactly head-to-head in GeoMx. h Malignant cell subtypes visualized across various modalities for consecutive sections of Visium and GeoMx sample D3. Deconvolution is able to depict the spatial transitioning in Visium of tumor cell types annotated in Chromium. The absence of Tu_D3_FAM3C and the existence of Tu_D3_dividing can be validated in GeoMx at the same spatial location. Sample D3 - Visium: 4951 spots; GeoMx: 23 AOIs. i Tumor and epithelium cell subtypes visualized across various modalities for consecutive sections of Visium and GeoMx sample D6. Sample D6 - Visium: 1649 spots; GeoMx: 19 AOIs. Images above are representative of 3 samples. Source data are provided as a Source Data file.
Fig. 5
Fig. 5. Integrating H&E image, pathology label, deconvolution, and clustering identifies TLS and tumor subtypes in Visium.
a For lung sample L1, TLS markers show boundary of TLS after BayesSpace resolution enhancement, which validates the TLS location by pathology label in Visium. In the consecutive section of L1 in GeoMx, at the same tissue location where the TLS was identified in Visium, we zoomed in to check the TLS markers expression level in the TME ROI compared to its neighboring Islet ROI. Black arrows point to the Other AOI, where the B-cell signal is expected to appear. Sample L1 - Visium: 944 spots; GeoMx: 25 AOIs. b For breast sample B3, two regions were similar in H&E, labeled as tumor by pathologist, and deconvolution majority voted as single tumor type from Chromium; two spatially distinct tumor subtypes appeared with spatially-aware clustering in Visium. c In the consecutive section of B3 in GeoMx, the ROI-s were mapped to the two regions identified by Visium. The Malignant AOI-s show distinct clusters in the reduced dimension. Deconvolution results for each AOI are displayed as pie charts. Sample B3 - Visium: 2156 spots; GeoMx: 23 AOIs. d Volcano plot of Differential Expression (DE) analysis between selected clusters from (b) (moderated t-test, two-sided). Genes for which there are existing drugs are highlighted (see further information in Supplementary Data 8). e Volcano plot of DE analysis between two Malignant AOI clusters in (c) (Wilcoxon’s Rank Sum test, two-sided). Genes that are mutually DE in both Visium and GeoMx are highlighted with black outline. f Upset plot showing number of distinct DE genes identified by Visium, GeoMx, and Chromium, and their combinations. Images above are representative of 2 samples. Source data are provided as a Source Data file.
Fig. 6
Fig. 6. Exploration of drug targets and patient subgroups in DLBCL.
a UMAP representations of Chromium, Visium and GeoMx DLBCL patients, colored by Level 4 cell types, clustering-based annotation of spots, or AOI types correspondingly. 6 samples, Chromium: 39,713 cells; Visium: 18,580 spots; GeoMx: 136 AOIs. b Expression of selected genes that are significantly differentially expressed in at least one donor subtype compared to TME cells in any of the three methods. Genes for which there are existing drugs (see further information in Supplementary Data 8) are listed per row. Genes with no drug are labeled as “Potential target”. Gene expression in any of the donors is color-coded. Patient-specific and subclone specific gene expression is highlighted with dashed lines. Source data are provided as a Source Data file.

References

    1. Method of the Year 2020: spatially resolved transcriptomics. Nat. Methods18, 1 (2021). - PubMed
    1. Du, M. R. M. et al. Benchmarking spatial transcriptomics technologies with the multi-sample SpatialBenchVisium dataset. Genome Biol.26, 77 (2025). - PMC - PubMed
    1. Janesick, A. et al. High resolution mapping of the tumor microenvironment using integrated single-cell, spatial and in situ analysis. Nat. Commun.14, 8353 (2023). - PMC - PubMed
    1. Zimmerman, S. M. et al. Spatially resolved whole transcriptome profiling in human and mouse tissue using digital spatial profiling. Genome Res32, 1892 (2022). - PMC - PubMed
    1. Wu, H., Kirita, Y., Donnelly, E. L. & Humphreys, B. D. Advantages of single-nucleus over single-cell RNA sequencing of adult kidney: rare cell types and novel cell states revealed in fibrosis. J. Am. Soc. Nephrol.30, 23 (2019). - PMC - PubMed