. 2025 May 12;16(1):4374.
doi: 10.1038/s41467-025-59576-7.

Twin pair analysis uncovers links between DNA methylation, mitochondrial DNA quantity and obesity

Affiliations

Twin pair analysis uncovers links between DNA methylation, mitochondrial DNA quantity and obesity

Aino Heikkinen et al. Nat Commun. .

Abstract

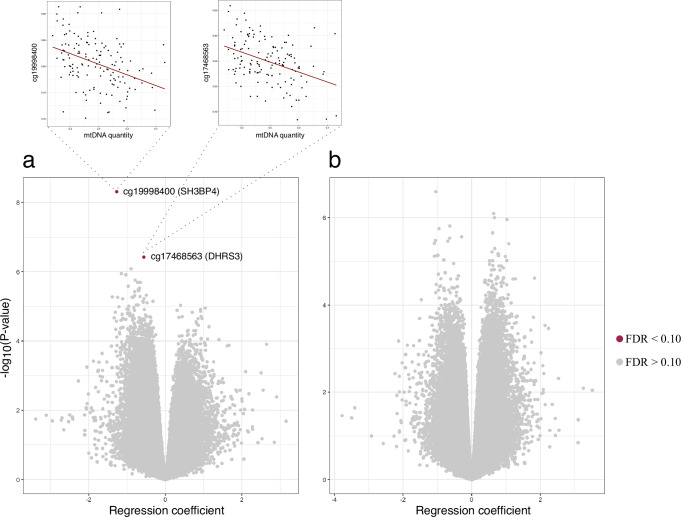
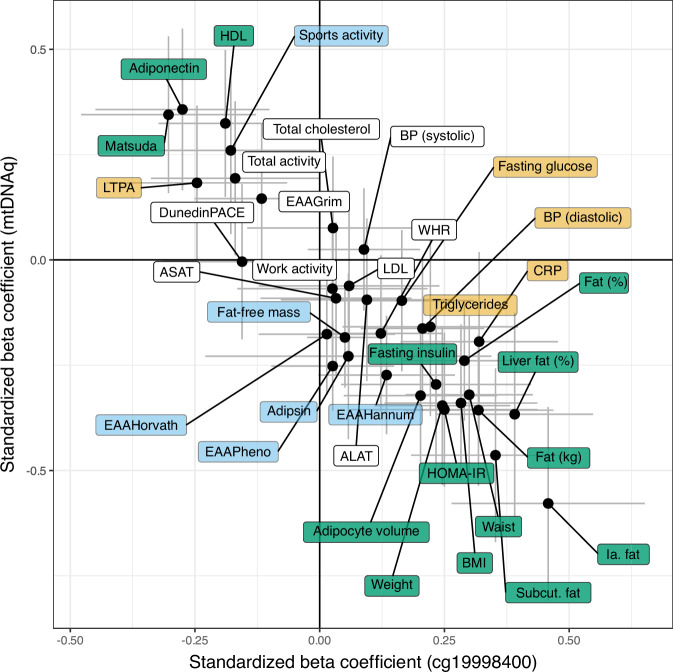
Alterations in mitochondrial metabolism in obesity may indicate disrupted communication between mitochondria and nucleus, and DNA methylation may influence this interplay. Here, we leverage data from the Finnish Twin Cohort study subcohort (n = 173; 86 full twin pairs, 1 singleton), including comprehensive measurements of obesity-related outcomes, mitochondrial DNA quantity and nuclear DNA methylation levels in adipose and muscle tissue, to identify one CpG at SH3BP4 significantly associated with mitochondrial DNA quantity in adipose tissue (FDR < 0.05). We also show that SH3BP4 methylation correlates with its gene expression. Additionally, we find that 14 out of the 35 obesity-related traits display significant associations with both SH3BP4 methylation and mitochondrial DNA quantity in adipose tissue. We use data from TwinsUK and the Scandinavian T2D-discordant monozygotic twin cohort, to validate the observed associations. Further analysis using ICE FALCON suggests that mitochondrial DNA quantity, insulin sensitivity and certain body fat measures are causal to SH3BP4 methylation. Examining mitochondrial DNA quantity and obesity-related traits suggests causation from mitochondrial DNA quantity to obesity, but unmeasured within-individual confounding cannot be ruled out. Our findings underscore the impact of mitochondrial DNA quantity on DNA methylation and expression of the SH3BP4 gene within adipose tissue, with potential implications for obesity.


Conflict of interest statement

Competing interests: The authors declare no competing interests.

Figures

Fig. 1
Fig. 1. Study flowchart.
FTC Finnish Twin Cohort, mtDNA mitochondrial DNA, MZ monozygotic, T2D type 2 diabetes.
Fig. 2
Fig. 2. Volcano plots of the epigenome-wide association studies on mtDNA quantity.
Results from (a) adipose tissue (n = 153 individuals) and (b) skeletal muscle (n = 155 individuals). Red dots indicate CpGs with FDR < 0.10. The correlations between the highlighted CpGs and mtDNA quantity is plotted above with the red line representing the fitted regression line. The data was analyzed using moderated t-statistics and adjusted for multiple comparisons with false discovery rate (FDR). Source data are provided through Figshare [10.6084/m9.figshare.26941927.v3]. mtDNA mitochondrial DNA.
Fig. 3
Fig. 3. Relationship between DNA methylation and gene expression at two genomic loci in adipose tissue.
a Correlation between methylation at cg19998400 and SH3BP4 expression (n = 80 individuals), showing the distribution of cg19998400 on top and SH3BP4 expression on right. b Correlation between methylation at cg17468563 and DHRS3 expression (n = 80 individuals), showing the distribution of cg17468563 on top and DHRS3 expression on right. Red lines in indicate fitted linear regression lines. c Variation in SH3BP4 and DHRS3 expression explained by methylation at cg19998400 and cg17468563 (yellow bars), respectively, and combined with common familial factors (genetic or environmental) (blue bars) (n = 80 individuals). Source data are provided in the Source Data file. DNAme DNA methylation, L2PM = log2-counts per million; r = Pearson correlation coefficient; *** p < 0.001.
Fig. 4
Fig. 4. Standardized beta coefficients and their 95% confidence intervals for the associations between obesity-related outcomes and methylation at cg19998400 (X-axis) or mtDNA quantity (Y-axis) (n = 42–142 individuals) in adipose tissue.
Yellow background indicates variables with FDR < 0.05 associated with cg19998400 methylation only, blue indicates variables associated with mtDNA quantity only, and green indicates variables associated with both. Black dots present estimates for standardized beta coefficients, and gray lines represent 95 % confidence intervals. Source data are provided in the Source Data file. ALAT Alanine aminotransferase, ASAT Aspartate aminotransferase, CRP high-sensitivity C-reactive protein, EAA epigenetic age acceleration, BP blood pressure, HDL high-density, LTPA leisure-time physical activity, mtDNAq mitochondrial DNA quantity, Subcut. subcutaneous.
Fig. 5
Fig. 5. Results from the ICE FALCON analysis between adipose tissue mtDNA quantity, SH3BP4 methylation and obesity-related outcomes.
a Conceptual figure illustrating the behavior of the ICE FALCON regression coefficients of Models 1–3 in each causal scenario. be Point estimates for the standardized regression coefficients and their 95% confidence intervals for the ICE FALCON analysis of (b) obesity-related outcomes regressed against SH3BP4 methylation, (c) SH3BP4 methylation regressed against obesity-related outcomes, (d) obesity-related outcomes regressed against mtDNA quantity and (e) mtDNA quantity regressed against obesity-related outcomes. ‘Self’ represents the association between twin’s own X and Y variables whereas ‘Cotwin’ is the cross-twin cross-trait association, i.e., the association between twin’s own X variable with their co-twin’s Y variable. ‘Adjusted’ refers to the regression coefficients derived from the ICE FALCON Model 3 that includes both twin’s own and their cotwin’s X variables. The p-values were calculated from regression coefficients and standard errors using two-sided z-statistics. No multiple comparison adjustment was applied. Source data with the exact p-values are provided as a Source Data file. b, c N (BMI, Fat %, Fat kg, HDL, Weight) = 68 pairs, N (Fasting insulin) = 64 pairs, N (HOMA-IR, Waist) = 61 pairs, N (Adipocyte vol.) = 57 pairs, N (Matsuda) = 56 pairs, N (Liver fat %) = 41 pairs, N (Adiponectin, Ia. Fat, Subcut. Fat) = 21 pairs d-e N (BMI, Fat %, Fat kg, HDL, Weight) = 71 pairs, N (Fasting insulin) = 67 pairs, N (HOMA-IR, Waist) = 64 pairs, N (Adipocyte vol.) = 60 pairs, N (Matsuda) = 59 pairs, N (Liver fat %) = 42 pairs, N (Adiponectin, Ia. Fat, Subcut. Fat) = 21 pairs HDL high-density lipoprotein, Ia. intra-abdominal, mtDNAq mitochondrial DNA quantity, Subcut. subcutaneous.

References

    1. Matilainen, O., Quirós, P. M. & Auwerx, J. Mitochondria and epigenetics – crosstalk in homeostasis and stress. Trends Cell Biol.27, 453–463 (2017). - PubMed
    1. Zhu, D., Li, X. & Tian, Y. Mitochondrial-to-nuclear communication in aging: an epigenetic perspective. Trends Biochem. Sci.47, 645–659 (2022). - PubMed
    1. Oh, S.-Y. et al. Alternative usages of multiple promoters of the Acetyl-CoA carboxylase β gene are related to differential transcriptional regulation in human and rodent tissues*. J. Biol. Chem.280, 5909–5916 (2005). - PubMed
    1. F. C. Lopes, A. Mitochondrial metabolism and DNA methylation: a review of the interaction between two genomes. Clin. Epigenetics12, 182 (2020). - PMC - PubMed
    1. Atilano, S. R. et al. Mitochondrial DNA variants can mediate methylation status of inflammation, angiogenesis and signaling genes. Hum. Mol. Genet.24, 4491–4503 (2015). - PMC - PubMed

Publication types

MeSH terms

Substances

LinkOut - more resources