. 2025 May 12;16(1):4392.
doi: 10.1038/s41467-025-59745-8.

Multi-omic analysis reveals a CAF-stemness-governed classification in HCC liver transplant recipients beyond the Milan criteria

Affiliations

Multi-omic analysis reveals a CAF-stemness-governed classification in HCC liver transplant recipients beyond the Milan criteria

Sunbin Ling et al. Nat Commun. .

Abstract

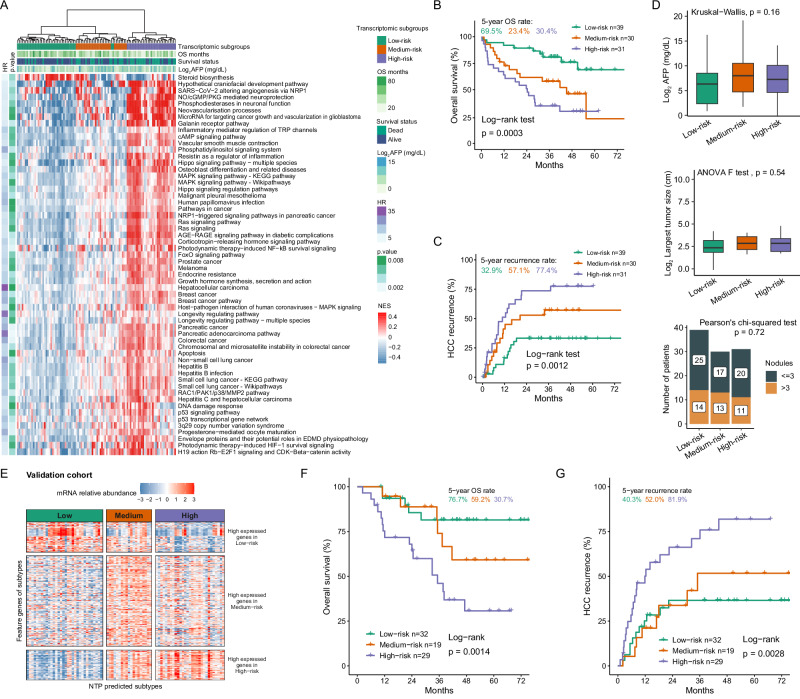
In patients with hepatocellular carcinoma (HCC) meeting the Milan criteria, liver transplantation (LT) is an effective therapy. This study aims to define the survival-related molecular biological features helping precisely identifying the patients with HCC beyond the Milan criteria who have acceptable outcomes. In the derivation cohort, integrated analyses of tumor tissues are conducted using RNA sequencing (RNA-seq), proteomic landscape, and transposase-accessible chromatin sequencing (ATAC-seq). Based on transcriptomics, three subgroups that significantly differ in overall survival were identified in the derivation cohort, and these findings are validated in an independent cohort. In-depth bioinformatics analysis using RNA-seq and proteomics reveals that the promotion of cancer stemness by cancer-associated fibroblasts (CAFs) can be responsible for the negative biological characteristics observed in high-risk HCC patients. The ATAC-seq identifies key factors regulating transcription, which may bridge CAF infiltration and stemness. Finally, we demonstrate that the CAF-derived CXCL12 sustains the stemness of HCC cells by promoting XRCC5 through CXCR4.


Conflict of interest statement

Competing interests: The authors declare no competing interests. Ethics approval statement: The study protocol was approved by the Review Boards of the NHC Key Laboratory of Combined Multi-organ Transplantation. The Ethical review approval number: 2018-768.

Figures

Fig. 1
Fig. 1. Transcriptomic stratification of patients with HCC beyond the Milan criteria undergoing LT and their clinical correlations.
A Heatmap representing significantly enriched pathways (KEGG and WikiPathway databases) in three RNA-seq subgroups. B, C Kaplan‒Meier curves for OS or HCC recurrence based on RNA-seq subgroups (log-rank test). D Boxplots of AFP levels and tumor size, and column plot of tumor nodules in three RNA-seq subgroups (Low-risk n = 39, Medium-risk n = 30, High-risk n = 31). P values are derived from the Kruskal‒Wallis rank sum test, ANOVA F test and Pearson’s chi-squared test. P values are shown on the graphs. Boxplot shows the median (center line), 25th, and 75th percentile (lower and upper boundary). The upper whisker extends from the upper boundary to the maxima value no further than 1.5 × IQR from the boundary. The lower whisker extends from the lower boundary to the minima value at most 1.5 × IQR of the boundary. Data beyond the end of the whiskers are outlying points and are plotted individually. E The NTP method was used to divide the validation cohort (from the Second Affiliated Hospital of Dalian Medical University and the Affiliated Hospital of Qingdao University) samples into three subtypes. The heatmap illustrates the RNA-seq expression profiles of characteristic genes in samples with subtype prediction (FDR < 0.01). F, G Kaplan‒Meier curves for OS or HCC recurrence based on RNA-seq subgroups (log-rank test) in the validation cohort. HCC hepatocellular carcinoma, LT liver transplantation, OS overall survival, AFP alpha fetal protein, NES normalized enrichment score, HR hazard rate, IQR interquartile range, NTP Nearest Template Prediction, FDR false discovery rate; In OS status, 1 dead, 0 alive.
Fig. 2
Fig. 2. Critical gene and protein signatures governing poor survival of HCC patients undergoing LT.
The volcano map (A) and enriched pathways (B) of significantly differentially expressed genes (FDR < 0.01, Two-tailed limma moderated t-test) between high-risk and low-risk RNA-seq subgroups. log2(fc) means log2 fold change between high-risk and low-risk groups. C Heatmap and quantitative analysis of differentially expressed genes in the CSC pathway (Two-tailed limma moderated t-test). The color of each cell represents the relative abundance of the gene. The length and color of the bar plot on the right side represents –log10 (adj.P. Val) of differentially expressed genes. Dashed line represented Benjamini-Hochberg method p value = 0.01. D Heatmap of differentially expressed proteins in three proteomic subgroups. E Kaplan‒Meier curves for OS based on proteomic subgroups (log-rank test) in the present HCC LT cohort. F Heatmap of CSC-related proteins in three proteomic subgroups. G OS Kaplan‒Meier curves (log-rank test) of certain CSC markers in the present cohort, depending on the 50% cut-off value of mass spectrometry-based protein quantification. OS overall survival, AFP alpha fetal protein, FDR false discovery rate, LT liver transplantation; HCC hepatocellular carcinoma, CSC cancer stemness cell, In OS status, 1 dead, 0 alive.
Fig. 3
Fig. 3. CAF infiltration is related to cancer stemness and poor survival in HCC patients undergoing LT.
A Heatmap of xCell-derived immune, microenvironment, neutrophil and stroma scores across three RNA-seq subgroups. The dashed line represented the Kruskal-Wallis Rank Sum test FDR = 0.01. B Detection of CAFs by mIF, which were determined by α-SMA and FAP-α staining. C Boxplots of xCell-derived CAF scores in patients with high or low CAF scores from mIF (CAFs High n = 28, CAFs Low n = 49) by two-tailed Wilcoxon Rank Sum Tests. Boxplot shows the median (center line), 25th, and 75th percentile (lower and upper boundary). The upper whisker extends from the upper boundary to the maxima value no further than 1.5 × IQR from the boundary. The lower whisker extends from the lower boundary to the minima value at most 1.5×IQR of the boundary. Data beyond the end of the whiskers are outlying points and are plotted individually. D Heatmap of DEGs in the cancer stem cells pathway in patients with high or low CAF scores from mIF. Kaplan‒Meier curves for OS (E) and HCC recurrence (F) in patients with high or low CAF scores from mIF. G Heatmap of DEGs in the CSC pathway in patients with high or low CAF infiltration from an scRNA-seq data set of 10 independent HCC cohorts. HCC hepatocellular carcinoma, LT liver transplantation, CAF cancer-associated fibroblast, FDR false discovery rate, scRNA-seq single-cell RNA sequencing, OS overall survival, mIF multiplex immunofluorescence, IQR interquartile range, DEGs differentially expressed genes.
Fig. 4
Fig. 4. Key transcription factors (TFs) identified by ATAC-seq.
A Heatmap of differentially expressed open chromatin regions detected by ATAC-seq and grouped by RNA-seq-based subgroups. B Bubble plots represent TFs significantly enriched for genes with differentially expressed ATAC-seq peaks (Fisher’s exact test). C Network of significantly enriched TFs with target genes, whose expression levels were determined according to RNA-seq results. D Boxplots presenting gene expression in patients with transcriptional activity of TFPA2C (Positive n = 20, Negative n = 48) and XRCC5 (Positive n = 34, Negative n = 34) by two-tailed Student’s t-test. Pearson correlations between gene expression and transcriptional activity greater than 0.3 were present. Transcriptional activity was represented by the normalized enrichment score from the single-sample gene set enrichment analysis method. Boxplot shows the median (center line), 25th, and 75th percentiles (lower and upper boundaries). The upper whisker extends from the upper boundary to the maxima value no further than 1.5 × IQR from the boundary. The lower whisker extends from the lower boundary to the minima value at most 1.5×IQR of the boundary. Data beyond the end of the whiskers are outlying points and are plotted individually. ATAC-seq, assay for transposase-accessible chromatin sequencing, OS overall survival; AFP alpha fetal protein, IQR interquartile range.
Fig. 5
Fig. 5. CAF induced XRCC5 sustains stemness of HCC cells.
A HuH-7 cells and Hep 3B cells with XRCC5 knockdown (shXRCC5-1 and shXRCC5-2) or not were cultured CAF-conditioned medium (CAF+) or not and the expression of XRCC5 was detected using western blotting. Band intensities were semi-quantified using IMAGE LAB software and normalized with β-actin. Values were presented as the means under the bands. B The volume curves of the tumor nodules in groups of HuH-7 cells and HuH-7 cells co-inoculated with CAF in nude mice (n = 7 per group). C Tumor nodules were resected after 20 days and XRCC5 expression were detected by IHC staining. The effect of XRCC5 knockdown or not on stemness of HCC cells were shown by in vitro self-renewal capacity (D), cell migration (E and F), mRNA expression levels of stemness-related genes (G, H) and limiting dilution xenograft formation in NOD/SCID mice (I, shXRCC5 represents XRCC5 knockdown, n = 5 per group), and stem cell frequency was calculated. J In HuH-7 cells and Hep 3B cells with XRCC5 overexpression (OE) or not (vector), XRCC5 was detected using western blotting. The stemness of above cells were shown according to the in vitro self-renewal capacity (K), mRNA expression levels of stemness-related genes (L) and cell migration (M). N IHC staining of XRCC5 in patients with HCC undergoing LT. O Heatmap of differentially expressed genes in the CSC pathway in patients with high or low XRCC5 expression from IHC. P Kaplan‒Meier curves for OS in patients with high or low XRCC5 expression from IHC. The data of cell functional assays and RT-qPCR analysis were presented as mean ± SD of three individual experiments, and the data from animal experiments were presented as mean ± SEM. Two-tailed Student’s t-test was used for comparisons, and P values are shown on the graphs. CAFs cancer-associated fibroblasts, HCC hepatocellular carcinoma; LT liver transplantation, IHC immunohistochemistry, OS overall survival, NC negative control, CI confidence interval. Source data are provided in the Source Data file.
Fig. 6
Fig. 6. Effect of CAF-derived CXCL12 on CXCR4/XRCC5 axis and stemness of HCC cells.
A CXCL12 concentration in CAF conditioned medium (CAF-CM) and LX-2 conditioned medium (LX-2-CM) was detected using ELISA. B, C XRCC5 expression was detected by western blotting in HCC cells treated with 0 nM, 10 nM, 100 nM, and 1 μM recombinant human CXCL12 protein for 48 h. Band intensities were semi-quantified using IMAGE LAB software and normalized with β-actin. Values were presented as the means under the bands. D Effect of siCXCR4 was detected by western blotting. E, F XRCC5 and CXCR4 expression was detected by western blotting in HCC cells treated with recombinant human CXCL12 protein (1 μM) and siCXCR4 or not. The effect of CXCL12 stimulation (1 μM) with CXCR4 knockdown or not, as well as CXCR4 inhibitor administration, AMD3100 (1 μM), or not on the stemness of HCC cells were shown by mRNA expression levels of stemness-related genes (G, H), cell migration (I), in vitro self-renewal capacity (J). K Schematic of the transwell co-culture model of HCC cells and CAFs. Created with BioRender.com. L, M The effect of co-culture with CXCR4 knockdown or not as well as AMD3100 (1 μM) administration or not on stemness of HCC cells were shown by mRNA expression levels of stemness-related genes. N IHC staining of CXCR4 and CXCL12 in patients with HCC undergoing liver transplantation. O Positive correlation between XRCC5 with CXCR4 and CXCL12 in 79 HCC samples. P Graphical summary of the mechanisms based on the combination of integrated multi-omics and experimental evidence. The data of ELISA (four individual experiments), cell functional assays and RT-qPCR analysis (three individual experiments) were presented as mean ± SD. Two-tailed Student’s t-test was used for comparisons, P values are shown on the graphs. ELISA, enzyme linked immunosorbent assay; HCC, hepatocellular carcinoma; IHC immunohistochemistry, TFs transcriptional factors, NC negative control, CAF cancer-associated fibroblast, ATAC-seq assay for transposase-accessible chromatin sequencing, CSC cancer stem cell. Source data are provided in the Source Data file.
Fig. 7
Fig. 7. Schematic illustration of study design.
A total of 180 patients transplanted from 2015–2019 were included (100 patients as derivation cohort, 80 patients as validation cohort). Samples from the derivation cohort were subjected to RNA-seq, ATAC-seq, and proteomic analyses. In vivo, in vitro experiments, and formalin-fixed paraffin-embedded HCC samples were used to validate the mechanisms. HCC hepatocellular carcinoma, ATAC-seq assay for transposase-accessible chromatin sequencing, IHC immunohistochemistry, mIF multiplex immunofluorescence. The figure was created with BioRender.com.

References

    1. Mazzaferro, V. et al. Liver transplantation for the treatment of small hepatocellular carcinomas in patients with cirrhosis. N. Engl. J. Med.334, 693–699 (1996). - PubMed
    1. Chen, J. et al. Clinical practice guideline on liver transplantation for hepatocellular carcinoma in China (2021 edition). Chin. Med J.135, 2911–2913 (2022). - PMC - PubMed
    1. Reig, M. et al. BCLC strategy for prognosis prediction and treatment recommendation: The 2022 update. J. Hepatol.76, 681–693 (2022). - PMC - PubMed
    1. Duvoux, C. et al. Liver transplantation for hepatocellular carcinoma: a model including alpha-fetoprotein improves the performance of Milan criteria. Gastroenterology143, 986–994 e983 (2012). quiz e914-985. - PubMed
    1. Mehta, N., Dodge, J. L., Roberts, J. P., Hirose, R. & Yao, F. Y. Alpha-Fetoprotein decrease from > 1,000 to <500 ng/mL in patients with hepatocellular carcinoma leads to improved posttransplant outcomes. Hepatology69, 1193–1205 (2019). - PMC - PubMed

MeSH terms