. 2025 May 12;16(1):4398.
doi: 10.1038/s41467-025-59513-8.

Comprehensive molecular profiling of FH-deficient renal cell carcinoma identifies molecular subtypes and potential therapeutic targets

Affiliations

Comprehensive molecular profiling of FH-deficient renal cell carcinoma identifies molecular subtypes and potential therapeutic targets

Xingming Zhang et al. Nat Commun. .

Abstract

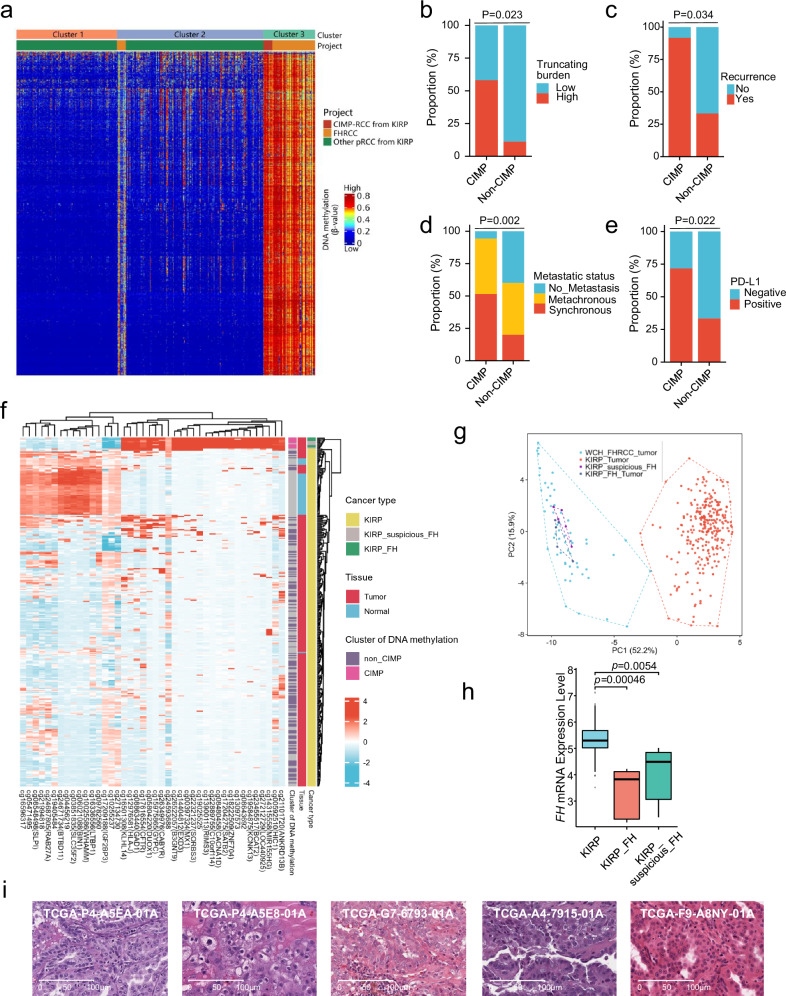
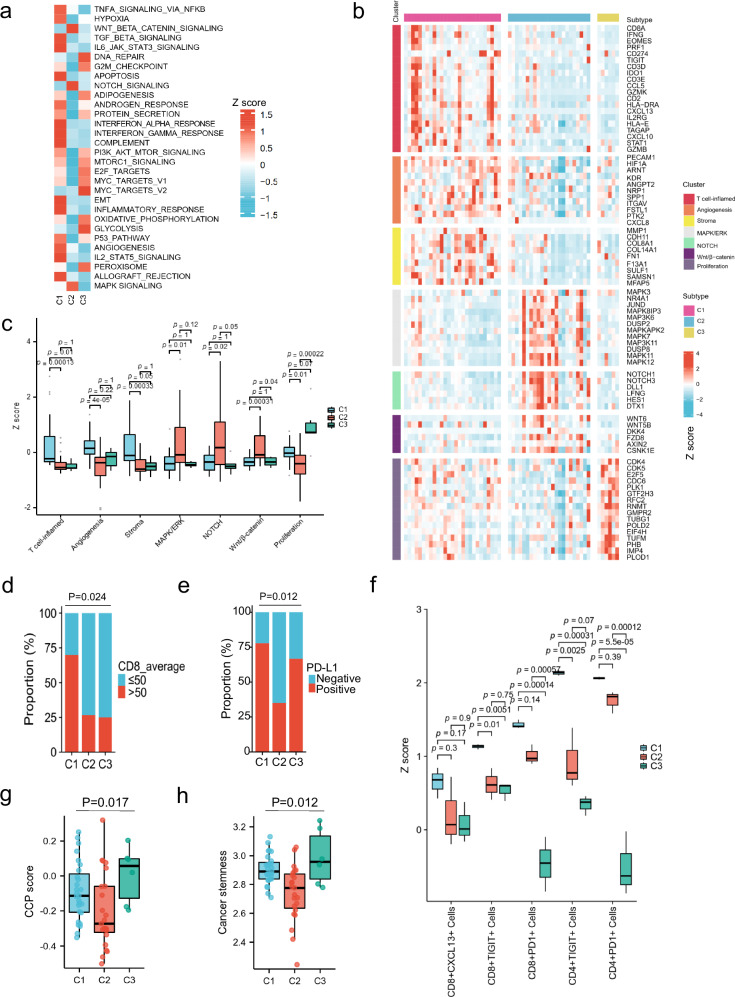
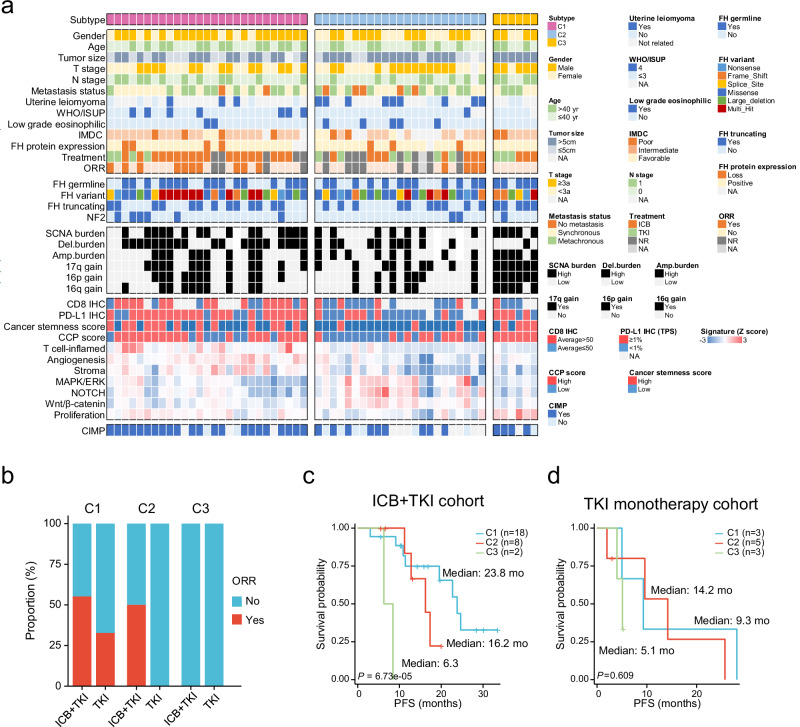
Fumarate hydratase-deficient renal cell carcinoma (FH-deficient RCC) is a rare yet highly lethal kidney cancer. To deepen our understanding of FH-deficient RCC, we conduct a comprehensive integrated genomic study. We analyze the association of FH alteration patterns with tumor heterogeneity and develop a CpG site-specific methylation signature for precise identification of FH-deficient RCC. Transcriptomic analysis unveils three distinctive molecular subtypes characterized by enrichment of immune/Angiogenic/Stromal (C1), WNT/Notch/MAPK (C2), and proliferation/stemness (C3) pathways, respectively. Tumors in C1 derive the most substantial survival benefit from a combination of immune checkpoint blockade (ICB) and anti-angiogenic therapy. Tumors in C2 display moderate response to this therapeutic approach. In contrast, tumors in C3 exhibit an unfavorable response to anti-angiogenic monotherapy and its combination with ICB. These findings contribute to a profound understanding of the aggressive nature of FH-deficient RCC, offering insights into potential precision medicine approaches for disease management.


Conflict of interest statement

Competing interests: The authors declare no competing interests.

Figures

Fig. 1
Fig. 1. The mutation landscape of FH-deficient RCC.
a Heatmap shows clinicopathological features of 77 FH-deficient RCC cases (top). Oncoplot shows the global landscape of somatic alterations of 77 FH-deficient RCC cases (bottom). The top 20 genes with the highest mutation frequency were selected for display. For the FH gene, the types of germline mutation were displayed in the oncoplot as well. The diagnosis of FH-deficient RCC were confirmed by IHC staining of FH and 2SC as previously described (Zheng, L. et al. Mod. Pathol., 2023). b Kaplan-Meier curves show PFS of patients with and without NF2 somatic mutation when receiving first-line ICB+TKI or TKI monotherapy treatment. c Kaplan-Meier curves show OS of patients with and without NF2 somatic mutation when receiving first-line ICB+TKI or TKI monotherapy treatment. d The three predominant mutational signatures detect in 71 FH-deficient RCC cases that conducted WES, namely SBS6, SBS22, SBS40. e Box plots depict the TMB, truncating burden and fslNDEL burden for patients with different mutational signatures that have the highest contribution using the Kruskal-Wallis test. Patients are divided into 3 subgroups: SBS6 (n = 25), SBS22 (n = 14), SBS40 (n = 32). Box plots show median levels (middle line), 25th and 75th percentile (box), 1.5 times the interquartile range (whiskers) as well as outliners (single points). P-values are determined by the two-sided Kruskal-Wallis test. f Kaplan-Meier curves show the DFS of localized patients with different mutational signatures. P-values are determined by two-sided log-rank test (b, c, f). RCC renal cell carcinoma, ISUP International Society of Urological Pathology, PFS progression-free survival, OS overall survival, ICB immune checkpoint blockade, TKI tyrosine kinase inhibitor, NF2-wt NF2 wild type, NF2-mut NF2 mutant, WES, whole exome sequencing, TMB tumor mutational burden, fsINDEL frameshift mutation by insertion or deletion, DFS disease-free survival. Source data are provided as a Source Data file.
Fig. 2
Fig. 2. Comprehensive analysis of FH variants.
a Lollipop plot shows types and locations of FH germline and somatic alterations. *Large deletions were not shown. Sites with no less than 3 mutations are annotated. b Pie charts show the distribution of alteration types of somatic (top) and germline (bottom) FH variants. c Pie chart shows the proportion of the three FH alteration subtypes (non-truncating mutation, truncating mutation, large deletion). d Box plot depicting the FH mRNA expression level in patients with different FH alteration subtypes. Patients are divided into 3 subgroups: Non_Truncating_Mutation (n = 18), Truncating_Mutation (n = 28), Large_Deletion (n = 10). Box plots show median levels (middle line), 25th and 75th percentile (box), 1.5 times the interquartile range (whiskers) as well as outliners (single points). P-values were determined by the two-sided Kruskal-Wallis test. e Bar chart depicting the proportions of FH protein expression by IHC in patients with different FH alteration subtypes. Patients are divided into 3 subgroups: Large deletion (n = 19), Truncating (n = 55), Non-truncating (n = 52). f Bar chart depicting the proportions of T stage <3 and ≥3 in patients with different FH alteration types. Patients are divided into 3 subgroups: Large deletion (n = 19), Truncating (n = 55), Non-truncating (n = 47). g Kaplan-Meier curves show PFS of patients with different FH alteration types who received first-line ICB + TKI treatment. h Kaplan-Meier curves show OS for patients with different FH alteration types who received first-line ICB + TKI treatment. P-values were determined by the two-sided Pearson’s Chi-squared test with continuity correction (e, f). P-values were determined by two-sided log-rank test (g, h). IHC immunohistochemistry, PFS progression-free survival, OS overall survival, ICB immune checkpoint blockade, TKI tyrosine kinase inhibitor. Source data are provided as a Source Data file.
Fig. 3
Fig. 3. Methylation patterns in FH-deficient RCC.
a One-dimensional hierarchical clustering of the 2000 most variant DNA methylation probes revealing three clusters of tumor samples of FH-deficient RCC (n = 56) in our cohort and KIRP (n = 276) in the TCGA database. In contrast to cluster 1 and 2, cluster 3 shows widespread DNA hypermethylation patterns characteristic of CIMP-associated tumors. The FH-deficient RCC tumors in our cohort are classified into two subsets: one, characterized by a global DNA hypermethylation phenotype, referred to as “CIMP”; the other, showing relatively low genome-wide DNA methylation, referred to as “non-CIMP”. The term “CIMP-RCC” refers to pRCC tumors from KIRP database, with a global DNA hypermethylation phenotype, which were used as controls in the clustering analysis. Each row represents a probe; each column represents a sample. b Bar chart depicts the prevalence truncating burden in CIMP (n = 46) and non-CIMP (n = 10) groups. c Bar chart depicts the prevalence recurrence status in CIMP (n = 22) and non-CIMP (n = 8) groups. Both CIMP and non-CIMP are from FH-deficient RCC tumors. d Bar chart depicts the prevalence metastatic status in CIMP (n = 46) and non-CIMP (n = 10) groups. Both CIMP and non-CIMP are from FH-deficient RCC tumors. e Bar chart depicts the prevalence PD-L1 expression by immunohistochemistry in CIMP (n = 45) and non-CIMP (n = 9) groups. P-values were determined by the two-sided Pearson’s Chi-squared test with continuity correction (b, ce). Both CIMP and non-CIMP are from FH-deficient RCC tumors. f One-dimensional hierarchical clustering of the 42 CpG sites reveal three clusters of samples from TCGA KIRP cohort (tumors n = 276, normal tissues n = 45) using the 42 CpG sites in our FH-deficient RCC methylation signature. Five tumor samples of KIRP carry FH mutations and are known to be FH-deficient RCC, and are defined as “KIRP_FH” (n = 5). Five tumors samples of KIRP has not been previously recognized as FH-deficient RCC but are clustered together with KIRP_FH, and are defined as “KIRP_suspicious_FH” (n = 5). The rest tumor samples are defined as “KIRP” (n = 266). g Principal component analysis of KIRP (n = 266), KIRP_FH (n = 5), KIRP_suspicious_FH (n = 5) and FH-deficient RCC (n = 56) in our cohort performed on 42 CpG sites derived from our FH-deficient RCC methylation signature. h Box plot depicts the FH mRNA expression level in KIRP (tumors, n = 266; normal tissues, n = 45), KIRP_FH (n = 5), KIRP_suspicious_FH (n = 5) in the TCGA database. Box plots show median levels (middle line), 25th and 75th percentile (box), 1.5 times the interquartile range (whiskers) as well as outliners (single points). P-values were determined by the two-sided Kruskal-Wallis test. i Representative H&E staining demonstrates morphological patterns of the 5 “KIRP suspicious FH” samples. Magnification ×200. Scale bar = 100 μm. RCC: renal cell carcinoma, CIMP CpG island methylator phenotype, KIRP kidney renal papillary cell carcinoma, KIRP_FH KIRP with FH mutations, KlRP_suspicious_FH KIRP suspicious to FH-deficient RCC using the 42-CpG methylation signature. Source data are provided as a Source Data file.
Fig. 4
Fig. 4. Transcriptional stratification identifies FH-deficient RCC tumor subsets with distinct biologic features.
a Heatmap representing ssGSEA scores of MSigDb hallmark gene set for each cluster. b Heatmap of expression level of genes comprised in transcriptional signatures for each cluster. Samples were grouped by cluster. c Box plots depicte the Z-scores of T effector, angiogenesis, stroma, MAPK/ERK, NOTCH, Wnt/β-catenin, proliferation signatures for different clusters (C1-C3). C1, n = 27; C2, n = 23; C3, n = 6. Box plots show median levels (middle line), 25th and 75th percentile (box), 1.5 times the interquartile range (whiskers) as well as outliners (single points). P-values were determined by the two-sided Mann-Whitney test. d Bar chart depicting the proportions of tumors with average CD8 IHC expression ≤50 cells/mm2 and >50 cells/mm2 in different molecular subtypes of FH-deficient RCC. C1 (n = 20), C2 (n = 15), C3 (n = 4). P-value was determined by the two-sided Fisher’s exact test. e Bar chart depicting the proportions of patients with negative (TPS < 1%) or positive (TPS ≥ 1%) PD-L1 expression by IHC in different molecular subtypes of FH-deficient RCC. C1 (n = 27), C2 (n = 20), C3 (n = 6). P-value was determined by the two-sided Pearson’s Chi-squared test with continuity correction. f Box plots depicting the number of CD8+CXCL13+, CD8+ TIGIT+, CD8+PD1+, CD4+TIGIT+, CD4+PD1+ cells/mm2 in different molecular subtypes of FH-deficient RCC. CD8+/PD-1+, CD4+/PD-1+, CD8+/TIGIT+ and CD4+/TIGIT+ markers to depict exhausted CD8+ and CD4+ T cells; while CD8+/CXCL13+ to represent anti-tumor CD8+ T cells. Box plots show median levels (middle line), 25th and 75th percentile (box), 1.5 times the interquartile range (whiskers) as well as outliners (single points). P-values were determined by the two-sided Kruskal-Wallis test. g, h Box plots depicting the ssGSEA scores of CCP score (g) and cancer stemness score (h) in different molecular subtypes of FH-deficient RCC. C1, n = 27; C2, n = 23; C3, n = 6. Box plots show median levels (middle line), 25th and 75th percentile (box), 1.5 times the interquartile range (whiskers), and specific score of each sample (single dots). P-values were determined by the two-sided Kruskal-Wallis test. RCC renal cell carcinoma, ssGSEA single-sample gene set enrichment analysis, IHC immunohistochemistry, TPS tumor proportion score, CCP cell cycle progression. Source data are provided as a Source Data file.
Fig. 5
Fig. 5. Molecular subtypes of FH-deficient RCC exhibit distinct genomic, transcriptomic and clinical features.
a Heatmap shows the genomic, transcriptomic and clinicopathological features for each molecular clusters (C1, n = 27; C2, n = 23; C3, n = 6). b Bar chart depicts the proportions of patients who achieved ORR when receiving first-line ICB + TKI combination therapy or TKI monotherapy in each molecular cluster. C1: ICB + TKI (n = 18), TKI (n = 3); C2: ICB + TKI (n = 8), TKI (n = 5); C3: ICB + TKI (n = 2), TKI (n = 3). c Kaplan-Meier curves show PFS of patients in different clusters when receiving first-line ICB + TKI (C1, n = 18; C2, n = 8; C3, n = 2). d Kaplan-Meier curves show PFS of patients in different clusters when receiving first-line TKI monotherapy (C1, n = 3; C2, n = 5; C3, n = 3). P-values were determined by two-sided log-rank test (c, d). RCC renal cell carcinoma, ORR objective response rate, ICB immune checkpoint blockade, TKI tyrosine kinase inhibitor, PFS progression-free survival. Source data are provided as a Source Data file.
Fig. 6
Fig. 6. Overview of three molecular subtypes of FH-deficient RCC.
Integrative analysis of 56 FH-deficient RCC resulted in 3 different subtypes with distinct biological and clinical characteristics. Radar charts in the RNA profile panel represent mean Z-scores for each gene signature in the respective subtypes. RCC, renal cell carcinoma, PFS progression-free survival, TPS tumor proportion score of PD-L1 by IHC, IMDC International Metastatic RCC Database Consortium Risk Model.

References

    1. Gardie, B. et al. Novel FH mutations in families with hereditary leiomyomatosis and renal cell cancer (HLRCC) and patients with isolated type 2 papillary renal cell carcinoma. J. Med. Genet.48, 226–234 (2011). - PubMed
    1. Yong, C., Stewart, G. D. & Frezza, C. Oncometabolites in renal cancer. Nat. Rev. Nephrol.16, 156–172 (2020). - PMC - PubMed
    1. Adam, J. et al. Renal cyst formation in Fh1-deficient mice is independent of the Hif/Phd pathway: roles for fumarate in KEAP1 succination and Nrf2 signaling. Cancer Cell20, 524–537 (2011). - PMC - PubMed
    1. Ashrafian, H. et al. Expression profiling in progressive stages of fumarate-hydratase deficiency: the contribution of metabolic changes to tumorigenesis. Cancer Res.70, 9153–9165 (2010). - PubMed
    1. Shanmugasundaram, K. et al. The oncometabolite fumarate promotes pseudohypoxia through noncanonical activation of NF-kappaB signaling. J. Biol. Chem.289, 24691–24699 (2014). - PMC - PubMed

MeSH terms

Substances