

Understanding the role of eye movement pattern and consistency during face recognition through EEG decoding
- PMID: 40355483
- PMCID: PMC12069637
- DOI: 10.1038/s41539-025-00316-3
Understanding the role of eye movement pattern and consistency during face recognition through EEG decoding
Abstract
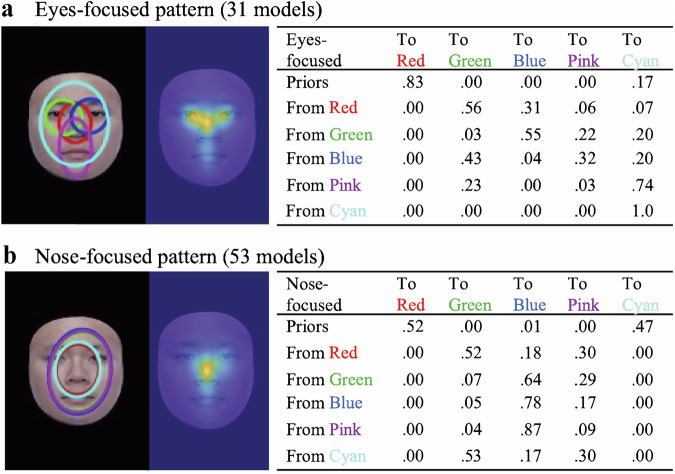
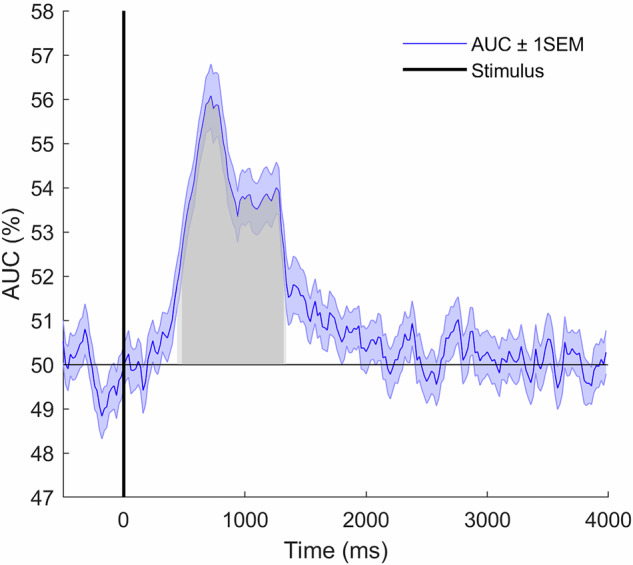
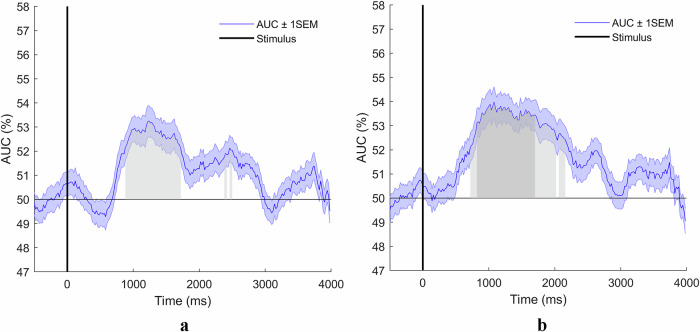
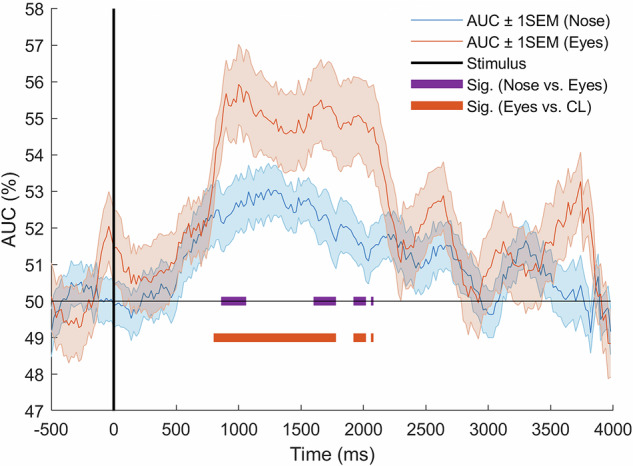
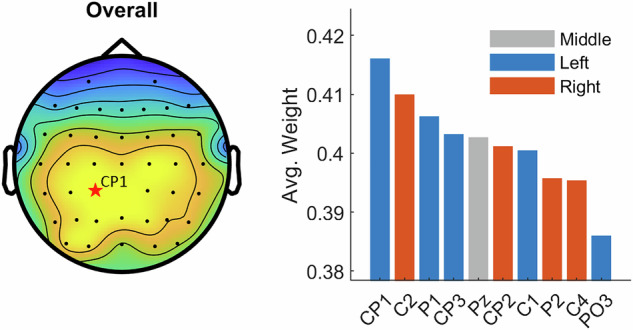
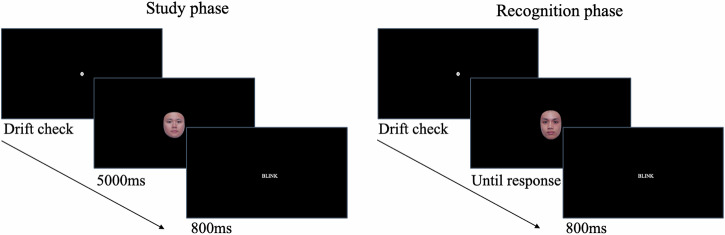
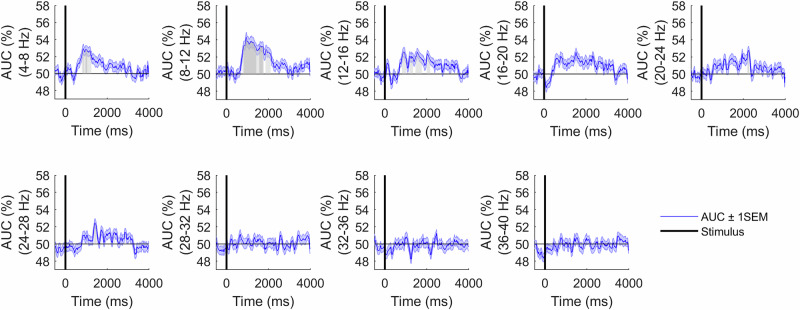
Eye movement patterns and consistency during face recognition are both associated with recognition performance. We examined whether they reflect different mechanisms through EEG decoding. Eighty-four participants performed an old-new face recognition task with eye movement pattern and consistency quantified using eye movement analysis with hidden Markov models (EMHMM). Temporal dynamics of neural representation quality for face recognition were assessed through decoding old vs new faces using a support vector machine classifier. Results showed that a more eye-focused pattern was associated with higher decoding accuracy in the high-alpha band, reflecting better neural representation quality. In contrast, higher eye movement consistency was associated with shorter latency of peak decoding accuracy in the high-alpha band, which suggested more efficient neural representation development, in addition to higher ERP decoding accuracy. Thus, eye movement patterns are associated with neural representation effectiveness, whereas eye movement consistency reflects neural representation development efficiency, unraveling different aspects of cognitive processes.
© 2025. The Author(s).
Conflict of interest statement
Competing interests: The authors declare no competing financial and/or non-financial interests.
Figures

Similar articles
-
Understanding the role of eye movement consistency in face recognition and autism through integrating deep neural networks and hidden Markov models.NPJ Sci Learn. 2022 Oct 25;7(1):28. doi: 10.1038/s41539-022-00139-6. NPJ Sci Learn. 2022. PMID: 36284113 Free PMC article.
-
Do portrait artists have enhanced face processing abilities? Evidence from hidden Markov modeling of eye movements.Cognition. 2021 Jun;211:104616. doi: 10.1016/j.cognition.2021.104616. Epub 2021 Feb 13. Cognition. 2021. PMID: 33592393
-
Eye movement analysis with hidden Markov models (EMHMM) with co-clustering.Behav Res Methods. 2021 Dec;53(6):2473-2486. doi: 10.3758/s13428-021-01541-5. Epub 2021 Apr 30. Behav Res Methods. 2021. PMID: 33929699 Free PMC article.
-
Decoding the dynamic representation of facial expressions of emotion in explicit and incidental tasks.Neuroimage. 2019 Jul 15;195:261-271. doi: 10.1016/j.neuroimage.2019.03.065. Epub 2019 Mar 30. Neuroimage. 2019. PMID: 30940611
-
The neural dynamics of familiar face recognition.Neurosci Biobehav Rev. 2024 Dec;167:105943. doi: 10.1016/j.neubiorev.2024.105943. Epub 2024 Nov 16. Neurosci Biobehav Rev. 2024. PMID: 39557351 Review.
Cited by
-
Impact of mask use on facial emotion recognition in individuals with subclinical social anxiety: an eye-tracking study.Cogn Res Princ Implic. 2025 Jun 2;10(1):25. doi: 10.1186/s41235-025-00635-4. Cogn Res Princ Implic. 2025. PMID: 40456987 Free PMC article.
References
-
- Abudarham, N., Shkiller, L. & Yovel, G. Critical features for face recognition. Cognition182, 73–83 (2019). - PubMed
-
- Royer, J. et al. Greater reliance on the eye region predicts better face recognition ability. Cognition181, 12–20 (2018). - PubMed
-
- Hills, P. J., Eaton, E. & Pake, J. M. Correlations between psychometric schizotypy, scan path length, fixations on the eyes and face recognition. Q J. Exp. Psychol.69, 611–625 (2016). - PubMed
LinkOut - more resources
Full Text Sources
