

Application of interpretable machine learning algorithms to predict macroangiopathy risk in Chinese patients with type 2 diabetes mellitus
- PMID: 40355529
- PMCID: PMC12069545
- DOI: 10.1038/s41598-025-01161-5
Application of interpretable machine learning algorithms to predict macroangiopathy risk in Chinese patients with type 2 diabetes mellitus
Abstract
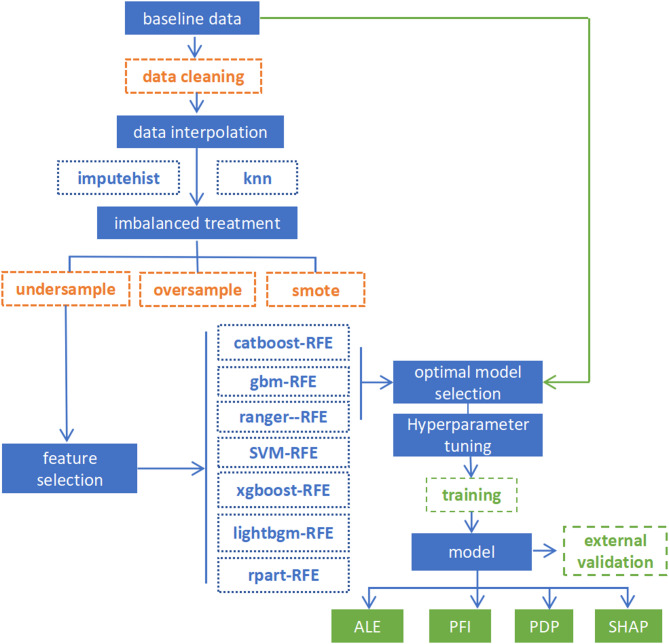
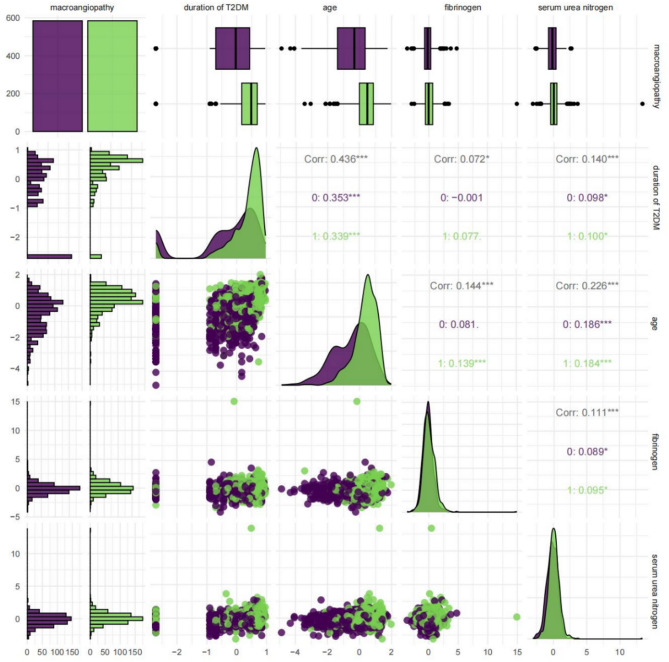
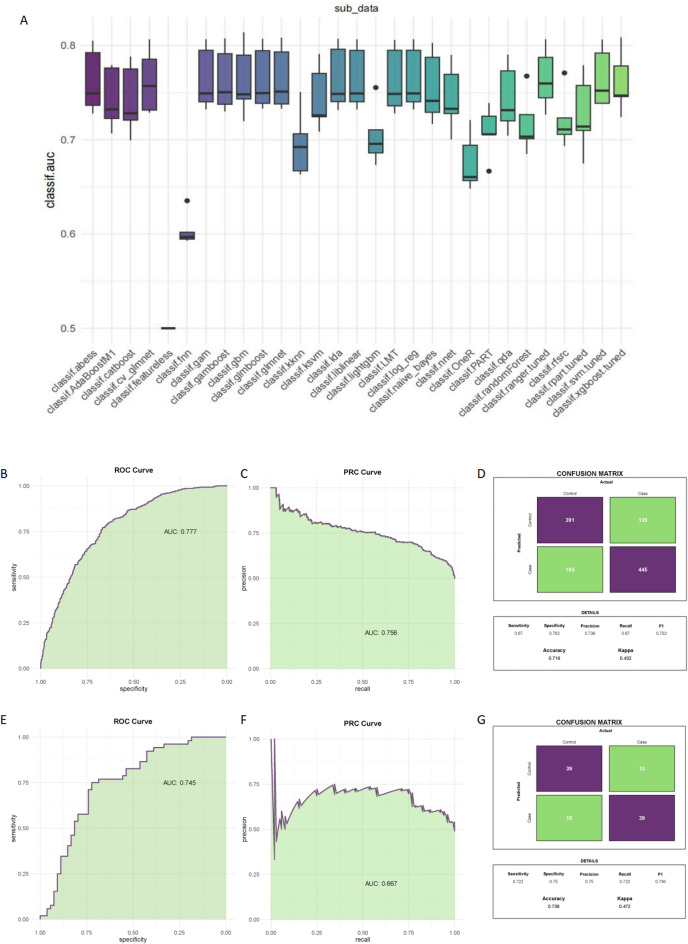
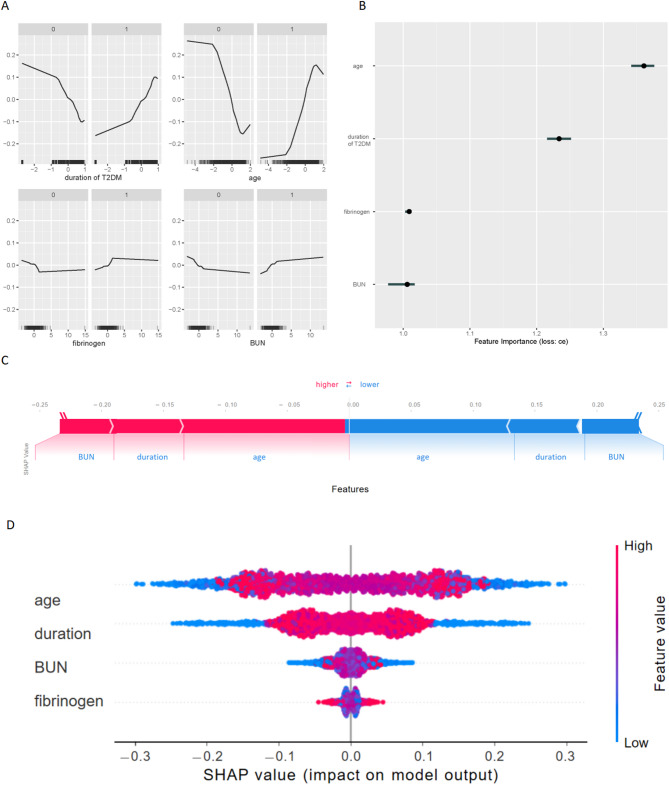
Macrovascular complications are leading causes of morbidity and mortality in patients with type 2 diabetes mellitus (T2DM), yet early diagnosis of cardiovascular disease (CVD) in this population remains clinically challenging. This study aims to develop a machine learning model that can accurately predict diabetic macroangiopathy in Chinese patients. A retrospective cross-sectional analytical study was conducted on 1566 hospitalized patients with T2DM. Feature selection was performed using recursive feature elimination (RFE) within the mlr3 framework. Model performance was benchmarked using 29 machine learning (ML) models, with the ranger model selected for its superior performance. Hyperparameters were optimized through grid search and 5-fold cross-validation. Model interpretability was enhanced using SHAP values and PDPs. An external validation set of 106 patients was used to test the model. Key predictive variables identified included the duration of T2DM, age, fibrinogen, and serum urea nitrogen. The predictive model for macroangiopathy was established and showed good discrimination performance with an accuracy of 0.716 and an AUC of 0.777 in the training set. Validation on the external dataset confirmed its robustness with an AUC of 0.745. This study establish an approach based on machine learning algorithm in features selection and the development of prediction tools for diabetic macroangiopathy.
Keywords: Machine learning methods; Macroangiopathy; Prediction model; Risk factor; T2DM.
© 2025. The Author(s).
Conflict of interest statement
Declarations. Competing interests: The authors declare no competing interests. Ethics approval and consent to participate: This study was approved by the Institutional Review Board of the First Affiliated Hospital of Zhengzhou University. Written informed consent to participate was obtained from all participants.
Figures


Similar articles
-
Machine learning algorithms for diabetic kidney disease risk predictive model of Chinese patients with type 2 diabetes mellitus.Ren Fail. 2025 Dec;47(1):2486558. doi: 10.1080/0886022X.2025.2486558. Epub 2025 Apr 7. Ren Fail. 2025. PMID: 40195601 Free PMC article.
-
Development and internal validation of an interpretable risk prediction model for diabetic peripheral neuropathy in type 2 diabetes: a single-centre retrospective cohort study in China.BMJ Open. 2025 Apr 3;15(4):e092463. doi: 10.1136/bmjopen-2024-092463. BMJ Open. 2025. PMID: 40180384 Free PMC article.
-
Predictive model and risk analysis for peripheral vascular disease in type 2 diabetes mellitus patients using machine learning and shapley additive explanation.Front Endocrinol (Lausanne). 2024 Feb 28;15:1320335. doi: 10.3389/fendo.2024.1320335. eCollection 2024. Front Endocrinol (Lausanne). 2024. PMID: 38481447 Free PMC article.
-
Development and validation of 10-year risk prediction models of cardiovascular disease in Chinese type 2 diabetes mellitus patients in primary care using interpretable machine learning-based methods.Diabetes Obes Metab. 2024 Sep;26(9):3969-3987. doi: 10.1111/dom.15745. Epub 2024 Jul 15. Diabetes Obes Metab. 2024. PMID: 39010291
-
An enhanced machine learning algorithm for type 2 diabetes prognosis with a detailed examination of Key correlates.Sci Rep. 2024 Nov 1;14(1):26355. doi: 10.1038/s41598-024-75898-w. Sci Rep. 2024. PMID: 39487189 Free PMC article.
Cited by
-
Predicting Antimicrobial Peptide Activity: A Machine Learning-Based Quantitative Structure-Activity Relationship Approach.Pharmaceutics. 2025 Jul 31;17(8):993. doi: 10.3390/pharmaceutics17080993. Pharmaceutics. 2025. PMID: 40871016 Free PMC article.
-
Machine Learning-Powered Smart Healthcare Systems in the Era of Big Data: Applications, Diagnostic Insights, Challenges, and Ethical Implications.Diagnostics (Basel). 2025 Jul 30;15(15):1914. doi: 10.3390/diagnostics15151914. Diagnostics (Basel). 2025. PMID: 40804880 Free PMC article. Review.
References
-
- Ogurtsova, K. et al. IDF diabetes atlas: global estimates of undiagnosed diabetes in adults for 2021. Diabetes Res. Clin. Pract.183, 109118 (2022). - PubMed
-
- Bahardoust, M. et al. Effect of Metformin (vs. Placebo or sulfonylurea) on all-cause and cardiovascular mortality and incident cardiovascular events in patients with diabetes: an umbrella review of systematic reviews with meta-analysis. J. Diabetes Metab. Disord. 23 (1), 27–38 (2023). - PMC - PubMed
MeSH terms
Supplementary concepts
Grants and funding
- 82102281/the National Natural Science Foundation of China
- 2021JJ40867/the Natural Scientific Foundation of Hunan Province
- 2021JJ40893/the Natural Scientific Foundation of Hunan Province
- 202101062143/the Scientific Research Fund of Hunan Province Health Commission
- 202101062143/the Scientific Research Fund of Hunan Province Health Commission
LinkOut - more resources
Full Text Sources
Medical
