. 2025 May;27(5):847-862.
doi: 10.1038/s41556-025-01651-8. Epub 2025 May 12.

ALDH4A1 functions as an active component of the MPC complex maintaining mitochondrial pyruvate import for TCA cycle entry and tumour suppression

Affiliations

ALDH4A1 functions as an active component of the MPC complex maintaining mitochondrial pyruvate import for TCA cycle entry and tumour suppression

Che-Chia Hsu et al. Nat Cell Biol. 2025 May.

Abstract

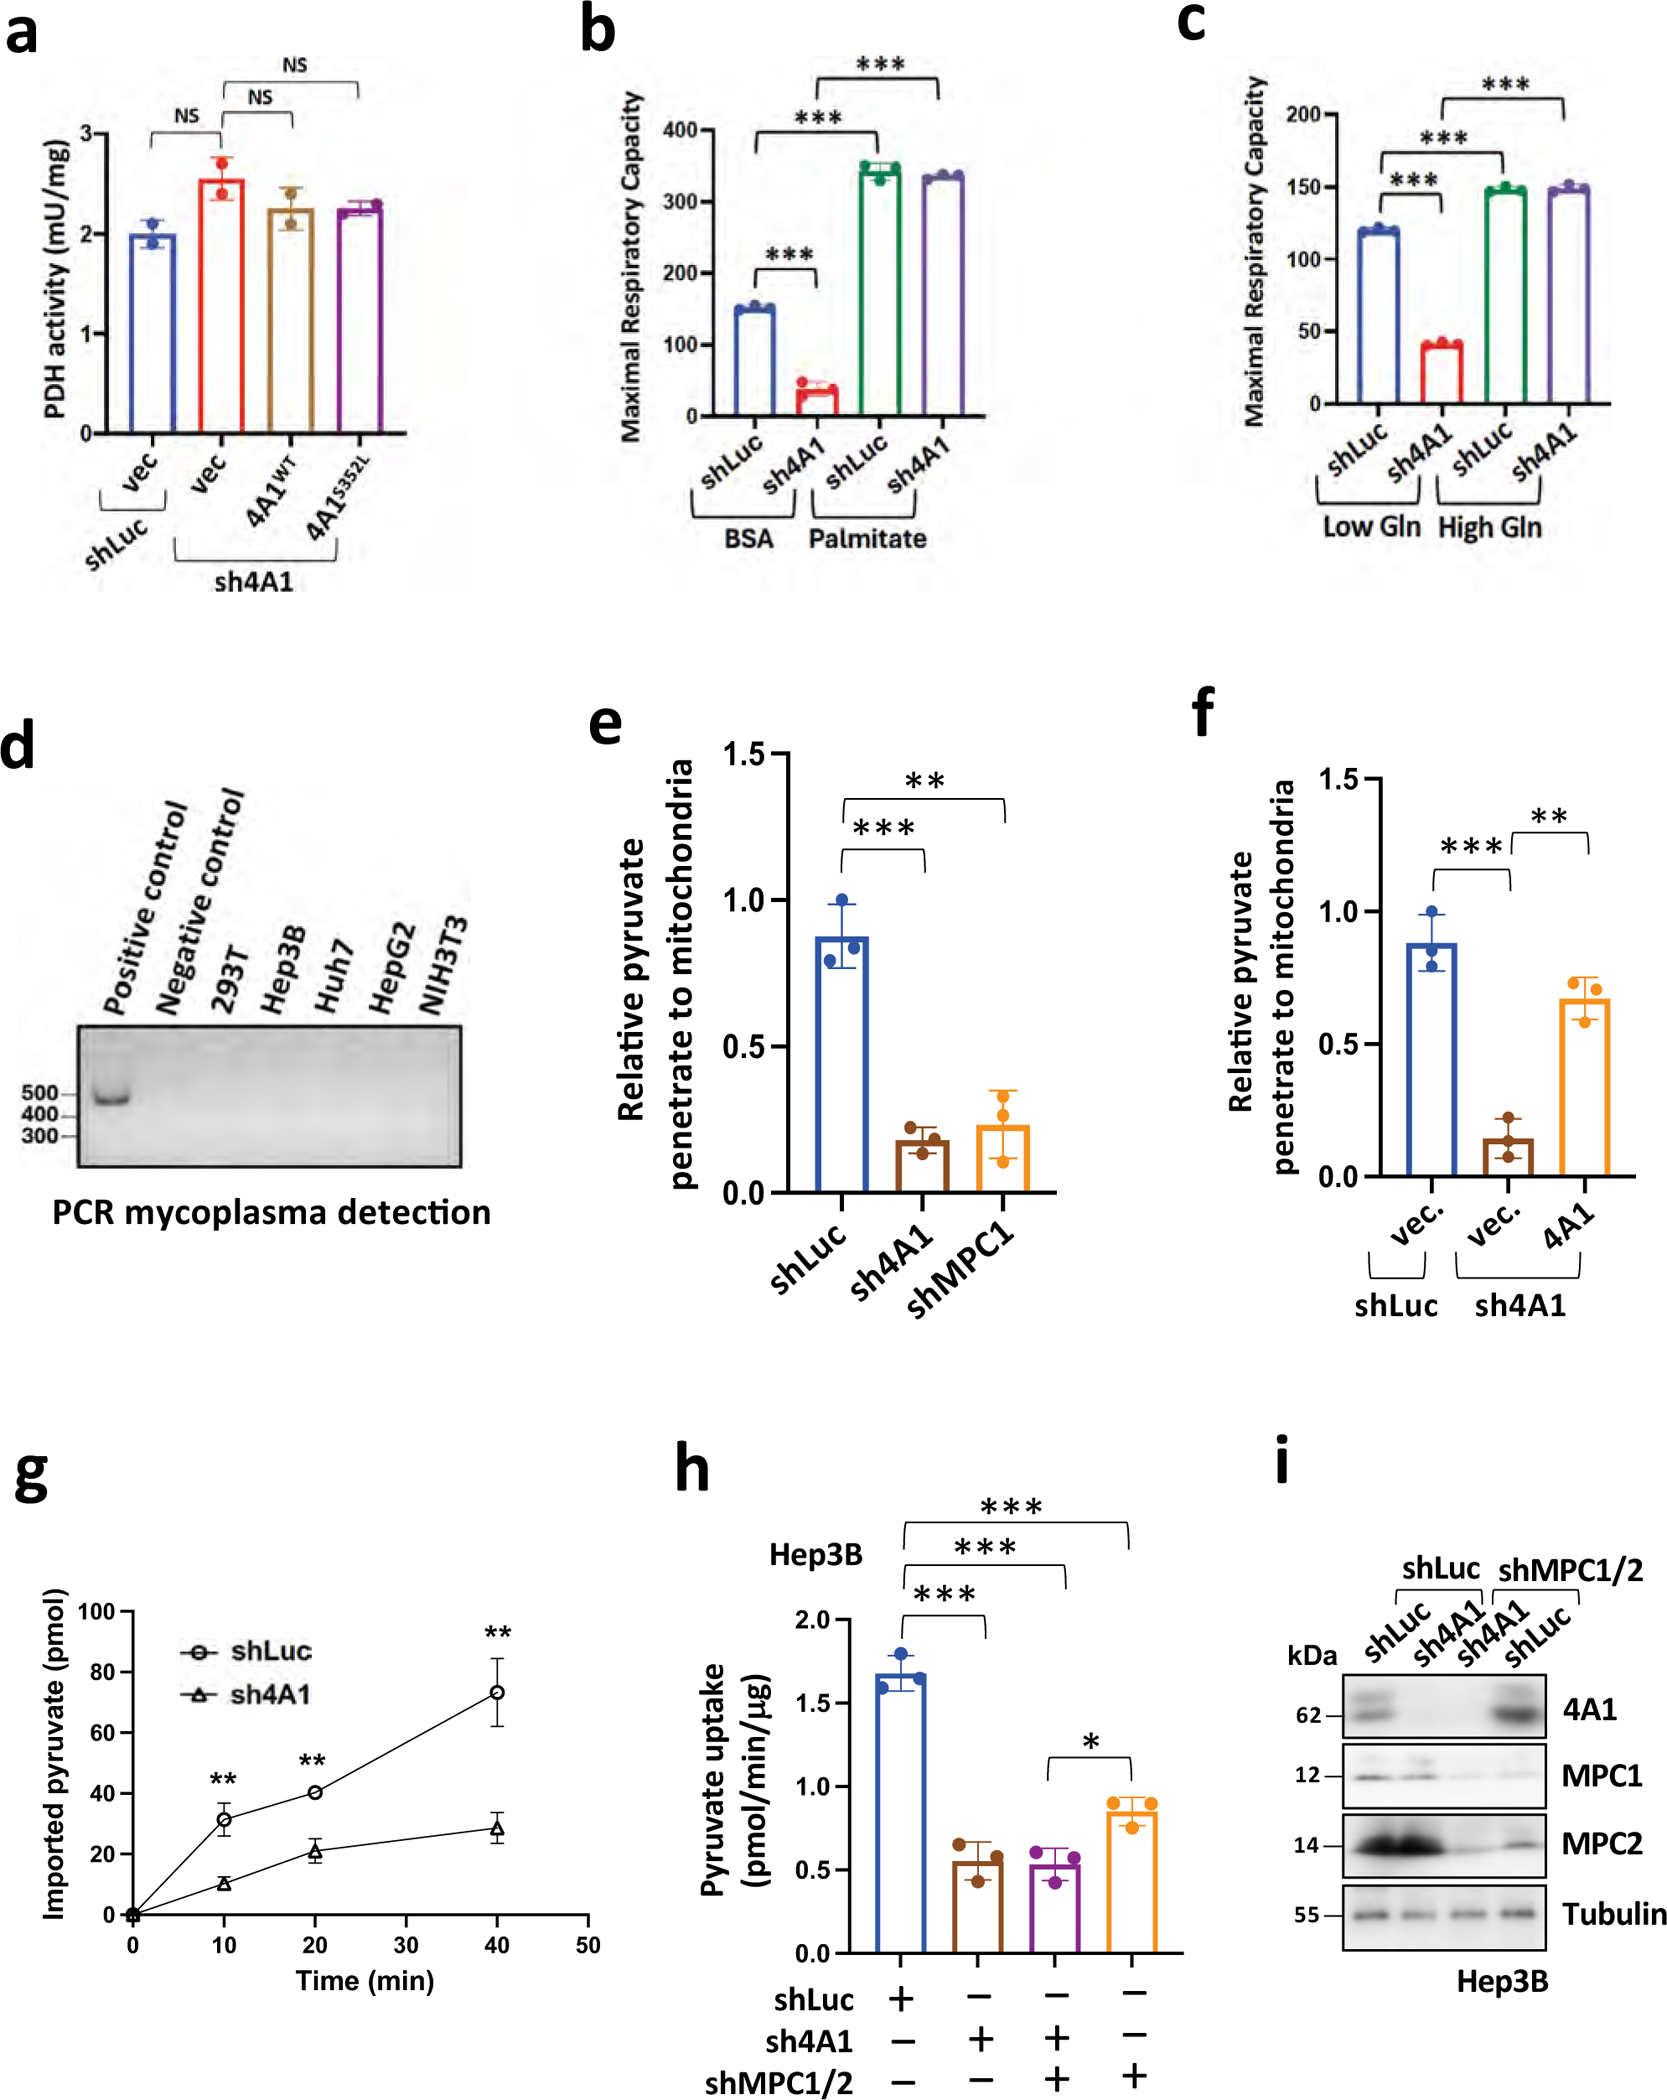
MPC1 and MPC2 are two well-known components of the mitochondrial pyruvate carrier (MPC) complex maintaining MPC activity to transport pyruvate into mitochondria for tricarboxylic acid (TCA) cycle entry in mammalian cells. It is currently unknown whether there is an additional MPC component crucially maintaining MPC complex activity for pyruvate mitochondrial import. Here we show that ALDH4A1, a proline-metabolizing enzyme localized in mitochondria, serves as a previously unrecognized MPC component maintaining pyruvate mitochondrial import and the TCA cycle independently of its enzymatic activity. Loss of ALDH4A1 in mammalian cells impairs pyruvate entry to mitochondria, resulting in defective TCA cycle entry. ALDH4A1 forms an active trimeric complex with MPC1-MPC2 to maintain the integrity and oligomerization of MPC1-MPC2 and facilitates pyruvate transport in an in vitro system. ALDH4A1 displays tumour suppression by maintaining MPC complex activity. Our study identifies ALDH4A1 as an essential component of MPC for pyruvate mitochondrial import, TCA cycle entry and tumour suppression.


Conflict of interest statement

Competing interests: H.K.L. is a consultant for Stablix, Inc. and Chang Gung University of Science and Technology. All other authors declare no competing interests.

Figures

Extended Data Fig. 1 |
Extended Data Fig. 1 |. ALDH4A1 protein levels are downregulated in various human cancers and its loss predicts poor survival outcome.
(a, b) The gene expression of ALDH4A1 patterns across diverse human cancer and normal tissues from GENT (gene expression database of normal and tumor tissues). Significant test results P < 0.001 by two-sample t-test were indicated on web-accessible database of GENT (http://gent2.appex.kr/gent2/). The centre lines in the boxes represent median values. The box edges, upper and lower whiskers indicate the interquartile range (IQR; from the 1 to 3.7), the largest value smaller than 3.7 and the smallest value larger than 1 (a) and Oncomine publicly accessible database (b) P < 0.001 by Mann-Whitney U test. (c) The overall survival rate of patients with high or low ALDH4A1 expression from PrognoScan. P < 0.05 by long-rank test. (d) The database extracted from Kaplan-Meier Plotter was subjected to Kaplan-Meier analysis. (e) The percentage of cases from TCGA database (https://portal.gdc.cancer.gov) indicates loss of copy number variation (CNV) of ALDH4A1 in several cancer types including adenomas and adenocarcinomas from brain, liver, lung, stomach, pancreas, bladder, kidney, etc.
Extended Data Fig. 2 |
Extended Data Fig. 2 |. ALDH4A1 suppresses cancer cell growth, migration, sphere formation.
(a-d) Representative images (a and c) and quantification of cancer cell migration (b) and sphere formation (d) for Hep3B cells upon vec, 4A1WT, shLuc, sh4A1 (#1 and #2) and sh4A1 #1 with 4A1WT. (e-h) Representative images (e and g) and quantification (f and h) of cancer cell migration (e) and sphere formation (g) for Huh7 cells upon vec, 4A1WT, shLuc, sh4A1 (#1 and #2) and sh4A1 #1 with 4A1WT. Data are presented as mean ± s.d. by one-way ANOVA with Bonferroni post-hoc tests) from 3 biological replicates (n = 3); ***P < 0.001, compared to the shLuc. **, P < 0.01, ***, P < 0.001.
Extended Data Fig. 3 |
Extended Data Fig. 3 |. ALDH4A1 loss promotes cancer cell migration, cancer sphere formation, cell transformation and orthotopic liver cancer formation.
(a) Immunoblotting of HepG2 cells upon shLuc, sh4A1 (#1 and #2), shp53 (#1 and #2), and shRb (#1 and #2) using indicated antibodies. (b-e) Representative images and quantification of cancer cell migration (b and d) and sphere formation (c and e) for HepG2 cells upon vec, 4A1WT, shLuc, sh4A1 (#1 and #2) and sh4A1 #1 with 4A1WT, shp53 (#1 and #2) and shRb (#1 and #2). Data are presented as mean ± s.d. by one-way ANOVA with Bonferroni post-hoc tests from 3 biological replicates (n = 3); ***P < 0.001, compared to the shLuc. **, P < 0.01, ***, P < 0.001.
Extended Data Fig. 4 |
Extended Data Fig. 4 |. ALDH4A1 loss promotes cell transformation and orthotopic liver cancer formation.
(a, c) Representative images (a) and relative number of soft agar colony assay (c) for NIH3T3 cells upon shLuc, sh4A1#1, sh4A1#1 with restoration of 4A1WT. Data from (c) are presented as mean ± s.d by two-tailed unpaired t-test from 3 biological replicates (n = 3). **, P < 0.01. (b) Cell lysates from NIH3T3 cells upon shLuc, sh4A1#1 or sh4A1#1 with restoration of 4A1WT were subjected to immunoblotting assay with indicated antibodies. (d) Hep3B cells upon shGFP with luciferase (Luc) and sh4A1 (#1 and #2) with Luc were orthotopically injected into liver, followed by IVIS imaging after 4 weeks. Representative rainbow images of luminescence in livers of nude mice were shown. Rainbow scales are expressed in radiance (p/sec/cm2/sr). (e) Quantification of average radiance (p/sec/cm2/sr) from 5 mice in each group. Data are presented as mean ± s.d by two-tailed unpaired t-test from 5 biological replicates (n = 5). **, P < 0.01. *, P < 0.05.
Extended Data Fig. 5 |
Extended Data Fig. 5 |. Increased proline, ornithine or arginine levels do not account for cancer cell proliferation regulated by ALDH4A1.
(a, b, c) Colony formation assay in Hep3B cells treated with proline (a), ornithine (b) and arginine (c) with indicated concentration in Vec, 4A1WT and shLuc, sh4A1 (#1, #2) or sh4A1#1 restored with 4A1WT. (d) Cell proliferation of control and PRODH knockdown (shPRODH #1 and shPRODH #2) Hep3B were determined. Data are presented as mean ± s.d. by two-tailed unpaired t-test from 5 biological replicates (n = 5). Data is no significance between PRODH knockdown and control cells.
Extended Data Fig. 6 |
Extended Data Fig. 6 |. ALDH4A1 is mainly localized in mitochondria and critically maintains mitochondrial pyruvate levels and mitochondrial oxidative phosphorylation independently of its enzymatic activity.
(a) Immunoblotting of the fractionation of whole cell lysates (WCL), cytoplasm and mitochondria from stably expressing shLuc or shALDH4A1 Hep3B cells using indicated antibodies. (b) Immunoblotting of mitochondrial fractions from stably expressing control or ALDH4A1 knockdown Hep3B cells using indicated antibodies. The representative data are shown from two independent experiments. (c, e, f) Pyruvate level in the cytosolic and mitochondrial extracts of shLuc or shALDH4A1 (c), treatment of DMSO (vehicle control) or MPC1 inhibitor UK5099 (0.1 mM) for 24 hr (e), and shLuc or shMPC1 (f) Hep3B cells were determined. Data are presented as mean ± s.d by two-tailed unpaired t-test from 3 biological replicates (n = 3). *, P < 0.05; **, P < 0.01; ***, P < 0.001. (d) The pyruvate levels in mitochondria and cytosol in control, ALDH4A1 knockdown, and ALDH4A1 knockdown with ALDH4A1WT or ALDH4A1S352L mutant restoration Hep3B cells. Data are presented as mean ± s.d. by one-way ANOVA with Bonferroni post-hoc tests from 3 biological replicates (n = 3); Red is cytosol part, and blue i smitochondria part. ***P < 0.001 for cytosol and mitochondria part; NS, not significant. (g) maximal respiratory capacity from (a) was calculated by OCR measurement at basal levels and upon FCCP treatment subtracted by non-mitochondrial respiratory. Data are presented as mean ± s.d. by two-tailed unpaired t-test from 3 biological replicates (n = 3). ***, P < 0.001. (h) The OCR assay was performed in 5 μg of isolated mitochondria from Hep3B cells upon shLuc, sh4A1, or sh4A1 with restoration of either 4A1WT or 4A1 enzymatic dead mutant (4A1S352L) in a coupling state with the substrates, 10 mM succinate and 2 μM rotenone, followed by 4 mM ADP, 2.5 μg/ml oligomycin (oligo), 4 μM FCCP, or 4 μM Antimycin (AA) treatment. Data are presented as mean ± s.d. by two-way ANOVA from 5 biological replicates (n = 5). NS, non-significant. (i, j) RCR were calculated by state 3/state 4o (i) and state 3 u/state 4o (j) from (h). Data are presented as mean ± s.d. by two-tailed unpaired t-test from 5 biological replicates (n = 5). NS, non-significant. (k) The OCR assay was performed in 5 μg of isolated mitochondria from Hep3B cells upon shLuc, sh4A1, or sh4A1 with restoration of either 4A1WT or 4A1 enzymatic dead mutant (4A1S352L) in a coupling state with the substrates, 5 mM pyruvate and 5 mM malate, followed by 4 mM ADP, 2.5 μg/ml oligomycin (oligo), 4 μM FCCP, or 4 μM Antimycin (AA) treatment. Data are presented as mean ± s.d. by two-way ANOVA from 5 biological replicates (n = 5). NS, non-significant. shLuc vs. sh4A1, ***P < 0.001; sh4A1 vs. sh4A1 + 4A1WT, ***P < 0.001; sh4A1 vs. sh4A1 + 4A1S352L, ***P < 0.001. (l, m) RCR were calculated by state 3/state 4o (l) and state 3 u/state 4o (m) from (k). Data are presented as mean ± s.d. by two-tailed unpaired t-test from 5 biological replicates (n = 5). **, P < 0.01; ***, P < 0.001.
Extended Data Fig. 7 |
Extended Data Fig. 7 |. ALDH4A1 loss does not affect pyruvate dehydrogenase activity, and glutamine and fatty acid oxidation, but impairs pyruvate transport.
(a) Relative PDH activity upon shluc with vec, sh4A1 with vec, 4A1WT, 4A1S352L was shown. Data are presented as mean ± s.d. by two-tailed unpaired t-test from 3 biological replicates (n = 3). *P < 0.05. Unpaired, two-tailed t-test; *P < 0.05, **P < 0.01, ***P < 0.001. (b) Maximal respiratory capacity from Fig. 3i was calculated by OCR measurement at basal levels and upon FCCP treatment subtracted by non-mitochondrial respiratory. Data are presented as mean ± s.d. by two-tailed unpaired t-test from 3 biological replicates (n = 3). ***, P < 0.001. (c) Maximal respiratory capacity from Fig. 3j was calculated by OCR measurement at basal levels and upon FCCP treatment subtracted by non-mitochondrial respiratory. Data are presented as mean ± s.d. by two-tailed unpaired t-test from 3 biological replicates (n = 3). ***, P < 0.001. (d) Mycoplasma PCR Detection Kit (Abcam, ab289834) were used to detect mycoplasma in cell culture medium. Mycoplasma positive control is provided by Kit to present PCR product of ~500 bp in length that indicates cell culture contaminated with mycoplasma. (e, f) Pyruvate was incubated with isolated mitochondria from stably expressing control (shLuc), shALDH4A1 (sh4A1), shMPC1, shLuc accompanied by vector expression, sh4A1 restored by 4A1 Hep3B cells in vitro for 1 hour. Pyruvate levels in mitochondria were determined by Pyruvate Assay Kit (BioVision, K609) according to the manufacturer’s instructions. Data are presented as mean ± s.d. by two-tailed unpaired t-test from 3 biological replicates (n = 3). **, P < 0.01; ***, P < 0.001. (g) Kinetic of pyruvate uptake was determined by incubating 14C-pyruvate with isolated mitochondria from 2×10⁷ Hep3B cells stably expressing shLuc or sh4A1 at indicated time points. Data are presented as mean ± s.d. by two-tailed unpaired t-test from 3 biological replicates (n = 3). **, P < 0.01. (h) Pyruvate uptake was determined by using 14C-Pyruvate incubated with isolated mitochondria upon shLuc, sh4A1 (#1), shMPC1MPC/2 and shMPC1/MPC2 with sh4A1 (#1) in Hep3B cells. *, P < 0.05; **, P < 0.01. Data are presented as mean ± s.d. by two-tailed unpaired t-test from 3 biological replicates (n = 3). ***, P < 0.001. (i) Immunoblotting of Hep3B upon shLuc, sh4A1 (#1), shMPC1/MPC2 and shMPC1/MPC2 with sh4A1 (#1) using indicated antibodies.
Extended Data Fig. 8 |
Extended Data Fig. 8 |. ALDH4A1 maintains the integrity of MPC1/MPC2 complex and forms the oligomeric complex with MPC1/MPC2.
(a, b) Cell lysates from HepG2 (a) and Huh7 (b) upon shLuc expression were subjected to immunoprecipitation with IgG or 4A1 antibodies, followed by immunoblotting with indicated antibodies. The representative data are shown from 3 independent experiments. (c) Cell lysates from Hep3B upon shLuc with vector, sh4A1 with vector or 4A1WT expression were subjected to immunoprecipitation with IgG or Flag antibodies, followed by immunoblotting with indicated antibodies. The number indicated the quantification of proteins for blots determined by ImageJ. The representative data are shown from 3 independent experiments. (d), Hep3B cell lysates upon vehicle (Veh) or 0.1 mM UK5099 treatment for 24 hours were immunoprecipitated with IgG or 4A1, followed by crosslinking with BMH. The complexes were determined by immunoblotting via SDS-PAGE with indicated antibodies. The representative data are shown from 3 independent experiments. (e, f) Hep3B cell lysates upon vehicle (Veh) or 0.1 mM UK5099 treatment for 24 hours were immunoprecipitated with IgG, MPC1 (e) or MPC2 (f), followed by crosslinking with BMH. The complexes were determined by immunoblotting via SDS-PAGE with indicated antibodies. The representative data are shown from 3 independent experiments. (g) Recombinant MPC1 and MPC2 proteins incubated with or without 4A1 protein were subjected to 4%–16% BN-PAGE for MPC1 and MPC2 oligomerization or were subjected to SDS-PAGE for the levels of the total proteins used for normalization. The number indicated intensity of oligomerization normalized by total proteins determined by ImageJ. The representative data are shown from 2 independent experiments. (h, i) Recombinant MPC1 (h) and MPC2 (i) proteins incubated with or without 4A1 proteins were subjected to 4%–8% BN-PAGE for MPC1 and MPC2 oligomerization or were subjected to SDS-PAGE. * indicated oligomeric MPC1/MPC2 complexes in the presence of ALDH4A1 proteins. The representative data are shown from 2 independent experiments. (j) Recombinant MPC1 and MPC2 proteins incubated with or without 4A1 proteins were subjected to 4%–10% BN-PAGE, followed by mass spectrometry analysis from the bands boxed by red lines. The bands contain the peptides from MPC1, MPC2 and ALDH4A1 proteins identified by mass spectrometry. The representative data are shown from 3 independent experiments. (k) Recombinant MPC1 and MPC2 proteins incubated with 4A1 proteins were subjected to 4%–16% BN-PAGE. 1D native gel strip was proceeded for BN-PAGE again, followed by immunoblotting with indicated antibodies. Red arrows indicated the complex of ALDH4A1, MPC1 and MPC2 in 2D-BN/BN-PAGE. The representative data are shown from 2 independent experiments.
Extended Data Fig. 9 |
Extended Data Fig. 9 |. ALDH4A1 displays glycolytic suppression in steady-state and hypoxia conditions.
(a) Seahorse ECAR assay normalized by the actual cell count during the experiment was performed in Hep3B cells upon shLuc with vector (vec), sh4A1 with vec, sh4A1 with 4A1WT and shLuc with 4A1WT, followed by the treatment of 0.5 μM Rotenone/Antimycin (Rot/AA) and 50 mM 2-DG. Data are presented as mean ± s.d by two-way ANOVA from 9 biological replicates (n = 9). shLuc+vec vs. sh4A1+vec, ***P < 0.001; shLuc+vec vs. shLuc+4A1, ***P < 0.001; sh4A1+vec vs. sh4A1 + 4A1WT, ***P < 0.001. (b) Immunoblotting of cancer cell lines under hypoxia condition with indicated antibodies. (c, e) Seahorse glycolysis stress assay normalized by the actual cell count during the experiment was performed in Hep3B cells upon shLuc, sh4A1 (#1 and #2), sh4A1 #2 with 4A1WT (c), or upon vec, 4A1WT (e), followed by the treatment of 10 mM glucose, 3 μM oligomycin and 50 mM 2-DG under hypoxia condition. Data are presented as mean ± s.d by two-way ANOVA from 3 biological replicates (n = 3). shLuc vs. sh4A1#1, ***P < 0.001; shLuc vs. sh4A1 #2, ***P < 0.001; sh4A1 #2 vs. 4A1WT, ***P < 0.001. (d, f) Seahorse ECAR assay normalized by the actual cell count during the experiment was performed in Hep3B cells upon shLuc, sh4A1 (#1 and #2), sh4A1 #2 with 4A1WT (d), or upon vec, 4A1WT (f), followed by the treatment of 0.5 μM Rotenone/Antimycin (Rot/AA) and 50 mM 2-DG under hypoxia condition. Data are presented as mean ± s.d by two-way ANOVA from 4 biological replicates (n = 4). shLuc vs. sh4A1 #1, ***P < 0.001; shLuc vs. sh4A1 #2, ***P < 0.001; sh4A1 #2 vs. 4A1WT, ***P < 0.001; vec vs. 4A1WT, ***P < 0.001. (g) Seahorse ECAR assay normalized by the actual cell count during the experiment was performed in Hep3B cells upon shLuc or sh4A1 treated with low or high glutamine (Gln), followed by the treatment of 0.5 μM Rotenone/Antimycin (Rot/AA) and 50 mM 2-DG. Data are presented as mean ± s.d by two-way ANOVA from 6 biological replicates (n = 6). shLuc+low Gln vs. sh4A1+low Gln, ***P < 0.001; shLuc+ high Gln vs. sh4A1+high Gln, ***P < 0.001; shLuc+low Gln vs. shLuc+high Gln, NS; sh4A1+low Gln vs. sh4A1+high Gln, NS. NS, non-significant. (h) Seahorse ECAR assay normalized by the actual cell count during the experiment was performed in Hep3B cells upon shLuc or sh4A1 treated with BSA or Palmitate, followed by the treatment of 0.5 μM Rotenone/Antimycin (Rot/AA) and 50 mM 2-DG. Data are presented as mean ± s.d by two-way ANOVA from 3 biological replicates (n = 3). shLuc+BSA vs. sh4A1+BSA, ***P < 0.001; shLuc+Palmitate vs. sh4A1+Palmitate, ***P < 0.001; shLuc+BSA Gln vs. shLuc+Palmitate, NS; sh4A1+BSA vs. sh4A1+Palmitate, NS. NS, non-significant. (i) Working model revealing the role of ALDH4A1 in maintaining an active MPC complex for mitochondrial pyruvate import and TCA cycle entry. In normal cells and cancer cells with intact ALDH4A1 expression, ALDH4A1 forms a trimeric complex with MPC1 and MPC2 to maintains an active MPC complex for facilitating pyruvate import into mitochondria, thereby subsequently driving TCA cycle entry. Deficiency of ALDH4A1 commonly found in diverse human cancers disrupts active MPC complex and impairs mitochondrial pyruvate import for TCA cycle entry, thus likely promoting Warburg effect leading to cancer cell growth and tumorigenesis.
Extended Data Fig. 10 |
Extended Data Fig. 10 |. Fold change of the metabolites involving in proline and urea cycle pathways according to metabolomic analysis.
The targeted LC/MS metabolic profiling of proline, pyruvate, glutamate, arginine, ornithine and histidine from control, ALDH4A1 knockdown, ALDH4A1 knockdown Hep3B cells with restoration of ALDH4A1WT or ALDH4A1S352L. P-values were calculated by two tailed unpaired t-test from 3 biological replicates (n = 3).
Fig. 1 |
Fig. 1 |. ALDH4A1 suppresses cancer cell growth and tumourigenesis.
a, The relative proliferation and ALDH4A1 protein levels in Hep3B, Huh7 and HepG2 cells transfected with control shRNA (shLuc) or two different shRNA targeting ALDH4A1 (sh4A1 #1 and #2) after 5,000 cells per well were cultured in a six-well plate for 10 days. Data are mean ± s.d. from three biological replicates (n = 3). The representative immunoblotting data are shown from three independent experiments. b,d,f, Immunoblotting of Hep3B (b), Huh7 (d) and HepG2 (f) cells upon transfection with shLuc, sh4A1 (#1 and #2), sh4A1 restored by wild-type ALDH4A1 (4A1WT) or shLuc plus 4A1WT. The representative data are shown from three independent experiments. c,e,g, The relative cell proliferation in Hep3B cells (c), Huh7 cells (e) and HepG2 cells (g) upon transfection with shLuc, sh4A1 (#1 and #2), shLuc or sh4A1 plus vector or 4A1WT expression. The relative cell proliferation in HepG2 upon shLuc, shp53 (#1 and #2) and shRb (#1 and #2) is shown in g. Data are as mean ± s.d. from three biological replicates (n = 3). hj, The subcutaneous injection xenograft model was performed with control or ALDH4A1 knockdown (#1 and #2) Hep3B cells. Tumour nodules (h), tumour weight (i) and growth curves of tumour volume (j) in control or shALDH4A1 Hep3B xenografts are shown on indicated days. Data are mean ± s.d. from five biological replicates (n = 5). *P < 0.05, **P < 0.01, ***P < 0.001, by two-tailed unpaired t-test. NS, not significant. Scale bar, 1 cm.
Fig. 2 |
Fig. 2 |. ALDH4A1 suppresses cancer cell growth and tumourigenesis independently of its enzymatic activity.
a,b, Proline levels (a) and glutamate levels (b) in Hep3B cells upon transfection with shLuc plus pLOC vector(Vec) or sh4A1#1 plus vector, 4A1WT or S352L mutant ALDH4A1 (4A1S352L) were determined by liquid chromatography–mass spectrometry (LC–MS). Data are mean ± s.d. from three biological replicates. c,d, Immunoblotting and relative proliferation levels of Hep3B cells stably expressing shLuc, sh4A1, or sh4A1 restored by 4A1WT. The representative immunoblotting data are shown from three independent experiments (c). Data are mean ± s.d. from six biological replicates (d). eg, Immunoblotting (e) and relative proliferation levels (f,g) of Hep3B cells (e,f) or HepG2 cells (g) stably expressing shLuc, sh4A1, or sh4A1 restored by 4A1WT or 4A1S352L. The representative immunoblotting data are shown from three independent experiments (e). h,i, Hep3B cells upon transfection with shLuc, sh4A1, sh4A1 with vector or 4A1WT, or shLuc with vector or 4A1WT were subcutaneously injected into nude mice (n = 5) for xenograft tumourigenesis assay. Tumour nodules (h) and growth curves of tumour volume (i) in xenograft tumours are shown on indicated days. Scale bar, 1 cm. j, Tumour lysates from xenograft tumour isolated from nude mice inoculated with Hep3B cells after transfection with shLuc, sh4A1, shLuc with either vector or 4A1WT, or sh4A1 with either vector or 4A1WT were subjected to immunoblotting assay. km, Hep3B cell upon sh4A1 with either vector, 4A1WT or 4A1S352L were subcutaneously injected into nude mice (n = 5) for xenograft tumourigenesis assay to indicate tumour nodules (k), tumour weight (l) and growth curves of tumour volume (m). Data are mean ± s.d. from five biological replicates. *P < 0.05, **P < 0.01, ***P < 0.001, by two-tailed unpaired t-test (a,b,d,f,g,l) or one-way ANOVA with Bonferroni post-hoc tests (i,m).
Fig. 3 |
Fig. 3 |. ALDH4A1 is required for mitochondrial pyruvate import and pyruvate metabolism.
a, Left, images showing the subcellular localization of ALDH4A1 (red) and TOMM20 (green). DAPI (4′,6-diamidino-2-phenylindole) was used to counterstain the nucleus (blue). Scale bars, 20 μm. Middle, the intensity of ALDH4A1 (red) and TOMM20 (green) within the same distance was quantified by ImageJ, indicating the colocalization. Right, the average percentage of colocalization area between ALDH4A1 and TOMM20 from five biological replicates. b, The targeted LC–MS metabolic profiling of control, ALDH4A1 knockdown, ALDH4A1-knockdown with restoration of wild-type ALDH4A1 (4A1WT) or S352L mutant ALDH4A1 (4A1S352L) Hep3B cells. Data are mean ± s.d from three biological replicates (n = 3). c, The pyruvate levels from targeted LC–MS metabolic profiling in the indicated groups. Data are mean ± s.d from three biological replicates (n = 3). d, The OCR assay normalized by cell count was performed in Hep3B cells upon transfection with shLuc, sh4A1 or sh4A1 with restoration of either 4A1WT or 4A1S352L treated with 3 μM oligomycin (oligo), 4 μM FCCP or 0.5 μM rotenone-antimycin A (Rot–AA). Data are mean ± s.d from three biological replicates (n = 3). In d, shLuc+Vec versus sh4A1+Vec, ***P < 0.001; sh4A1+Vec versus sh4A1 + 4A1WT, ***P < 0.01; sh4A1+Vec versus sh4A1 + 4A1S352L, ***P < 0.001. e,f, The relative abundance of acetyl-CoA was detected in the mitochondrial fraction of Hep3B cells transfected with shLuc or shALDH4A1 (e), and in Hep3B cells transfected with shLuc, shALDH4A1, or shALDH4A1 plus 4A1WT (f). Data are mean ± s.d from three biological replicates (n = 3). g, The isotopomeric distribution of metabolites derived from 13C-pyruvate. 13C atoms are marked as filled circles. h, From the 13C-pyruvate tracing dataset, the relative enrichment of M2 indicated metabolites in control, ALDH4A1-knockdown, or ALDH4A1-knockdown with restoration of 4A1WT or 4A1S352L Hep3B cells is shown. Data are mean ± s.d from three biological replicates (n = 3). OAA, oxaloacetate; DHAP, dihydroxyaacetone phosphate; PEP, phosphoenolpyruvate. i, The OCR assay normalized by cell count was performed in Hep3B cells upon transfection with shLuc or sh4A1 and treatment with BSA or palmitate, followed by treatment with 3 μM oligomycin, 4 μM FCCP or 0.5 μM Rot–AA. Data are mean ± s.d from three biological replicates (n = 3). In i, shLuc+BSA versus sh4A1+BSA, ***P < 0.001; shLuc+BSA versus shLuc+palmitate, ***P < 0.001; sh4A1+BSA versus sh4A1+palmitate, ***P < 0.001. j, The OCR assay normalized by cell count was performed in Hep3B cells upon transfection with shLuc or sh4A1 and treatment with low or high glutamine (Gln), followed by treatment of 3 μM oligomycin, 4 μM FCCP or 0.5 μM Rot–AA. Data are mean ± s.d from three biological replicates (n = 3). In j, shLuc+low Gln versus sh4A1+low Gln, ***P < 0.001; shLuc+low Gln versus shLuc+high Gln, **P < 0.01; sh4A1+low Gln versus sh4A1+high Gln. *P < 0.05, **P < 0.01, ***P < 0.001, by two-tailed unpaired t-test (b,c,e,f,h) or by two-way ANOVA (d,i,j).
Fig. 4 |
Fig. 4 |. ALDH4A1 maintains pyruvate import into mitochondria in a MPC1–MPC2-dependent manner.
ac, Pyruvate uptake was determined after incubating 14C-pyruvate with isolated mitochondria upon transfection with shLuc and sh4A1 (#1 and #2) in Hep3B (a), Huh7 (b) and HepG2 (c). Data are mean ± s.d from three biological replicates (n = 3). d, Immunoblotting of NIH3T3 cells upon transfection with shLuc, sh4A1 (#1 and #2), or sh4A1 (#1) with 4A1WT restoration. e, Pyruvate uptake was determined after incubating 14C-pyruvate with isolated mitochondria in NIH3T3 cells upon transfection with shLuc, sh4A1 (#1 and #2) and sh4A1 plus 4A1WT. Data are mean ± s.d from three biological replicates (n = 3). f, Quantification of imported 14C-pyruvate uptake into isolated mitochondria from Hep3B cells stably expressing haemagglutinin (HA) vector control (Vec), HA–ALDH4A1 (4A1), shLuc, shMPC1 or after treatment with 0.1 mM UK5099. Data are mean ± s.d from three biological replicates (n = 3). g, Quantification of imported 14C-pyruvate uptake into isolated mitochondria from Hep3B cells stably expressing shLuc, sh4A1#1, shMPC1, or sh4A1 restored by 4A1WT. Data are mean ± s.d from three biological replicates (n = 3). h, The kinetics of pyruvate import assay presented in a concentration-dependent manner by incubating 14C-pyruvate with mitochondria from Hep3B cells transfected with shLuc or sh4A1. The Km and Vmax values were calculated using the Michaelis–Menten equation. i, The pyruvate import assay presented in a time-dependent manner by incubating 14C-pyruvate with mitochondria from Hep3B cells upon transfection with vector plus shLuc or sh4A1, and sh4A1 plus 4A1WT or 4A1S352L. Data are mean ± s.d. from three biological replicates (n = 3). *P < 0.05, **P < 0.01, ***P < 0.001, by two-tailed unpaired t-test (ac,eg) or by one-way ANOVA with Bonferroni post-hoc tests (i).
Fig. 5 |
Fig. 5 |. ALDH4A1 interacts with the MPC1–MPC2 complex and is required for constituting the MPC1–MPC2 complex.
a,b, Cell lysates from Hep3B (a) and 293T (b) cells upon transfection with shLuc, sh4A1 and shMPC1–MPC2 were subjected to immunoprecipitation (IP) with IgG, MPC2 or MPC1 antibodies, followed by immunoblotting with indicated antibodies. The number indicates the quantification of proteins for blots determined by ImageJ. c,d, In vitro glutathione S-transferase (GST) pull-down assay using recombinant MPC1 (c) and MPC2 (d) proteins purified from E. coli incubated with either GST or GST–4A1 proteins, followed by western blotting (WB) with indicated antibodies. e, BRET was conducted to determine the MPC1–MPC2 interaction in the presence or absence of pyruvate stimulation in Hep3B cells transfected with shLuc plus vector, sh4A1 plus vector, or sh4A1 plus 4A1WT restoration. Data are mean ± s.d from three biological replicates (n = 3). f, Hep3B cells transfected with shLuc plus vector, sh4A1 with vector, or sh4A1 with 4A1WT restoration were subjected to immunoprecipitation with IgG and Flag antibodies, followed by immunoblotting analysis. g, The illustration of the full-length (1–564 amino acids) ALDH4A1 (4A1FL) and two deletion mutants (4A1Δ182–199 and 4A1Δ554–564). h,i, 293T cell lysates upon Flag vector, 4A1FL, 4A1Δ182–199 and 4A1Δ554–564 overexpression were subjected to immunoprecipitation with IgG, MPC1 (h) or HA antibody (i), followed by immunoblotting analysis with indicated antibodies. j, Immunoblotting of 293T cells upon transfection with shLuc with vector, sh4A1 with vector, 4A1FL, 4A1Δ182–199 and 4A1Δ554–564 using the indicated antibodies. k, Proline levels in 293T cells upon shLuc with vector and sh4A1#1 vector, 4A1FL, 4A1Δ182–199 and 4A1Δ554–564 expression. Data are mean ± s.d from three biological replicates (n = 3). l, Pyruvate uptake was determined after incubating 14C-pyruvate with isolated mitochondria from 293T cells upon transfection with shLuc with vector, sh4A1#1 with vector, 4A1FL, 4A1Δ182–199 and 4A1Δ554–564 restoration. Data are mean ± s.d from three biological replicates (n = 3). *P < 0.05, **P < 0.01, ***P < 0.001, by two-tailed unpaired t-test (e,l,k).
Fig. 6 |
Fig. 6 |. ALDH4A1 is essential for maintaining MPC1–MPC2 oligomerization.
a, Immunoblotting of expressing control vector, MPC1–Flag and MPC2–HA accompanied by vector, wild-type ALDH4A1 (4A1WT) and mutant ALDH4A1 (4A1S352L) expression using indicated antibodies, determined by SDS–PAGE. b, BN-PAGE for MPC1, MPC2 and 4A1 oligomerization assays using the isolated mitochondria from Hep3B cells upon vector, MPC1–Flag and MPC2–HA with vector, 4A1WT and 4A1S352L expression. c, Immunoblotting of Hep3B cells upon shLuc plus vector, sh4A1 (#1) plus vector, sh4A1#1 with 4A1WT, and 4A1S352L expression using indicated antibodies, determined by SDS–PAGE. d, BN-PAGE for MPC1, MPC2 and 4A1 oligomerization assays using the isolated mitochondria from Hep3B cells upon shLuc plus vector, sh4A1 (#1 and #2) plus vector, sh4A1#1 plus 4A1WT, and 4A1S352L expression. e, Immunoblotting of Hep3B cells upon shLuc plus vector, sh4A1#1 plus vector, sh4A1#1 plus 4A1WT, and 4A1S352L expression using indicated antibodies, determined by SDS–PAGE. f, 14C-pyruvate incubated with isolated mitochondria upon shLuc with vector and sh4A1#1 with vector, 4A1WT, 4A1S352L and 4A1Δ182–199 restoration in Hep3B cells. Data are mean ± s.d from three biological replicates (n = 3). g, BN-PAGE for MPC1, MPC2 and 4A1 oligomer and monomer using the isolated mitochondria from Hep3B cells upon vector, sh4A1#1 plus vector, sh4A1 plus 4A1WT, shLuc plus 4A1S352L and sh4A1 plus 4A1Δ182–199 expression. The representative data are shown from three independent experiments. h, Isolated mitochondria from Hep3B cells upon transfection with shLuc, shMPC1, shMPC2 and shMPC1–MPC2 were subjected to immunoblotting via BN-PAGE or SDS–PAGE with indicated antibodies. The representative data are shown from two independent experiments. i,j, Immunoblotting via BN-PAGE of Hep3B cell lysate stably expressing shLuc, and shMPC1 (i) or shMPC2 (j) immunoprecipitated with IgG or 4A1 antibody. SDS–PAGE represents the input. The red asterisk indicates the oligomeric complex. The representative data are shown from three independent experiments. k, Immunoblotting via BN-PAGE of Hep3B cell lysate expressing shLuc or shMPC1–MPC2 immunoprecipitated with IgG or 4A1 antibody. SDS–PAGE represents the input. The red asterisk indicates the oligomeric complex. The representative data are shown from two independent experiments. l, Immunoblotting via BN-PAGE of Hep3B cell lysate expressing shLuc or sh4A1 immunoprecipitated with IgG or MPC2. SDS–PAGE represents the input. The red asterisk indicates the oligomeric complex. The representative data are shown from three independent experiments. m, Immunoblotting of Hep3B cells upon treatment with vehicle (Veh) or 0.1 mM UK5099 for 24 h with indicated antibodies. The representative data are shown from two independent experiments. n, Hep3B cell lysates upon treatment with vehicle or 0.1 mM UK5099 for 24 h were immunoprecipitated with IgG or 4A1, followed by immunoblotting via BN-PAGE with indicated antibodies. The representative data are shown from three independent experiments. o,p, Recombinant MPC1 and MPC2 proteins incubated with or without 4A1 protein crosslinked with BMH for the oligomerization of MPC1 (o) and MPC2 (p) followed by SDS–PAGE. The representative data are shown from three independent experiments. In the blots, one asterisk indicates the monomer, and two asterisks indicate the dimer. *P < 0.05, **P < 0.01, ***P < 0.001, by two-tailed unpaired t-test (f).
Fig. 7 |
Fig. 7 |. ALDH4A1 forms trimeric complex with MPC1 and MPC2 for pyruvate binding and transport in an in vitro reconstituted proteoliposomes system.
a, 293T cells transiently expressing MPC1–Flag and MPC2–HA were collected and subjected to the first immunoprecipitation with Flag antibody, followed by elution with Flag peptide. The supernatant containing protein complexes subsequently immunoprecipitated with ALDH4A1 antibody was subjected to immunoblotting with the indicated antibodies. b, Mitochondrial lysates were prepared for gel filtration. The fractions of numbers 1–36 were subjected to immunoblotting with indicated antibodies. The trimeric complex of ALDH4A1, MPC1 and MPC2 is boxed with red lines. c, The structures of protein interactions among ALDH4A1, MPC1 and MPC2 were predicted using AlphaFold 2. The predicted structural models were analysed by using ChimeraX-Daily, with ALDH4A1 in purple, MPC1 in pink, and MPC2 in green. The potential interactive region with MPC1 and MPC2, amino acids 191–198 from ALDH4A1, is highlighted in yellow according to two models from AlphaFold 2. The red lines indicate the interaction of protein complex less than 5 Å. d, The recombinant proteins of 4A1WT, MPC1 and MPC2 expressed and purified in E. coli BL21, were cleaved with PreScission protease, and purified recombinant proteins were subjected to SDS–PAGE, followed by Coomassie brilliant blue staining (CBB). e, Left, representative image for proteoliposomes integrated with recombinant proteins ALDH4A1 (4A1), MPC1 and MPC2 and incubation with 14C-pyruvate. Right, immunoblotting analysis indicates the presence of recombinant proteins in a proteoliposomes incubated with recombinant MPC1, MPC2, MPC1–MPC2, MPC1–MPC2 plus 4A1WT, 4A1S352L, 4A1WT or 4A1S352L proteins. f, Proteoliposomes were incubated with recombinant MPC1, MPC2, MPC1–MPC2, MPC1–MPC2 plus 4A1WT or 4A1S352L proteins and subjected to in vitro pyruvate transport assay using 14C-pyruvate. g, Proteoliposomes incubated with recombinant MPC1–MPC2, MPC1–MPC2 plus 4A1WT or MPC1–MPC2 plus 4A1S352L and subjected to in vitro pyruvate transport assay using 14C-pyruvate at different timepoints. Data are mean ± s.d. -from three biological replicates (n = 3). *P < 0.05, **P < 0.01, ***P < 0.001, by two-tailed unpaired t-test. All representative immunoblotting data are shown from two independent experiments.
Fig. 8 |
Fig. 8 |. ALDH4A1 maintains MPC activity to restrict glycolysis, cancer cell proliferation and tumourigenesis.
ac, The relative cancer cell proliferation after treatment with vehicle (0) or UK5099 (0.1 mM) for 24 h in control Hep3B cells (a), Hep3B cells with MPC1 knockdown (shMPC1) (b) or Hep3B cells with MPC2 knockdown (shMPC2) (c). d, The glycolytic reserve of ECAR was evaluated in control cells (shLuc), or cells after ALDH4A1 knockdown (sh4A1) or ALDH4A1 knockdown with ALDH4A1 restoration and overexpression (4A1WT). e, Left, representative images of Hep3B cells upon shLuc, sh4A1 (#1 and #2) and sh4A1#1 restoration of 4A1WT, refreshed with glucose-free and 0.5% FBS-containing medium for 6 h. Right, cells were treated with the fluorescent analogue 2-NBDG for 60 min, and glucose uptake was analysed by fluorescence microscopy. Relative levels of 2-NBDG uptake into the cells upon shLuc, sh4A1 (#1 and #2) and sh4A1 (#1) restoration of 4A1WT. Scale bars, 20 μm. f,g, The relative proliferation in control or ALDH4A1-knockdown Hep3B cells treated with 25 mM glucose (Glu) or its competitor galactose (Gal) (f), or with vehicle and 20 mM 2-DG (g). h, The relative cell proliferation of Hep3B cells after transfection with shLuc plus vector, shLuc plus 4A1WT, shMPC1–MPC2 plus vector, or and shMPC1–MPC2 plus 4A1WT. i,j, Hep3B cells after transfection with shLuc plus vectoror 4A1WT, or with shMPC1–MPC2 plus vector or 4A1WT were subcutaneously injected into nude mice (n = 5) for xenograft tumourigenesis assay to indicate tumour nodules (i) and growth curve of tumour volume (j). k, Tumour lysates from xenograft tumour isolated from nude mice inoculated with Hep3B cells as in i and j were subjected to immunoblotting assay. l, The relative cell proliferation of Hep3B upon shLuc, sh4A1 (#1 and #2) with vector or MPC1–MPC2 overexpression. Data are mean ± s.d. from three biological replicates (n = 3). *P < 0.05, **P < 0.01, ***P < 0.001, by two-tailed unpaired t-test. The representative immunoblotting data are shown from two independent experiments. m, ALDH4A1 is involved in several metabolic pathways, including the TCA cycle, proline biosynthesis and urea cycle. ALDH4A1 forms a trimeric complex with MPC1 and MPC2 to maintain an active MPC complex to facilite pyruvate import into mitochondria, thereby driving entry into the TCA cycle and also participating in proline biosynthesis from glutamate supplied by the TCA cycle or ornithine supplied by urea cycle. Created with BioRender.com (Hsu, C. (2025); https://BioRender.com/p41n715).

References

    1. Gray LR, Tompkins SC & Taylor EB Regulation of pyruvate metabolism and human disease. Cell Mol. Life Sci. 71, 2577–2604 (2014). - PMC - PubMed
    1. Olson KA, Schell JC & Rutter J Pyruvate and metabolic flexibility: illuminating a path toward selective cancer therapies. Trends Biochem. Sci. 41, 219–230 (2016). - PMC - PubMed
    1. Bergers G & Fendt SM The metabolism of cancer cells during metastasis. Nat. Rev. Cancer 21, 162–180 (2021). - PMC - PubMed
    1. Elia I et al. Breast cancer cells rely on environmental pyruvate to shape the metastatic niche. Nature 568, 117–121 (2019). - PMC - PubMed
    1. Bricker DK et al. A mitochondrial pyruvate carrier required for pyruvate uptake in yeast, Drosophila, and humans. Science 337, 96–100 (2012). - PMC - PubMed

Substances