. 2025 Jun;44(12):3381-3412.
doi: 10.1038/s44318-025-00444-x. Epub 2025 May 12.

The microprotein C16orf74/MICT1 promotes thermogenesis in brown adipose tissue

Affiliations

The microprotein C16orf74/MICT1 promotes thermogenesis in brown adipose tissue

Jennie Dinh et al. EMBO J. 2025 Jun.

Abstract

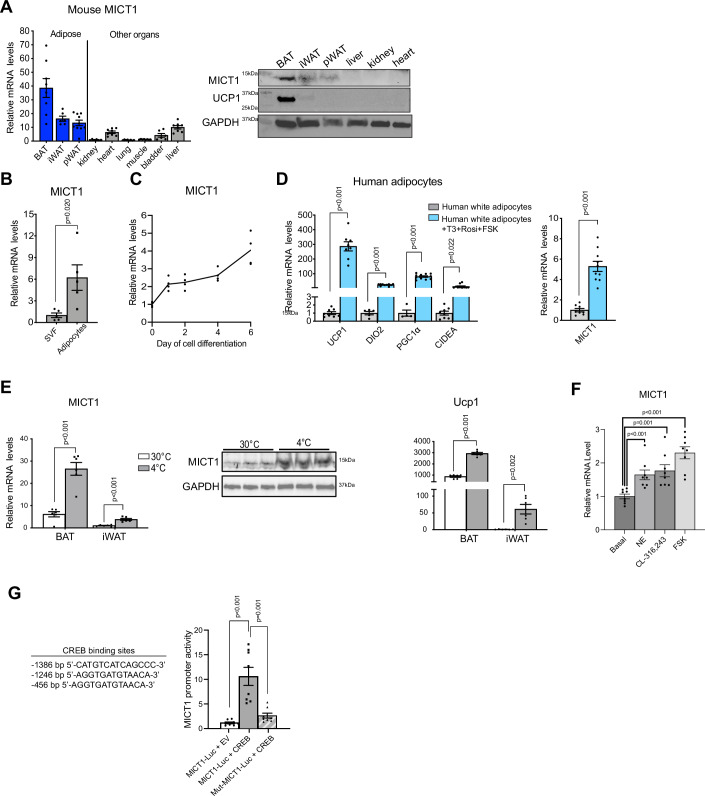
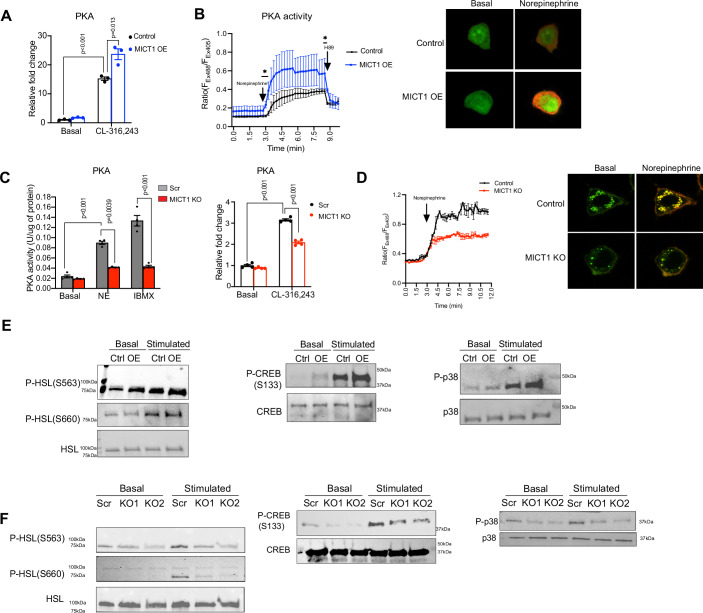
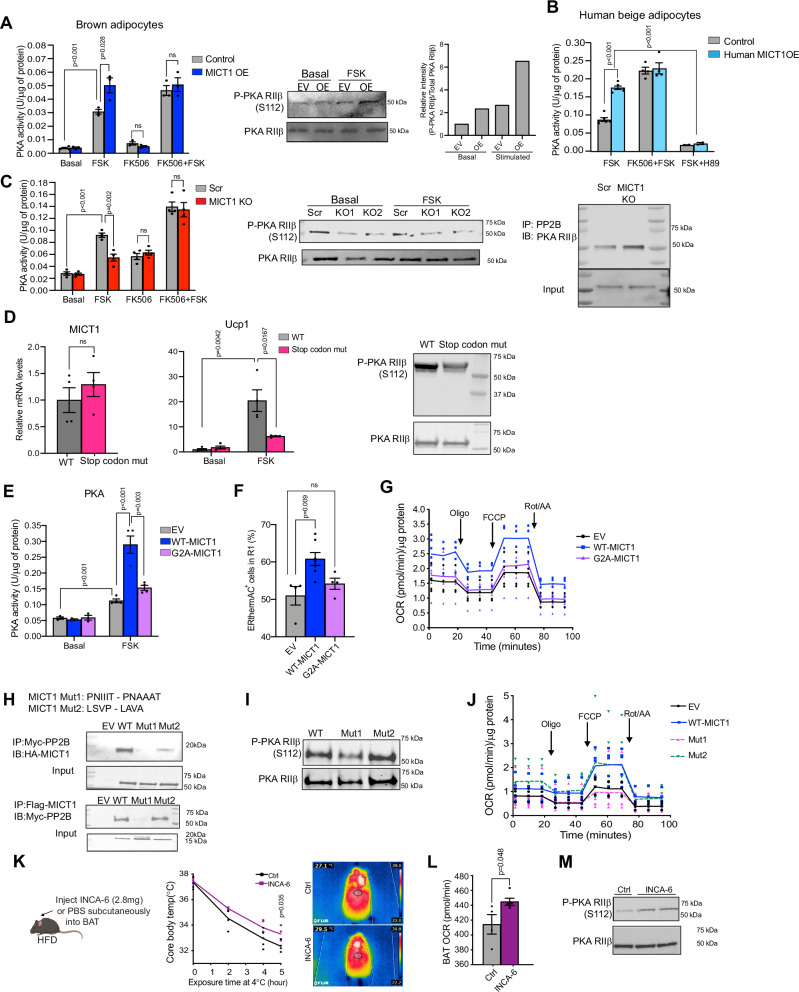
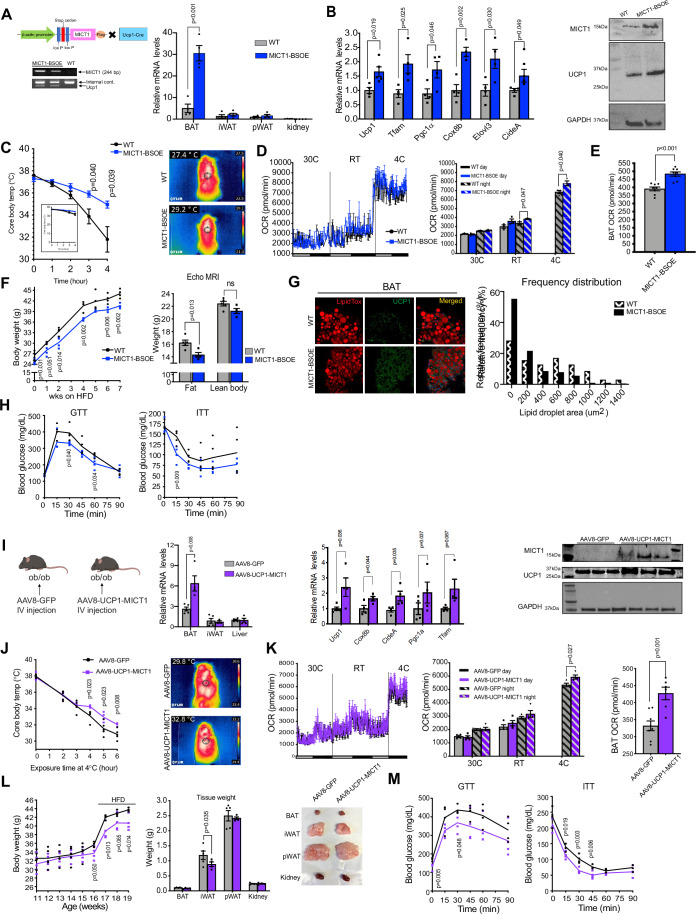
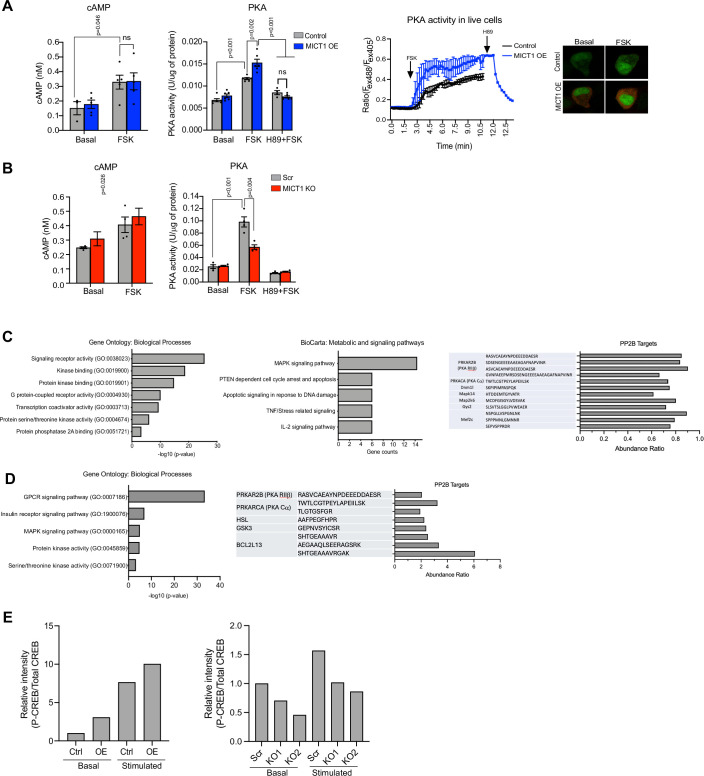
Brown and beige adipose tissues are metabolically beneficial for increasing energy expenditure via thermogenesis, mainly through UCP1 (uncoupling protein 1). Here, we identify C16orf74, subsequently named MICT1 (microprotein for thermogenesis 1), as a microprotein that is specifically and highly expressed in brown adipose tissue (BAT) and is induced upon cold exposure. MICT1 interacts with protein phosphatase 2B (PP2B, calcineurin) through the docking motif PNIIIT, thereby interfering with dephosphorylation of the regulatory subunit of protein kinase A (PKA), RIIβ, and potentiating PKA activity in brown adipocytes. Overexpression of MICT1 in differentiated brown adipocytes promotes thermogenesis, showing increased oxygen consumption rate (OCR) with higher thermogenic gene expression during β3-adrenergic stimulation, while knockdown of MICT1 impairs thermogenic responses. Moreover, BAT-specific MICT1 ablation in mice suppresses thermogenic capacity to increase adiposity and insulin resistance. Conversely, MICT1 overexpression in BAT or treating mice with a chemical inhibitor that targets the PP2B docking motif of MICT1 enhances thermogenesis. This results in cold tolerance and increased energy expenditure, protection against diet-induced and genetic obesity and insulin resistance, thus suggesting a therapeutic potential of MICT1 targeting.

Keywords: Brown Adipose Tissue (Thermogenesis); C16orf74 (MICT1); Microprotein; PP2B (Calcineurin); Protein Kinase A (PKA).


Conflict of interest statement

Disclosure and competing interests statement. The authors declare no competing interests.

Figures

Figure 1
Figure 1. MICT1 is a microprotein highly enriched in brown adipocytes.
(A) RT-qPCR (n = 6–8) and IB of MICT1 in various tissues from 12-wk-old C57BL/6 mice. (B) MICT1 mRNA levels in the adipocyte fraction and SVF of BAT (n = 5). (C) RT-qPCR for MICT1 during BAT cell differentiation (n = 4). (D) RT-qPCR for indicated genes in differentiated human white adipocytes and beige adipocytes treated with T3, rosiglitazone, and forskolin (FSK) (UCP1: P < 0.0001, DIO2: P < 0.0001, PGC1α: P < 0.0001, MICT1: P < 0.0001). (E) RT-qPCR of MICT1 and Ucp1 in BAT and iWAT from mice housed at either 30 °C or 4 °C (n = 6) and IB of MICT1 of BAT from mice housed at 30 °C or 4 °C (n = 3) (BAT MICT1: P < 0.0001, IWAT MICT1: P = 0.0001, BAT Ucp1: P < 0.0001, IWAT Ucp1: P = 0.0018). (F) MICT1 mRNA levels in differentiated BAT cells treated with norepinephrine (NE), CL-316,243 or FSK for 6 h (n = 8, NE: P = 0.0014, CL-316,243: P = 0.0014, FSK: P < 0.0001). (G) HEK293FT cells were transfected with −1.6 kb MICT1 promoter-luciferase reporter or MICT1 mutant promoter-luciferase reporter, in which CRE is mutated along with EV or CREB (n = 8, MICT1-Luc+CREB: P < 0.0002, Mut-MICT1 + CREB: P = 0.0009). Data is expressed as means ± standard errors of the means (SEM) of indicated number of biological replicates. The statistical differences in mean values were assessed by Student’s t test. See also Fig. EV1. Source data are available online for this figure.
Figure 2
Figure 2. MICT1 overexpression promotes on thermogenesis in cultured brown adipocytes.
(A) (Left) RT-qPCR (n = 5, P = 0.0006) and IB for MICT1 in BAT cells transduced with GFP or MICT1 adenovirus for OE on Day 4 of differentiation. (Right) FACS analysis for ERthermAC for MICT1 OE BAT cells (n = 3). Region (R1) of higher temperature is boxed. (B) OCR and uncoupled OCR under oligomycin (0.5 μM), measured in MICT1OE BAT cells treated with CL-316,243 using Seahorse XFe24 analyzer (n = 4–5). (C) RT-qPCR for thermogenic in MICT1 OE BAT cells in the FSK-treated condition (n = 4–6, EV + FSK Ucp1: P = 0.0005, MICT1OE + FSK Ucp1: P = 0.0005, Nrf1: P = 0.0004). (D) RT-qPCR for thermogenic genes in 3T3-L1 adipocytes transduced with GFP or MICT1 adenovirus for OE on Day 4. Cells were treated with either DMSO or NE (n = 4–6). Data is expressed as means ± standard errors of the means (SEM) of indicated number of biological replicates. The statistical differences in mean values were assessed by Student’s t test. See also Fig. EV2.
Figure 3
Figure 3. MICT1 ablation suppresses thermogenesis in cultured brown adipocytes.
(A) OCR measured in MICT1 KD treated with CL-316,243 using Seahorse XFe24 analyzer, and relative uncoupled OCR under oligomycin (0.5 μM) (n = 5, MICT KD: P = 0.0005, MICT1 KD + CL-316,243: P < 0.0001). (B) (Left) RT-qPCR for thermogenic genes in MICT1 KD BAT cells in the FSK-treated condition (n = 6, Pgc1α: P = 0.0001, Elovl3: P = 0.0001, CideA: P = 0.0009). (Right) IB for MICT1 in MICT1 KD BAT cells. (C) (Left) RT-qPCR (n = 5–6, KO-pool1: P < 0.0001, KO-pool2: P = 0.0002) and IB for MICT1 in Scr or MICT1 KO. (Middle) FACS analysis for ERthermAC for MICT1 KO (n = 3). Region (R1) of higher temperature is boxed. (Right) Quantification of number of thermogenic cells in R1. (D) OCR measured in MICT1 KO treated with CL-316,243 using Seahorse XFe24 analyzer, and relative uncoupled OCR under oligomycin (0.5 μM) treatment (n = 4–5, MICT1 KO + CL-316,243: P = 0.0012). (E) (Left) RT-qPCR for indicated genes in Scr or MICT1 KO in the basal (n = 3) and the FSK-stimulated condition (n = 6, Ucp1: P = 0.0017, Pgc1α: P = 0.0093, Tfam: P = 0.0031, Nrf1 = 0.0083, Cox8b: P = 0.0402). (Right) IB for UCP1, NRF1, TFAM, and COX1 in Scr or MICT1 KO. Data is expressed as means ± standard errors of the means (SEM) of indicated number of biological replicates. The statistical differences in mean values were assessed by Student’s t test. See also Fig. EV3.
Figure 4
Figure 4. Plasma membrane localization of MICT1 and its interaction with PP2B.
(A) Primary amino acid sequence of mouse (76 aa) and human MICT1 (76 aa). N-terminal 35aa extension of MICT1 variant is present in mice (111aa MICT1). (B) (Left) HEK 293FT cells transfected with 76 aa form of C-terminal Flag-tagged MICT1. Whole cell lysates (WCL), cytosol (Cyto), or plasma membrane (PM) fractions subjected to IB. (Right) Immunofluorescence (IF) staining of HEK293 cells expressing MICT1-Flag (scale bar: 10 μm). (C) Human MICT1 transfected HEK 293FT cell lysates were fractionated and subjected to IB. (D) (Left) HEK293FT cells transfected with C-terminal Flag-tagged G2A-MICT1 mutant were fractionated and subjected to IB. (Right) IF staining of HEK293FT cells transfected with C-terminal Flag-tagged G2A-MICT1 mutant (scale bar: 10 μm). (E) (Left) HEK 293FT cells transfected with 111 aa form of C-terminal Flag-tagged MICT1 were fractionated and subjected to IB. (Right) IF staining of HEK293 cells expressing MICT1-Flag (scale bar: 10 μm). (F) (Left) BAT from C57BL/6 mice was fractionated and subjected to IB using antibody against C-terminal peptide of MICT1. (G) (Top) Primary amino acid sequences of mouse and human MICT1. Asterisks indicate the amino acid homology between mouse and human MICT1. aa sequence in boxes, (PxIxIT) and (LxVP), are the two consensus PP2B (also called CaN) binding sequences. (Bottom left) Myc-tagged PP2B and Flag-tagged MICT1 were transfected into HEK293 cells, and cell lysates were immunoprecipitated (IP) with Flag antibody followed by IB with Myc antibody and vice versa for a reverse CoIP. (Bottom right) IF staining showing MICT1 and PP2B colocalization at the plasma membrane of HEK293 cells (scale bar: 10 μm). (H) IP of MICT1 in brown adipose tissue from mice overexpressing Flag-tagged MICT1 followed by IB of PP2B. See also Fig. EV4.
Figure 5
Figure 5. MICT1 potentiates PKA activity.
(A) PKA activity measured in the basal condition or after CL-316,243 treatment (n = 3, P < 0.0001). (B) Time course of PKA activity in live control and MICT1 OE HEK cells transfected with ExRai-AKAR2 plasmid (n = 3–4). (Right) Representative cell images of ExRai-AKAR2 response in the control or MICT1 OE cells in the basal or FSK-stimulated conditions. (C) PKA activity measured in MICT1 KO cells under various treatments: NE or IBMX treatments (Left, n = 4, Scr+NE: P = 0.0002, MICT1 KO + NE: P = 0.0039, MICT1 KO + IBMX: P < 0.0001) or CL-316,243 (Right) (n = 4, Control+CL-316,243: P < 0.0001, MICT1 KO + CL-316,243: P < 0.0001). (D) (Left) Time course of PKA activity in live Scr and MICT1 KO cells were transduced with ExRai-AKAR2 lentivirus (n = 3). (Right) Representative cell images of ExRai-AKAR2 response in Scr or MICT1 KO cells in the basal or FSK-stimulated conditions. (E) Lysates from differentiated control or MICT1 OE BAT cells in the basal and FSK-stimulated conditions were subjected to IB for P-HSL (S563 and S660), P-CREB (S133), and P-p38. (F) Lysates from Scr and MICT1 KO cells in the basal and FSK-stimulated conditions used for IB for P-HSL (S563 and S660), P-CREB (S133), and P-p38. Data is expressed as means ± standard errors of the means (SEM) of indicated number of biological replicates. The statistical differences in mean values were assessed by Student’s t test. See also Fig. EV5.
Figure 6
Figure 6. Plasma membrane MICT1-PP2B interaction controls RIIβ dephosphorylation for potentiation of PKA activity and thermogenesis.
(A) Control or MICT1 OE BAT cells were treated with FK506, a PP2B inhibitor. (Left) PKA activity was measured in the basal and FSK-treated conditions (n = 3, Control+FSK: P < 0.0001). (Right) IB of MICT1 OE BAT cells using antibody for P-PKA RIIβ (S112). (B) MICT1 OE human beige adipocytes were treated with FK506. PKA activity was measured in the basal and FSK-treated conditions (n = 4, MICT1 OE + FSK: P < 0.0001, MICT1 OE + FSK + H89: P < 0.0001). (C) Scr or MICT1 KO cells treated with FK506. (Left) PKA activity was measured in the basal and FSK-treated conditions (n = 4, Scr FSK: P < 0.0001). (Middle) IB of MICT1 KO cells using P-PKA RIIβ (S112) antibody. (Right) IB for PKA RIIβ after IP using PP2B antibody in MICT1 KO cell lysates. (D) (Left) RT-qPCR for MICT1 and Ucp1 in HEK293FT cells transfected with MICT1 that had a stop codon inserted at the beginning of MICT1 gene (n = 4, WT + FSK Ucp1: P = 0.0042, Stop codon mut+FSK: P = 0.0167). (Right) IB for P-PKA RIIβ of HEK293FT cells overexpressing WT-MICT1 or MICT1 Stop codon mut. (E) BAT cells transfected with either EV, WT-MICT1 or G2A-MICT1 mutant constructs were differentiated to brown adipocytes. On Day 6, lysates were used to measure PKA activity in the basal and FSK-treated conditions (n = 4, EV + FSK: P = 0.0007, WT + FSK: P = 0.0007). (F) FACS analysis for ERthermAC in BAT cells transfected with either EV, WT-MICT1 or G2A-MICT1 (n = 4). (G) OCR measured in BAT cells overexpressing WT-MICT1 and G2A-MICT1 by using Seahorse XFe24 Analyzer. (H) Two consensus PP2B binding sequences of MICT1 (PNIIIT and LSVP) were mutated to PNAAAT and LAVA, respectively. IB using Flag antibody for MICT1 after IP with Myc antibody for PP2B using lysates from HEK293FT cells transfected with Myc-PP2B and various Flag-MICT1 mutant constructs. IP with Flag antibody for MICT1, followed by IB with Myc antibody for PP2B for a reverse CoIP. (I) IB for P-PKA RIIβ of BAT cells overexpressing WT-MICT1 or Flag-MICT1 mutant constructs. (J) OCR measured in BAT cells overexpressing WT-MICT1, Mut1 or Mut2 by using Seahorse XFe24 Analyzer. (K) Experimental design of INCA-6 injection study. Core body temperature measured at 4 °C at indicated time points (hrs) (n = 4). Infrared thermography of BAT after 4 h of cold exposure at 4 °C. (L) OCR measured in BAT using Seahorse XFe24 Analyzer (n = 4). (M) IB of INCA-6 injected BAT lysates using P-PKA RIIβ (S112) antibody. Data is expressed as means ± standard errors of the means (SEM) of indicated number of biological replicates. The statistical differences in mean values were assessed by Student’s t test. See also Fig. EV6.
Figure 7
Figure 7. MICT1 overexpression in BAT in mice promotes thermogenesis, preventing obesity and insulin resistance.
(A) (Left) Schematic diagram of the strategy used to generate BAT-specific MICT1 conditional OE mice. PCR genotyping of the mice: Top, MICT1 allele; bottom, UCP1-Cre. (Right) RT-qPCR for MICT1 in BAT, iWAT, pWAT, and kidney from WT and MICT1-BSOE mice (n = 4, BAT: P < 0.0001). (B) (Left) RT-qPCR for thermogenic genes in BAT from MICT-BSOE mice (n = 4). (Right) IB for MICT1 and UCP1 in BAT from MICT1-BSOE mice. (C) Core body temperature measured in 14-wks-old mice at 4 °C at indicated time points (n = 5). Infrared thermography of BAT after 6 h of cold exposure at 4 °C. (D) Whole body VO2 assayed in WT and MICT1-BSOE mice, housed at indicated ambient temperatures by indirect calorimetry using CLAMS (n = 5). (E) OCR measured in BAT of WT and MICT1-BSOE mice using Seahorse XFe24 Analyzer (n = 8, P = 0.0001). (F) Body weights of WT and MICT1-BSOE mice on HFD for 7 wks and body composition assessed by EchoMRI (n = 4). (G) (Left) Whole-mount immunostaining of UCP1 (green) and LipidTox (red) in BAT of 24-week-old mice on HFD for 8 wks. (Right) Frequency distribution of lipid droplet areas in BAT. (H) GTT and ITT of WT and MICT1-BSOE mice on HFD (n = 4). (I) (Left) Schematic diagram of the experiment design that 10-wk-old ob/ob mice injected intravenously with control, AAV8-GFP or AAV8-UCP1-MICT1 for MICT1 OE in UCP1+ cells. Mice were on HFD starting at 16.5 wks-old. (Right) RT-qPCR for MICT1 in BAT, iWAT, and liver of AAV8-UCP1-MICT1 mice and control mice (n = 4), RT-qPCR for thermogenic genes in BAT, and IB for MICT1 and UCP1 in BAT from mice (n = 4). (J) Core body temperature measured at 4 °C at indicated time points (n = 4). Infrared thermography of BAT after 6 h of cold exposure at 4 °C. (K) (Left) Whole body VO2 assayed in AAV8-UCP1-MICT1 mice and control mice housed at indicated temperatures by indirect calorimetry using CLAMS (n = 4). (Right) OCR measured in BAT using Seahorse XFe24 Analyzer. (L) Body weights and tissue weights of AAV8-UCP1-MICT1 mice and control mice (n = 4–5). (M) GTT and ITT of AAV8-UCP1-MICT1 mice and control mice on HFD (n = 4). Data is expressed as means ± standard errors of the means (SEM) of indicated number of biological replicates. The statistical differences in mean values were assessed by Student’s t test. See also Fig. EV7.
Figure 8
Figure 8. MICT1 ablation in BAT in mice reduces thermogenic capacity to gain adiposity.
(A) (Left) Schematic diagram of the strategy used to generate BAT-specific MICT1 conditional KO mice. PCR genotyping of the mice: Top, MICT1 allele and floxed allele; bottom, UCP1-Cre. (Right) RT-qPCR for MICT1 in BAT and iWAT from MICT1-BSKO and control mice (n = 4, BAT: P < 0.0001). (B) (Left) RT-qPCR for thermogenic genes in BAT from MICT-BSKO mice (n = 4). (Right) IB for MICT1 and UCP1 in BAT from MICT1-BSKO mice. (C) Core body temperature measured in 13-wks-old mice at 4 °C at indicated time points (n = 4). Infrared thermography of BAT after 3 h of cold exposure at 4 °C. (D) (Left) Whole body VO2 assayed in WT and MICT1-BSKO mice housed at indicated temperatures by indirect calorimetry using CLAMS (n = 4). (Right) OCR measured in BAT of control and MICT1-BSKO mice using Seahorse XFe24 Analyzer. (E) Body weights of control and MICT1-BSKO mice on HFD from 10-wks old and body composition assessed by EchoMRI (n = 4). (F) GTT and ITT of MICT1-BSKO mice and control littermates on HFD (n = 4). (G) IB of P-PKA-RIIβ and total PKA RIIβ of BAT lysates from WT or MICT1-BSKO mice. (H) RT-qPCR for indicated genes in human beige adipocytes transduced with EV or human MICT1 lentiviruses for OE on Day 4 of differentiation (n = 5, UCP1: P = 0.0002). (I) RT-qPCR of MICT1 (n = 5, P < 0.0001) and glucose uptake rate of human beige adipocytes transduced with EV or human MICT1 lentiviruses (n = 12, P < 0.0001). (J) IB of EV or MICT1 OE human beige adipocyte lysates using P-Akt and total Akt antibodies. (K) RT-qPCR of MICT1 (n = 6, P = 0.0011) and glucose uptake rate of human beige adipocytes transduced with Scr or human MICT1 shRNA lentiviruses (n = 12). Data is expressed as means ± standard errors of the means (SEM) of indicated number of biological replicates. The statistical differences in mean values were assessed by Student’s t test. See also Fig. EV8.
Figure EV1
Figure EV1. MICT1 is a microprotein highly enriched in brown adipocytes.
(A) MICT1 protein quantification for various mouse tissues. (B) RT-qPCR for during the course of BAT cell differentiation. (C) Expression of MICT1 in human cultured thermogenic adipocytes, from publicly available RNA-seq data (n = 50, White adipocytes MICT1: P = 0.001, Beige adipocytes MICT1: P = 0.001, White adipocytes PGC1α: P = 0.001, Beige adipocytes PGC1α: P = 0.001, White adipocytes DIO2: P = 0.001). (D) MICT1 protein quantification for mice housed at either 30 °C or 4 °C (n = 3) (E) Schematic of CREB sites in the MICT1 promoter. Data is expressed as means ± standard errors of the means (SEM) of indicated number of biological replicates. The statistical differences in mean values were assessed by Student’s t test.
Figure EV2
Figure EV2. MICT1 impact on thermogenesis in cultured brown adipocytes.
(A) (Left) MICT1 protein quantification in MICT1 OE BAT cells. (Right) OCR measured in MICT1 OE BAT cells that were treated with FSK, and relative uncoupled OCR under oligomycin (0.5 μM) (n = 12, MICT1 OE: P = 0.0041, MICT1 + FSK: P = 0.0009). Data is expressed as means ± standard errors of the means (SEM) of indicated number of biological replicates. The statistical differences in mean values were assessed by Student’s t test.
Figure EV3
Figure EV3. MICT1 ablation suppresses thermogenesis in cultured brown adipocytes.
(A) RT-qPCR in MICT1 KD cells (n = 6). (B) Ratio of mtDNA:gDNA of Scr and MICT1 KO cells in the basal and FSK stimulated condition (n = 3, MICT1 KO + FSK: P = 0.0495). (C) (Left) MICT1 protein quantification in MICT1 KO pool cells. (Right) OCR measured in MICT1 KO pools that were treated with FSK, and relative uncoupled OCR under oligomycin (0.5 μM). (D) (Left) Hierarchical clustering of RNA-seq using differentiated MICT1-KO pools. (Middle) Heatmap showing changes in gene expression in the Scr and MICT1-KO pools. (Right) Representative top GO terms of downregulated genes identified by differential expression analysis. (E) (Left) RT-qPCR for indicated genes in MICT1 KO pools in the basal condition. (Right) RT-qPCR for Ucp1 in MICT1 KO-pools in the basal and CL-316,243 treated conditions. (F) RT-qPCR for MICT1 in Scr and MICT1 KO cells in the basal and CL-316,243-stimulated conditions (n = 3, Scr+FSK: P < 0.0001, MICT1 KO + FSK: P < 0.0001). (G) RT-qPCR (n = 6, MICT1 KO Pparγ: P < 0.0001) and IB for Pparγ and Fabp4 in Scr and MICT1 KO cells in the basal and FSK-stimulated conditions. Data is expressed as means ± standard errors of the means (SEM) of indicated number of biological replicates. The statistical differences in mean values were assessed by Student’s t test.
Figure EV4
Figure EV4. Plasma membrane localization of MICT1 and its interaction with PP2B.
(A) IF images of HEK293FT cells overexpressing 76 aa MICT1 (scale bar: 10 μm), 111 aa MICT1 (scale bar: 10 μm), or G2A-MICT1 (scale bar: 10 μm). (B) IB for MICT1 in lysates from HEK293FT cells overexpressing Flag/HA tagged MICT1 (first lane) and endogenous MICT1 in mouse BAT (second lane). MICT1 in the cytosol and plasma membrane of mouse BAT (third and fourth lane).
Figure EV5
Figure EV5. MICT1 potentiates PKA activity.
(A) (Left) Control and MICT1OE in differentiated BAT cells. cAMP levels and PKA activity were measured in the basal condition or after FSK treatment. Cell permeable H89 was used to verify PKA activity (n = 4, Control+FSK: P = 0.0001, MICT1 OE + H89 + FSK: P = 0.0001). (Right) AKAR images of MICT1 OE cells that were treated with FSK. (B) Differentiated Scr or MICT1 KO-pools were used to measure cAMP levels and PKA activity in the basal condition or after FSK treatment (n = 4, Scr+FSK: P < 0.0001). (C) Phosphoproteomics analysis of MICT1-CRISPR KO brown adipocytes that were treated with FSK. (Left) Gene Ontology and pathway analysis by BioCarta indicate that PKA pathway is the top signaling pathway affected by MICT1 ablation. (Right) Known PP2B targets with significantly decreased phosphorylation abundance ratio and annotated sequences. (D) Phosphoproteomics analysis of MICT1 OE brown adipocytes that were treated with CL-316,243. (Left) Gene Ontology GPCR signaling pathway is the top signaling pathway affected by MICT1 overexpression. (Right) Known PP2B targets with significantly increased phosphorylation abundance ratio and annotated sequences. (E) P-CREB protein quantification for MICT1 OE (left) and MICT1-KO pools (right). Data is expressed as means ± standard errors of the means (SEM) of indicated number of biological replicates. The statistical differences in mean values were assessed by Student’s t test.
Figure EV6
Figure EV6. Plasma membrane MICT1-PP2B interaction controls RIIβ dephosphorylation for potentiation of PKA activity and thermogenesis.
(A) PKA activity (n = 4, MICT1 OE + CL: P = 0.0004, Control+CL + PP2B KD: P < 0.0004) and (B) IB of CL-316,243 stimulated control and MICT1 OE brown adipocytes with or without PP2B. (C) PKA activity of CL-316,243 stimulated Scr and MICT1 KO brown adipocytes with or without PP2B KD (n = 4). (D) P-PKA RIIβ protein quantification for MICT1 OE (left) and MICT1-KO pools (right). (E) IB of MICT1-CRISPR KO brown adipocytes that were treated with CL-316,243. (F) Total-PKA RIIβ protein quantification for Scr and MICT1-KO pool lysates that were pulled down with PP2B antibody. (G) P-PKA RIIβ protein quantification for MICT1 mutants. (H) (Left) P-PKA RIIβ protein quantification for INCA-6 injected BAT lysates. (Right) RT-qPCR for IL-1β and Tnfα in FSK-stimulated MICT1-KO BAT cells that were treated with vehicle or INCA-6 (5μM) for 1 h (n = 4). (I) P-PKA RIIβ protein quantification for MICT1 with stop codon mutation. Data is expressed as means ± standard errors of the means (SEM) of indicated number of biological replicates. The statistical differences in mean values were assessed by Student’s t test.
Figure EV7
Figure EV7. MICT1 overexpression in BAT in mice promotes thermogenesis, preventing obesity and insulin resistance.
(A) RT-qPCR for adipogenic genes in BAT of WT and MICT1-BSOE mice (n = 4). (B) MICT1 protein quantification for MICT1-BSOE mice. (C) IB for MICT1 and UCP1 in BAT from MICT1-BSOE and control female mice. (D) Core body temperature measured in 13-wk-old female mice at 4 °C at indicated time points (n = 4). Data is expressed as means ± standard errors of the means (SEM) of indicated number of biological replicates. The statistical differences in mean values were assessed by Student’s t test.
Figure EV8
Figure EV8. MICT1 ablation in BAT in mice reduces thermogenic capacity to gain adiposity.
(A) RT-qPCR for adipogenic genes in BAT of WT and MICT1-BSKO mice (n = 4). (B) IB for MICT1 and UCP1 in BAT from MICT1-BSKO and control female mice. (C) Core body temperature measured in 13-wk-old female mice at 4 °C at indicated time points (n = 4 mice per group). (D) Body weights and body composition assessed by EchoMRI of control and MICT1-BSKO female mice on HFD (n = 6). (E) GTT of MICT1-BSKO female mice (n = 5). Data is expressed as means ± standard errors of the means (SEM) of indicated number of biological replicates. The statistical differences in mean values were assessed by Student’s t test.

Similar articles

Cited by

References

    1. Anderson DM, Anderson KM, Chang CL, Makarewich CA, Nelson BR, McAnally JR, Kasaragod P, Shelton JM, Liou J, Bassel-Duby R et al (2015) A micropeptide encoded by a putative long noncoding RNA regulates muscle performance. Cell 160(4):595–606 - PMC - PubMed
    1. Bi P, Ramirez-Martinez A, Li H, Cannavino J, McAnally JR, Shelton JM, Sanchez-Ortiz E, Bassel-Duby R, Olson EN (2017) Control of muscle formation by the fusogenic micropeptide myomixer. Science 356(6335):323–327 - PMC - PubMed
    1. Blumenthal DK, Takio K, Hansen RS, Krebs EG (1986) Dephosphorylation of cAMP-dependent protein kinase regulatory subunit (type II) by calmodulin-dependent protein phosphatase. Determinants of substrate specificity. J Biol Chem 261(18):8140–8145 - PubMed
    1. Bock A, Annibale P, Konrad C, Hannawacker A, Anton SE, Maiellaro I, Zabel U, Sivaramakrishnan S, Falcke M, Lohse MJ (2021) Optical mapping of cAMP signaling at the nanometer scale. Cell 184(10):2793 - PubMed
    1. Bradburn DA, Reis JC, Qayyum S, Viennet T, Arthanari H, Cyert MS (2004) A novel motif in calcimembrin/C16orf74 dictates multimeric dephosphorylation by calcineurin. Preprint at 10.1101/2024.05.12.593783

Substances

LinkOut - more resources