. 2025 Jul;44(13):3853-3871.
doi: 10.1038/s44318-025-00449-6. Epub 2025 May 12.

Inhibitors of eIF1A-ribosome interaction unveil uORF-dependent regulation of translation initiation and antitumor and antiviral effects

Affiliations

Inhibitors of eIF1A-ribosome interaction unveil uORF-dependent regulation of translation initiation and antitumor and antiviral effects

Daniel Hayat et al. EMBO J. 2025 Jul.

Abstract

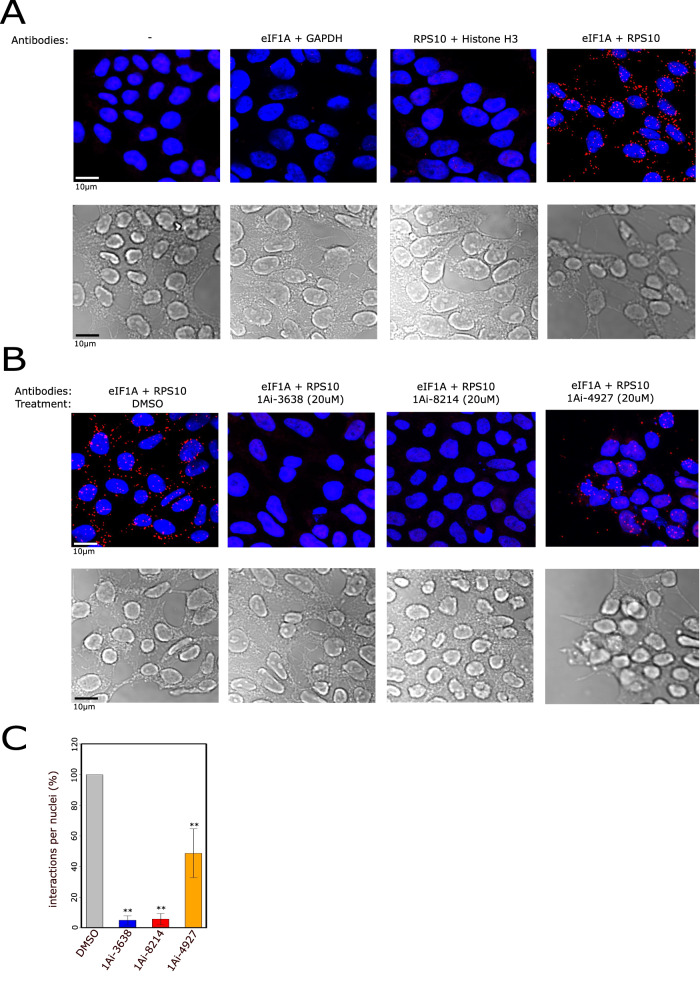
During translation initiation, eIF1A binds the ribosome through its N- and C-terminal tails, but the functional importance of this temporal interaction in mammalian cells is lacking. Using a high-throughput drug screen targeting eIF1A-RPS10 interaction, we identified inhibitors (1Ais) for eIF1A, RPS10, or both. Applying 1Ais in biochemical assays along specific and global translation experiments, we confirmed known functions of eIF1A and uncovered new roles for both eIF1A and RPS10. Specifically, the eIF1A N-terminal tail (NTT) binding inhibitors revealed the requirement of eIF1A for translation re-initiation. Moreover, a cytosine at position +5 relative to the start codon AUG, located near eIF1A-NTT in the 48S structure, enhances sensitivity to 1Ais, suggesting that the initiating ribosome recognizes a broader AUG context than the conventional Kozak. Additionally, eIF1A-specific 1Ais predominately affect cancer-related pathways. In xenograft models of ovarian cancer, these 1Ais reduced tumor growth without apparent toxicity. Furthermore, inhibition of RPS10, but not eIF1A, modulates a context-dependent regulatory translation initiation at CUG codon of SARS-CoV-2 and impedes infection. Our study underscores 1Ais as effective means to study the role of eIF1A and RPS10 in translation and suggests their targeted inhibition as potential therapies for cancer and viral infections.

Keywords: Ovarian Cancer; Rps10; SARS-CoV-2; Translation Reinitiation; eIF1A.


Conflict of interest statement

Disclosure and competing interests statement. The authors (RD and DH) declare a patent application for the 1Ais used in this study. The remaining authors declare no competing interests.

Figures

Figure 1
Figure 1. Discovery of eIF1A-RPS10 inhibitors (1Ais) using a high-throughput drug screen (HTS) in-vitro.
(A) A scheme describing eIF1A and RPS10 split-Renilla constructs used for bacterial expression and in vitro HTS. (B) A flow chart describing the various steps of the screening process for eIF1A-RPS10 interaction inhibitors. (C) The effect of 1Ais on scanning. HEK293T cells were transfected with the described constructs that differ in their 5'UTR (the 111 nt was used as a reference, and the 427 nt is the eIF1A-sensitive IRF7) and exposed to 1Ais. Transfection efficiencies were normalized by a co-transfected GFP reporter gene. Levels of expression from reference and IRF7 5'UTR normalized to GFP were measured after overnight incubation. All of the results are relative to DMSO. Error bars represent SEM, n ≥ 4 independent biological replicates, Student t test comparing to DMSO control was performed, *P < 0.05. (D) The effect of 1Ais on translation initiation fidelity. HEK293T cells were transfected with the constructs that differ in their starting codon. The luciferase protein in these constructs is exclusively initiated from these starting codons. 6 h after transfection, cells were exposed to 1Ais, and the luminescence was measured after overnight incubation. Bars represent the ratio between luminescence from the AUG starting codon and GUG after normalization with co-transfected GFP. Error bars represent SEM, n ≥ 4 independent biological replicates, Student t test comparing to DMSO control, *P < 0.05. A similar experiment with the CUG/AUG ratio is shown in Appendix Fig. S1. (E) 2D plot summarizing the functional assays. The X axis represents short/long 5'UTR and the Y axis translation initiation fidelity (C, D); Appendix Fig. S1A). All data is presented relative to the control of the same experiment. (F) 1Ais affect leaky scanning emerging from very short 5'UTR. HEK293T cells were transfected with the GFP reporter gene schematically shown on the top. Six hours after transfection, cells were treated with 1Ais. Then, after overnight exposure to 1Ais, GFP expression was analyzed by WB. US/DS ratio was determined by densitometry and represents the long protein expression (upstream AUG, US) vs the short protein expression ratio (downstream AUG, DS). Error bars represent SEM, n ≥ 4 independent biological replicates, *P < 0.05, **P < 0.01. Quantification of similar analysis for other 1Ais in shown in Appendix Fig. S1B. Source data are available online for this figure.
Figure 2
Figure 2. Biochemical characterization of 1Ais interaction with eIF1A and RPS10 and the 48S complex.
(A, B) Recombinant eIF1A and Rps10 were each expressed in E. coli, purified and fluorescently labeled. Then, each of these proteins was incubated with increasing amounts of 1Ais. The binding data are presented as a heat map showing the binding of the tested 1Ais with eIF1A (A) and RPS10 (B). These data are also presented as binding curves in Appendix Figs. S2A and 3A. Binding plots of 1Ai-3638, 1Ai-8214 and 1Ai-4927 with purified and fluorescently labeled eIF1A WT or eIF1A without 30 N-terminal or C-terminal amino acids and Rps10, are shown at the bottom. All fluorescence results were normalized to 0 1Ai concentration (DMSO). The IC50 concentrations were calculated using the AAT Bioquest online tool and shown in Appendix Fig. S3C. (C) Rabbit Reticulocyte lysates (RRL) were pre-incubated with 1Ais, and then 48S complexes were formed by the addition of GMP-PNP and in vitro synthesized luciferase mRNA. The 48S complexes were then separated on a sucrose gradient (8–32%), and the OD at 254 nm was measured. Each gradient was separated into top, 48S, and bottom fractions according to the 48S peak location, and samples from each fraction were subjected to TCA precipitation followed by WB testing for the presence of the indicated proteins. Source data are available online for this figure.
Figure 3
Figure 3. 1Ais disrupt eIF1A interaction with RPS10/ribosome in cells.
(AC) HEK293 cells were grown on a glass slide, exposed to the selected 1Ai for 3 h, fixed and subjected to Proximity ligation assay (PLA). Cells were reacted with the indicated matching antibody pairs, control pairs and eIF1A and RPS10 pair (A) and the DMSO and 1Ai-treated cells with the eIF1A and RPS10 pair (B). The samples were treated according to PLA protocol and stained with DAPI to visualize cellular orientation and numbers. PLA dots (red), nuclei (blue) were visualized using confocal microscopy. Each picture is a merge of ~15 pictures covering all cell volume. (C) Quantification of PLA results for eIF1A and RPS10 antibodies and 1Ais treatment, n = 4 independent biological replicates, error bars represent SEM, ** denotes P < 0.01 according to Student t test. Source data are available online for this figure.
Figure 4
Figure 4. 1Ais impairment of translation initiation is related to AUG context and regulation by uORFs.
(A) HEK293 cells were treated with DMSO or 1Ais for 3 h and subjected to polysome profiling by fractionating cell lysates by centrifugation on a sucrose density gradient (10–50%) followed by OD measurement (254 nm) of each fraction. The quantified polysomes to monosomes ratio is shown on the right. The bars represent the mean, n = 2 independent biological replicates. (BI) The effect of translation inhibition by 1Ais on global translation using Ribo-seq. HEK293T cells were treated with DMSO or 1Ai-3638 and 1Ai-8214 for 3 h then cycloheximide addition, followed by preparation of ribosome footprinting libraries, deep sequencing and analysis according to standard RF protocol. In parallel the same samples were also subjected to RNA-seq for total mRNA level measurements. (B) Relative mRNA abundance after 1Ais or DMSO treatment. The bars represent the mean, n = 2–3 independent biological replicates. (C) Metagene analysis. The p-site in each ribosome footprint was located and the ribosomal occupancy of each area on the mRNA was calculated and normalized to mRNA total counts. Data is normalized to the TIS peak. (D) A list summarizing the number of genes that are differentially translated relative to DMSO control (relative TE > 1.5 or relative TE < 0.5). (E) Venn-diagram representing the intersection between genes downregulated by 1Ai-3638 and 8214. The significance of the overlap is P < 10−5 and was calculated by Randomization test. (F) Analysis of the nucleotide context of the annotated start codon of unaffected and 1Ai-3638 and 1Ai-8214 downregulated genes and the overlapping downregulated gene set. Black arrows indicate affected nucleotides. (G) The frequencies of the C + 5 and A/G-3 in 1Ais unaffected and downregulated mRNAs; *P < 0.05, *P < 0.01, Randomization test. (H) Cryo-EM structure of yeast eIF1A, including its NTT in the entry channel of the ribosome (PDB:6ZMW). The distances were measured by Pymol. (I) Three barcoded firefly reporter mutants were generated (scheme on the top) based on the IRF7 5'UTR (IRF7/Kozak, IRF7-C5, IRF7/Kozak-C5). These constructs were co-transfected to HEK293T cells and, 6 h after transfection, incubated with either DMSO, 1Ai-3638, or 1Ai-8214 (20 µM). Cell lysates were fractionated by sucrose gradient sedimentation. RNA was extracted from the polysomes and total fractions followed by DNase I treatment and RT-qPCR using primers specific for each barcode. Data is presented as the ratio of polysomes vs total RNA abundance after 1Ai treatment relative to DMSO; n = 3 independent biological replicates, *P < 0.05, t test, error bars represent SEM. (J) 5'UTR length distribution among downregulated and unaffected genes after 1Ais treatment in which the center = median, box ends = interquartile range (IQR), bottom whisker = minimum. Unchanged are 10,569, 3638 down 246 and 8214 down 325 genes. (K) The number of uORFs per gene among downregulated and unaffected genes. The presence of uORFs was determined based on previous RF data (Sehrawat et al, 2022). (L) A scheme of firefly luciferase reporters that include the reference 5'UTR (Fig. 1C), which was altered to have an uORF starting 46nt (short reinitiation, SRI) or 95 nt (Long reinitiation, LRI) or an AUG 46nt before the main ORF without an in-frame stop codon to create a reporter with leaky scanning (LS). (M) The reference and uORF-bearing reporters were transfected to HEK293T cells together with RL, which served to normalize translation efficiency. The reporter activities are represented as firefly vs RL; n ≥3 independent biological replicates, error bars represent SEM. *P < 0.05, **P < 0.01, Student t test. (N) Firefly Reporters (J) were transfected to HEK293T cells together with normalizing RL. Six hours after transfection, DMSO or 1Ais at 20uM (except 1Ai-5175 at 5uM) were added for overnight incubation. Results are represented as firefly vs. RL normalized to DMSO in each biological replicate; n = 4, error bars represent SEM. *P < 0.05, **P < 0.01, Student t test. Source data are available online for this figure.
Figure 5
Figure 5. 1Ai-3638 and 1Ai-8214 decrease ovarian tumor growth in xenograft mouse model.
(A) Gene and pathways enrichment analysis of 1Ai-3638 and 1Ai-8214 downregulated genes by the Gene Analytics tool. (B) OVCAR8 ovarian carcinoma cell line was incubated with increasing concentrations of 1Ais for 72 h, and then cell viability was assessed. Viability (100%) is normalized to 0 concentration (DMSO), n = 3 independent biological replicates, and error bars represent SD. (C) 1Ais toxicity assessment. Mice weight was measured at different time points after 1Ai-3638 and 1Ai-8214 subcutaneous injection for 3 weeks (assessed every 3–4 days, 3 mice per concentration, 21 mice in total) (D) OVCAR8 cell-derived xenografts weight after 1Ais treatment (10 mice per group). OVCAR8 cells were injected into the ovaries of immunocompromised female mice. Out of ten mice in each group (1Ai-3638,1Ai-8214 and DMSO) nine were included as they presented an ovarian tumor. 1Ais were injected into the mice’s peritoneal cavity five times a week for 4 weeks. Finally, mice were sacrificed, and tumor weight was measured. Results are presented as boxplots in which the center = median, box ends = interquartile range (IQR), bottom whisker = minimum and upper whisker= maximum, n = 9. Weight monitoring of mice during the experiment is presented in Appendix Fig. S3. *P < 0.05, **P < 0.01, Student t test. Source data are available online for this figure.
Figure 6
Figure 6. 1Ai-4927 decreases SARS-COV-2 infection by selective inhibition of a context-specific regulatory CUG element.
(A) 1Ais enhances cell viability after SARS-COV-2 infection. Vero6 cells were incubated with increasing concentrations of 1Ais and infected by the SARS-COV-2 virus. After 72 h, cell viability was measured by counting live cells. The 1Ais that presented a significant effect are presented in Bar plots. 100% represent uninfected cells and the black line cells infected with SARS-COV2 but treated with DMSO. Error bars represent SD of the mean, *P < 0.05, **P < 0.01, n = 3 independent biological replicates. All 1Ai viability plots are shown in Appendix Fig. S4A. (B) Vero6 cells infected by SARS-COV-2 at different multiplicities of infection and treated by 1Ais as described in Fig. 6A. Error bars represent the mean ± SD, n = 2 independent biological replicates. (C) mRNA sample was taken from Vero6 cells rescued by 1Ai-4927 (A) and tested by q-PCR for viral mRNA quantity. (D) The effect of 1Ais on NSP1-mediated inhibition of translation. HEK293T Cells were transfected with NSP1 and a GFP reporter. Cells were incubated overnight with 1Ais, n = 6 for DMSO and no NSP1 and n = 2 for 1Ais treatments. Data for all tested 1Ais is presented in Appendix Fig. S4B. (E) Presentation of ribosomal footprints from SARS-COV-2 infected cells and mapped to the genomic 5'UTR at the regulatory CUG derived from (Finkel et al, ; Kim et al, 2021). (F) SARS-COV-2 ORF7a 5'UTR was inserted upstream to a firefly and Renilla luciferase reporters. The Renilla reporter ORF was aligned with the regulatory CUG 14 by adding one nucleotide after the main AUG. HEK293T cells were co-transfected with both reporters and, after 6 h, incubated with DMSO or 1Ai-4927 overnight. The ratio between the Renilla and Firefly reporters was measured and normalized to DMSO control. Left panel, error bars represent SEM, **P < 0.01 n = 3 independent biological replicates. (G) The same reporters as Fig. 6F were incubated with increasing concentrations of 1Ai-4927, n = 3. (H) Firefly luciferase is driven by the ORF7a 5'UTR with the CUG as the exclusive initiation was constructed. HEK293T cells were transfected with either AUG or CUG starting codon firefly reporter, and 6 h after transfection, cells were incubated with increasing concentrations of 1Ai-4927 overnight. The luciferase signal was measured for CUG and AUG separately and normalized to DMSO. Error bars represent SEM, n = 4 independent biological replicates. Source data are available online for this figure.

References

    1. Asati V, Mahapatra DK, Bharti SK (2016) PI3K/Akt/mTOR and Ras/Raf/MEK/ERK signaling pathways inhibitors as anticancer agents: structural and pharmacological perspectives. Eur J Med Chem 109:314–341. 10.1016/j.ejmech.2016.01.012 - PubMed
    1. Ashkenazi S, Plotnikov A, Bahat A, Ben-Zeev E, Warszawski S, Dikstein R (2016) A novel allosteric mechanism of NF-kappaB dimerization and DNA binding targeted by an anti-inflammatory drug. Mol Cell Biol 36:1237–1247. 10.1128/MCB.00895-15 - PMC - PubMed
    1. Ashkenazi S, Plotnikov A, Bahat A, Dikstein R (2017) Effective cell-free drug screening protocol for protein-protein interaction. Anal Biochem 532:53–59. 10.1016/j.ab.2017.05.030 - PubMed
    1. Bagchi S, Fredriksson R, Wallen-Mackenzie A (2015) In situ proximity ligation assay (PLA). Methods Mol Biol 1318:149–159. 10.1007/978-1-4939-2742-5_15 - PubMed
    1. Bahat A, Lahav O, Plotnikov A, Leshkowitz D, Dikstein R (2019) Targeting Spt5-Pol II by small-molecule inhibitors uncouples distinct activities and reveals additional regulatory roles. Mol Cell 76:617–631. 10.1016/j.molcel.2019.08.024 - PubMed

Substances

LinkOut - more resources